RESEARCH ARTICLE
Received: December 11, 2017, Revised: January 17, 2018, Accepted: January 17, 2018 ISSN 2233-7679 (Online)
†
Correspondence to: Soon-Ryun Lim
Department of Dental Hygiene, The Graduate School of Namseoul University, 91 Daehak-ro, Seonghwan-eup, Seobuk-gu, Cheonan 31020, Korea Tel: +82-41-580-2560, Fax: +82-41-580-2927, E-mail: [email protected]
This article is the revised version of master’s thesis of first author 2018.
Copyright © 2018 by Journal of Dental Hygiene Science
Analysis of Factors Affecting the Quality of Work Life of Dental Hygienists Based on the
Culture-Work-Health Model
Ji-Hyeon Park, Young-Sik Cho, and Soon-Ryun Lim †
Department of Dental Hygiene, The Graduate School of Namseoul University, Cheonan 31020, Korea
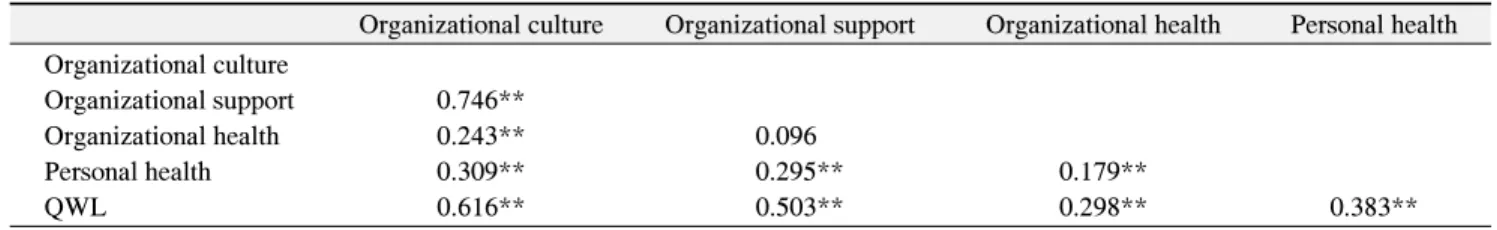
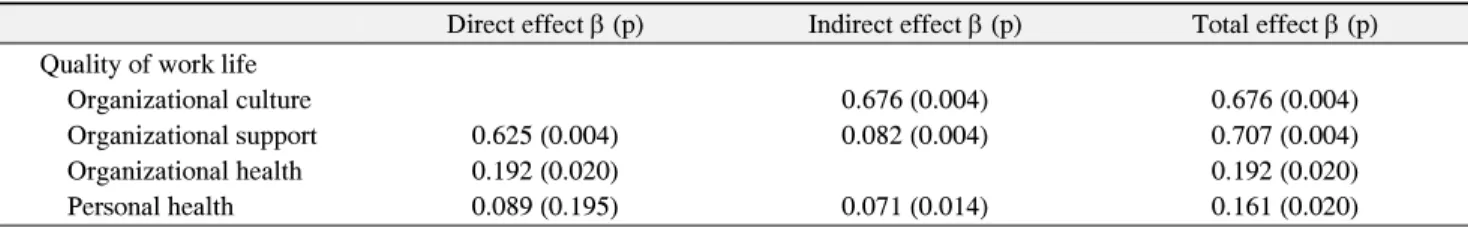
This study investigated the relationship between the organizational culture, organizational support, organizational health, personal health, and quality of work life of dental hygienists and analyzed the factors affecting the quality of work life in order to identify ways to improve their quality of work life. A total of 320 dental hygienists completed a self-administered survey; after excluding data from 21 respondents, 299 responses were included in the analysis. Frequency analyses, t-tests, one-way analysis of variation (ANOVA), and correlation analyses were conducted. A path analysis was also conducted to confirm the causal relationships. The findings are as follows. First, there was a significant difference in several general characteristics of the organizational culture including years in the current job and the number of dental hygienists; organizational support including age and the number of dental hygienists; organizational health including years in the current job and annual salary; and personal health including annual salary. Second, the quality of work life showed a positive correlation with organizational culture, organizational support, personal health, and organizational health in that order. Third, the results of path analysis revealed that organizational culture had a positive effect on organizational support; organizational support and personal health on organizational health; organizational support on personal health; and organizational support and organizational health on quality of work life. In addition, organizational support and organizational health had a direct effect on the quality of work life, while organizational culture, organizational support, and personal health had an indirect effect. These results indicated existence of a relationship among organizational culture, organizational support, organizational health, personal health, and quality of work life. It is necessary to identify ways to improve the quality of work life of dental hygienists.
Key Words: Culture-work-health model, Dental hygienists, Quality of life
Introduction
The World Health Organization defines quality of life as an individual’s perception of their position in the context of the culture and value systems in which they live in relation to their goals, expectations, standards, and concerns 1) . The ‘2015 Quality of Life Report' by the Organization for Economic Cooperation and Development (OECD) objectively evaluated the quality of life. Korea ranked 29th among 36 countries in the level of individuals’ satisfaction with life, scoring 5.80 points out of 10, which was below the average score of 6.58 points
among OECD countries 2) . The National Statistical Office reported the nation’s quality of life to be 5.7 points out of 10 in 2015 3) , indicating that Koreans have a low quality of life.
For workers, the balance between work life and life
outside work affects their satisfaction with life and
themselves. A work-life balance in individuals can
improve organizational productivity and significantly
affect the stability of society 4) . The aspects of quality of
life include work life, meaning that work life is an
important factor related to the quality of life. Work life
directly affects personal life. The term ‘quality of work
life’ (QWL) has been used to assess the quality and satisfaction with work life and much research has been conducted on the factors related to QWL 5) .
Among models developed to explain the QWL, a culture-work-health model has been developed to provide a deeper understanding of the influence of culture on etiologies related to organizational and personal stress.
The key factors of this model include management systems from structural and behavioral aspects, organizational health, workers’ health, and QWL. The aspects of organizational culture include values, beliefs, and attitudes that determine behavioral objectives and methods 6) . Organizational culture affects the management systems of behavioral factors, including worker communication patterns, manager decision-making style and method, worker level of control and autonomy, and levels of feedback and evaluation 6) . The culture-work- health model is explained with a focus on the level of satisfaction with supervisors or co-workers, which can affect an organization or individual worker health. To identify the cultural factors that determine organizational and personal health, a conceptual basis of the model is provided based on the organizational unit culture, occupational stress, personal health, organizational health, and happiness 6) . A study using this model to assess the quality of work life of nurses reported that organizational culture, organizational support, loss of productivity due to presenteeism, and worker health affect the QWL 7) .
Dental hygienists are responsible for the behavioral management and preventive oral care services to prevent oral diseases and improve patient health 8) . Hygienists are responsible for major tasks in oral care and their roles have been expanding in recent years. Dental hygienists’
perception of their QWL is an important aspect of the quality of life and may be an important factor that significantly affects the quality and success of medical services and improves the competitiveness of a dental institution. Studies on the QWL of dental hygienists have only assessed job engagement 5) , job satisfaction 9) , and job stress 9) ; thus, research on the QWL is lacking. It is necessary to investigate dental hygienists’ perceived QWL and to analyze the effects of organizational factors within dental clinics in which the dental hygienists work in
addition to personal and organizational health, on the QWL.
This study used a culture-work-health model to inves- tigate the factors that affect the QWL of dental hygienists with an aim to increase the understanding of dental hygienists’ QWL and to explore ways to improve it.
Materials and Methods
1. Subjects
A total of 320 dental hygienists who worked in dental clinics in metropolitan area, Jeolla, and Chungcheong between December 1, 2016, and January 31, 2017, were selected by convenience sampling and surveyed using a structured questionnaire. The subjects were sufficiently explained about the purpose of this study. Those who voluntarily consented to participate were included as research participants. G*Power 3.1 was used to calculate the sample size based on an effect size of 0.15, level of statistical significance of 0.05, and test power of 0.95. The sample size was calculated to be 204 participants.
Considering the withdrawal rate, a total of 320 question- naires were distributed. After excluding 21 questionnaires that were not completed, a total of 299 questionnaires were used in the final analysis.
This study was approved by the Institutional Review Board of Namseoul University (NSU-161115-08) and was conducted in compliance with the approval standard.
2. Tools
1) Organizational culture
The Organizational Culture Survey developed by Glaser et al. 10) and translated/revised by Kim 11) was used to assess the organizational culture. This tool consists of 20 questions; four questions on teamwork, four questions on morality, three questions on information flow, four questions on employee participation, three questions on supervision, and two questions on customer service. These questions were revised by our researchers to make them easier for dental hygienists to read and understand. Each question was measured on a five-point Likert scale.
Higher scores indicated a more positive organizational
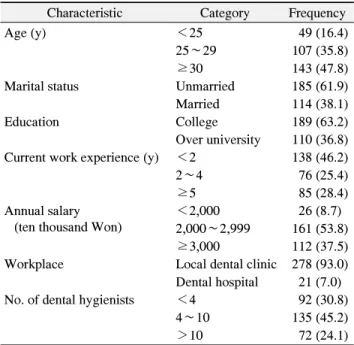
Table 1. General Characteristics of the Participants (n=299)
Characteristic Category Frequency
Age (y) <25 49 (16.4)
25∼29 107 (35.8)
≥30 143 (47.8)
Marital status Unmarried 185 (61.9)
Married 114 (38.1)
Education College 189 (63.2)
Over university 110 (36.8) Current work experience (y) <2 138 (46.2)
2∼4 76 (25.4)
≥5 85 (28.4)
Annual salary (ten thousand Won)
<2,000 26 (8.7)
2,000∼2,999 161 (53.8)
≥3,000 112 (37.5)
Workplace Local dental clinic 278 (93.0) Dental hospital 21 (7.0)
No. of dental hygienists <4 92 (30.8)
4∼10 135 (45.2)
>10 72 (24.1)
Values are presented as n (%). The sum of the percentages does not equal 100% because of rounding.
culture. The Cronbach’s α of this tool was 0.96 in Kim’s study 11) and 0.89 in the present study.
2) Organizational support
A tool developed by OʼDriscoll et al. 12) , and transla- ted/revised by Kim 11) was used to assess organizational support. It consisted of eight questions; four questions each on supervisor support and co-worker support. Each question was rated on a five-point Likert scale, with one point assigned for “I did not get any support” and five points for “I received support all the time.” Higher scores indicated higher perceived levels of organizational support. The Cronbach’s α of this tool was 0.95 in Kim’s study 11) and 0.79 in the present study.
3) Organizational health
SPS-6, which is a shortened version of the Stanford Presenteeism Scale (SPS) developed at the Stanford University School of Medicine, was used to assess organizational health 13) . It contains six questions asking how significantly health problems in the past affected work performance. Each question was rated on a five-point Likert scale, with one point assigned for
“always” and five points for “never” through recoding.
Higher scores indicated less work loss and better organizational health. The Cronbach’s α of this tool was 0.83 in Koopman et al.’s study 13) , and 0.74 in the present study.
4) Personal health
A single question developed by Ware 14) was used to assess self-rated current health. The question, “In general, how would you rate your current health?”, was rated on a five-point Likert scale, with one point assigned for “very unhealthy” and five points for “very healthy”. Higher scores indicated better-perceived health.
5) QWL
A QWL assessment tool for dental hygienists developed by Kwon 15) was used to assess their QWL. It consisted of 20 questions across seven subdomains; two questions on salary, four on welfare, four on educational training and employee development, two on interpersonal relation-
ships, two on leisure activities, two on social benefits, and four on employment stability. Each question was rated on a five-point Likert scale, with one point assigned for “not at all” and five points for “very true”. Higher scores indicated better QWLs. The Cronbach’s α of this tool was 0.75 in Kwon’s study 15) and 0.82 in the present study.
3. Statistical analysis
The general characteristics of the participants were analyzed using descriptive statistics and frequency analysis. A Cronbach’s α was calculated for each asse- ssment tool to test its reliability. Differences in organi- zational culture, organizational support, organizational health, personal health, and QWL according to the general characteristics were analyzed by t-tests and one-way analysis of variance (ANOVA). Pearson’s correlation coefficients were calculated to assess any correlations among them. A path analysis was performed to analyze the causal relationships. A goodness-of-fit index was calculated to verify the path analysis results. Maximum likelihood analysis was used to test statistical significance.
PASW Statistics for Windows ver. 18.0 (IBM Co.,
Armonk, NY, USA) and AMOS 18.0 (Amos Develop-
Table 2. Organizational Culture and Organizational Support according to the General Characteristics
Characteristic Organizational culture Organizational support
Mean±SD F/t p Mean±SD F/t p
Age (y)
<25 3.54±0.62 0.43 0.65 3.63±0.79
a3.65 0.03*
25∼29 3.45±0.74 3.36±0.82
a,b≥30 3.51±0.69 3.28±0.73
bMarital status
Unmarried 3.49±0.69 0.01 0.98 4.41±0.80 1.36 0.18
Married 3.49±0.70 3.29±0.74
Education
College 3.50±0.63 0.41 0.68 3.40±0.75 0.75 0.45
Over university 3.47±0.80 3.32±0.83
Current work experience (y)
<2 3.48±0.72
a3.45 0.03* 3.40±0.86 1.24 0.29
2∼4 3.36±0.74
a,b3.25±0.70
≥5 3.64±0.59
b3.42±0.72
Annual salary (ten thousand Won)
<2,000 3.51±0.74 1.96 0.14 3.53±0.68 0.68 0.51
2,000∼2,999 3.42±0.68 3.33±0.81
≥3,000 3.59±0.69 3.38±0.77
Workplace
Local dental clinic 3.48±0.70 −1.18 0.25 3.37±0.79 0.43 0.67
Dental hospital 3.65±0.64 3.30±0.61
No. of dental hygienists
<4 3.41±0.74
a3.78 0.02* 3.25±0.83
a3.40 0.04*
4∼10 3.45±0.66
a3.33±0.74
a>10 3.68±0.66
b3.56±0.77
aSD: standard deviation.
*p<0.05.
a∼c
The same superscript letter indicates no significant difference (p>0.05 by Scheffe post-hoc test).
ment Co., Crawfordville, FL, USA) were used for all statistical analyses.
Results
1. General characteristics
Table 1 showed the general characteristics of the participants. Ages of 30 years or older were the most common (47.8%), followed by those 25∼29 years of age (35.8%) and less than 25 years of age (16.4%). More participants were unmarried (61.9%) than married. The majority of the participants (63.2%) had completed a three-year program, while 36.8% had completed a four-year program or more.
Years or work experience of fewer than two years was the most common (46.2%), followed by more than five
years (28.4%), and 2∼4 years (25.4%) of experience. An annual salary of 20∼30 million won was the most common (53.8%), followed by over 30 million (37.5%) and less than 20 million (8.7%) won. Most participants (93.0%) worked in dental clinics. Among the numbers of dental hygienists, 4∼10 was the most common (45.2%), followed by four or less (30.8%) and 10 or more (24.1%).
2. Differences in organizational culture and support according to the general characteristics
Table 2 shows the differences in organizational culture
and organizational support according to the general
characteristics. Regarding differences in organizational
culture according to the general characteristics, significant
differences were found in the years of experience in the
current job (p=0.03) and the number of dental hygienists
Table 3. Organizational Health, Personal Health, and Quality of Work Life (QWL) according to General Characteristics
Characteristic Organizational health Personal health QWL
Mean±SD F/t p Mean±SD F/t p Mean±SD F/t p
Age (y)
<25 3.25±0.47 0.81 0.45 3.22±0.90 0.19 0.83 3.06±0.57 1.37 0.26
25∼29 3.33±0.52 3.21±0.83 3.15±0.60
≥30 3.35±0.49 3.28±0.91 3.22±0.60
Marital status
Unmarried 3.30±0.49 −1.34 0.18 3.19±0.86 −1.32 0.19 3.16±0.61 −1.21 0.23
Married 2.39±0.52 3.33±0.89 3.22±0.57
Education
College 3.35±0.51 0.90 0.37 3.21±0.90 −1.06 0.29 3.16±0.58 −0.34 0.74
Over university 3.30±0.48 3.32±0.84 3.18±0.63
Current work experience (y)
<2 3.30±0.49
a4.70 0.01* 3.17±0.83 1.09 0.34 3.15±0.56 2.18 0.12
2∼4 3.24±0.47
a,b3.32±0.82 3.08±0.69
≥5 3.46±0.52
b3.32±0.99 3.27±0.56
Annual salary (ten thousand Won)
<2,000 3.45±0.42
a3.72 0.03* 3.46±0.86 3.28 0.04* 3.32±0.54 3.20 0.05
2,000∼2,999 3.20±0.48
a3.13±0.94 3.09±0.61
≥3,000 3.40±0.54
a3.37±0.77 3.24±0.58
Workplace
Local dental clinic 3.32±0.50 −0.59 0.57 3.23±0.89 −1.13 0.27 3.16±0.60 −0.12 0.22
Dental hospital 3.39±0.51 3.43±0.75 3.32±0.46
No. of dental hygienists
<4 3.40±0.48 1.33 0.27 3.17±0.95 0.79 0.46 3.15±0.61 0.68 0.51
4∼10 3.31±0.49 3.24±0.85 3.14±0.63
>10 3.28±0.53 3.35±0.84 3.24±0.51
SD: standard deviation.
*p<0.05.
a∼c