Address for correspondence;
Kang Min Park
Department of Neurology, Haeundae Paik Hospital, Inje University College of Medicine, Haeundae-ro 875, Haeundae-gu, Busan 48108, Korea Tel: +82-51-797-1195 Fax: +82-51-797-1196
E-mail: [email protected]
Original Article
코골이가 수면무호흡증의 중증도를 예측할 수 있을까?
인제대학교 해운대백병원 신경과1, 내과2
김시은
1․박봉수
2․박시형
2․신경진
1․하삼열
1․박진세
1․박강민
1Has Snoring Significance for
Predicting Obstructive Sleep Apnea Severity?
Si Eun Kim
1, Bong Soo Park
2, Si Hyung Park
2, Kyong Jin Shin
1, Sam Yeol Ha
1, Jin Se Park
1, Kang Min Park
1Department of 1Neurology and 2Internal Medicine, Haeundae Paik Hospital, Inje University College of Medicine, Busan, Korea
Background: The aim of this study was to investigate the predictive value of snoring frequency in the diagnosis and severity of obstructive sleep apnea. Methods: Patients who underwent polysomnography with one or more of the follow- ing characteristics were included: 1) sleepiness, non-restorative sleep, fatigue, or insomnia symptoms; 2) arousal due to cessation of breathing or the occurrence of gasping or choking when waking up; and 3) habitual snoring, breathing interruptions, or both, noted by a bed partner or other observer. We analyzed the differences in clinical and polysomno- graphic variables between patients with and without obstructive sleep apnea and investigated the associations of those variables with obstructive sleep apnea severity. Results: One hundred ninety-three patients met the inclusion criteria, and 145 of the 193 patients were diagnosed with obstructive sleep apnea. Multiple logistic regression analysis showed that large neck circumference (p = 0.0054) and high snoring index (p = 0.0119) were independent predictors for ob- structive sleep apnea. Moreover, between the obstructive sleep apnea severity groups, there was a strong tendency of difference in body mass index (p = 0.0441) and neck circumference (p = 0.0846). However, there was no significant difference in snoring frequency according to obstructive sleep apnea severity (p = 0.4914). Conclusions: We confirmed that snoring frequency is a predictor of obstructive sleep apnea. In addition, we showed for the first time that snoring frequency is not associated with obstructive sleep apnea severity, thus it is not a valuable marker for predicting ob- structive sleep apnea severity. (Korean J Clin Neurophysiol 2015;17:61-67)
Key Words: Snoring, Sleep apnea, Polysomnography
Received 1 September 2015; received in revised form 18 November 2015; accepted 25 November 2015.
Introduction
Obstructive sleep apnea (OSA) is a chronic sleep disorder affecting 3 to 7% of the general population.1 OSA is associated with numerous adverse outcomes, such as cardiovascular dis- ease, stroke, hypertension, diabetes mellitus, depression, im- paired cognitive function, and increased perioperative risk.1,2 Therefore, the early diagnosis and treatment of OSA is important.
Overnight polysomnography (PSG) is the gold standard for the diagnosis of OSA. Additionally, PSG can be helpful for inves- tigating OSA severity according to the apnea-hypopnea index (AHI). Because treatment options for OSA are usually classi- fied by OSA severity, determining OSA severity is very im- portant.3 However, PSG is a time-consuming, labor-intensive, and highly expensive procedure. Moreover, PSG is not widely available. Therefore, many researchers have attempted to clar- ify predictive factors for OSA and OSA severity to prioritize PSG candidates.4
Snoring frequently prompts people to seek medication atten- tion, being it causes much disruption to family members and to the snorer.5 Snoring is a sound produced by vibration of upper airway structures, including the soft palate and adjacent tissues, due to turbulent airflow through a narrow oropharynx in the upper airway.5,6 Many studies have confirmed that OSA is associated with anatomical and functional abnormalities of the upper airway, and patients with OSA have narrower upper airways that more frequently collapse than those without OSA.6 Thus, snoring is one of the most common symptoms of OSA occurring in 70 to 95% of patients with OSA, and the preva- lence of OSA is three or four times higher in snorers than in non-snorers.7 Additionally, it can be the first symptom of OSA.8 Therefore, snoring is a predictor of OSA. However, the pre- dictive ability of snoring frequency for OSA severity has not been thoroughly investigated in studies including purely OSA subjects, and knowledge on this subject may be useful, not only for clinical practice but also for patient counseling. Addi- tionally, the majority, but not all, of patients with OSA snore.
A limited number of studies have investigated the clinical and polysomnographic differences between OSA patients who are snorers and non-snorers.
In the present study, we investigated the predictive value of snoring frequency for the diagnosis and severity of OSA. Addi- tionally, we analyzed the clinical and polysomnographic differ- ences between OSA patients who were snorers and non-snorers.
Materials and Methods
This study was conducted with the approval of the institu- tional review board at our institute. It was a retrospective case control observational study and was performed at a single ter- tiary hospital. Patients who underwent overnight polysomnography
at our hospital with one or more of the following character- istics were eligible for inclusion in the study: 1) sleepiness, non-restorative sleep, fatigue, or insomnia symptoms; 2) arous- al due to cessation of breathing or the occurrence of gasping or choking when waking up; and 3) habitual snoring, breath- ing interruptions, or both, noted by a bed partner or other observer.9 The exclusion criteria were as follows: 1) younger than 16 years of age; 2) history of severe lung disease, con- gestive heart failure, or neuromuscular disease; 3) on medi- cations affecting the structure of sleep, such as hypnotics, anti- depressants, and antihistamines; 4) previous or current OSA treatment, such as continuous positive airway pressure (CPAP) and tonsillectomy; and 5) central sleep apnea. The medical re- cords of these patients were reviewed.
An overnight PSG was performed for all patients in the sleep laboratory at the institution (AURA® PSG system, Model 32760000 BHHN, USA). Electroencephalography, elec- trooculography, electrocardiography, chin and tibial electro- myography, oral-nasal airflow metering using thermocouples and nasal pressure, an oxyhemoglobin saturation test using a finger pulse oximeter, and respiratory inductive plethysmog- raphy to determine chest and abdominal movement were per- formed. The snoring sensor used was a piezoelectric sensor, which detects vibration of the neck. The sensor was specifi- cally designed to pick up the frequency range of snoring. It was placed over the trachea at the level of the cricoid cartilage and automatically detected snoring throughout the night to an- alyze its frequency. The setting for snoring detecting was fol- lowing; the threshold was 100 uV, the frequency range was from 20 to 60 Hz, and the minimum and the maximum event duration was 0.4 and 2.0 seconds, respectively. Digital video recording was performed throughout the night. The PSG re- cordings were analyzed by a certified PSG technologist. Apnea was defined as a pause of airflow of more than 10 seconds, and hypopnea was defined as a ≥ 30% decrease in airflow that persisted for more than 10 seconds accompanied by oxygen desaturation of 3% or greater or by arousal.10 AHI was calcu- lated as the total number of respiratory events (apnea plus hy- popnea) per hour of sleep. Total sleep time was defined as the period from sleep onset to final awakening. Sleep latency was defined as the period of time from turning off the lights to the first epoch of sleep. Minimum pulse oxygen saturation (SpO2) was defined as the lowest nighttime saturation point, and time
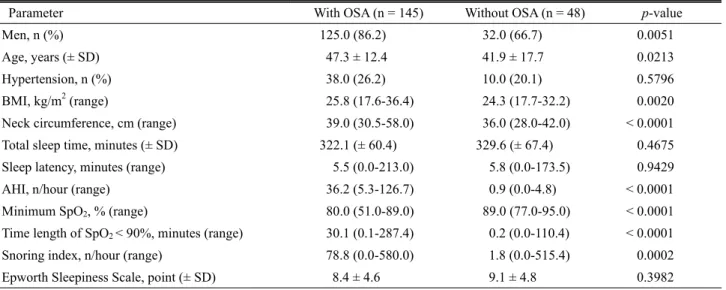
Table 1. Differences in clinical and polysomnographic variables between patients with and without obstructive sleep apnea
Parameter With OSA (n = 145) Without OSA (n = 48) p-value
Men, n (%) 125.0 (86.2) 32.0 (66.7) 0.0051
Age, years (± SD) 47.3 ± 12.4 41.9 ± 17.7 0.0213
Hypertension, n (%) 38.0 (26.2) 10.0 (20.1) 0.5796
BMI, kg/m2 (range) 25.8 (17.6-36.4) 24.3 (17.7-32.2) 0.0020
Neck circumference, cm (range) 39.0 (30.5-58.0) 36.0 (28.0-42.0) < 0.0001
Total sleep time, minutes (± SD) 322.1 (± 60.4) 329.6 (± 67.4) 0.4675
Sleep latency, minutes (range) 5.5 (0.0-213.0) 5.8 (0.0-173.5) 0.9429
AHI, n/hour (range) 36.2 (5.3-126.7) 0.9 (0.0-4.8) < 0.0001
Minimum SpO2, % (range) 80.0 (51.0-89.0) 89.0 (77.0-95.0) < 0.0001
Time length of SpO2 < 90%, minutes (range) 30.1 (0.1-287.4) 0.2 (0.0-110.4) < 0.0001
Snoring index, n/hour (range) 78.8 (0.0-580.0) 1.8 (0.0-515.4) 0.0002
Epworth Sleepiness Scale, point (± SD) 8.4 ± 4.6 9.1 ± 4.8 0.3982
OSA; obstructive sleep apnea, BMI; body mass index, AHI; apnea-hypopnea index.
length of SpO2 < 90% was measured in minutes, with satu- ration levels below 90% at nighttime. Snoring index was cal- culated as the number of snoring episodes per hour of sleep.
The Epworth sleepiness scale (ESS) score was assessed for each patient using the validated Korean version of the ESS questionnaire.11 This Korean version of the screening survey was conducted by a trained technologist in the evening before the PSG study. Height, body weight, and neck circumference were determined on the night of the PSG study. Height was measured with a stadiometer. Body weight was measured with a scale. BMI was calculated as the body weight in kilograms divided by the square of the height in meters (kg/m2). Neck circumference was measured at the level of the cricothyroid membrane with a tape measure.
We analyzed our data in three stages. First, the diagnosis of OSA was defined as an AHI ≥ 5, which was used to divide the patients into two groups: those with and without OSA. We analyzed the differences in clinical variables, such as sex, age, hypertension, BMI, and neck circumference and polysomno- graphic variables, such as total sleep time, sleep latency, AHI, minimum SpO2, and time length of SpO2 < 90%, snoring in- dex, and ESS score between patients with and without OSA.
The Chi-square test was used for the comparison of catego- rical variables, and Student’s t-test or Mann-Whitney U-test were used for the comparison of numerical variables. In addi- tion, to determine which factors were the strongest independent predictors of OSA, we also performed a multiple logistic re-
gression analysis. Second, we grouped the patients based on OSA severity determined by the AHI score into three groups:
those with mild (AHI ≥ 5 to < 15), moderate(AHI ≥ 15 to <
30), and severe (AHI ≥ 30) OSA. We analyzed the differences in clinical and polysomnographic variables, and ESS score among the mild, moderate, and severe OSA patients. The Chi- square test was used for the comparison of categorical varia- bles, and the analysis of variance or Kruskal-Wallis test was applied for the comparison of numerical variables. We also quantified correlations between AHI and BMI, neck circum- ference, and snoring index using Spearman’s rank correlation test. Third, we divided patients with OSA into two groups:
snorers (snoring index ˃ 0) and non-snorers(snoring index = 0).
We analyzed the differences in clinical and polysomnographic variables and ESS score between these two groups. The Chi- square test was used for the comparison of categorical varia- bles, and Student’s t-test or Mann-Whitney U-test was used for the comparison of numerical variables. All statistical tests were performed using MedCalc® for Windows, version 13.1.2 (MedCalc Software, Mariakerke, Belgium). For all calculations, a p-value of less than 0.05 was considered statistically sig- nificant. Categorical variables were presented as frequencies and percentages. Normally distributed numerical variables were pre- sented as the means ± standard deviations (SD), and those that were not normally distributed were presented as medians with 95% confidence intervals and ranges.
Table 2. Multiple logistic regression analysis of predictive factors for obstructive sleep apnea
Independent variable Adjusted
odds ratio 95% confidence
interval p-value
Men 1.801 0.442-7.336 0.4115
Age 1.024 0.996-1.052 0.0908
BMI 0.972 0.817-1.157 0.7520
Neck circumference 1.421 1.110-1.821 0.0054 Snoring index 1.006 1.001-1.010 0.0119 BMI; body mass index.
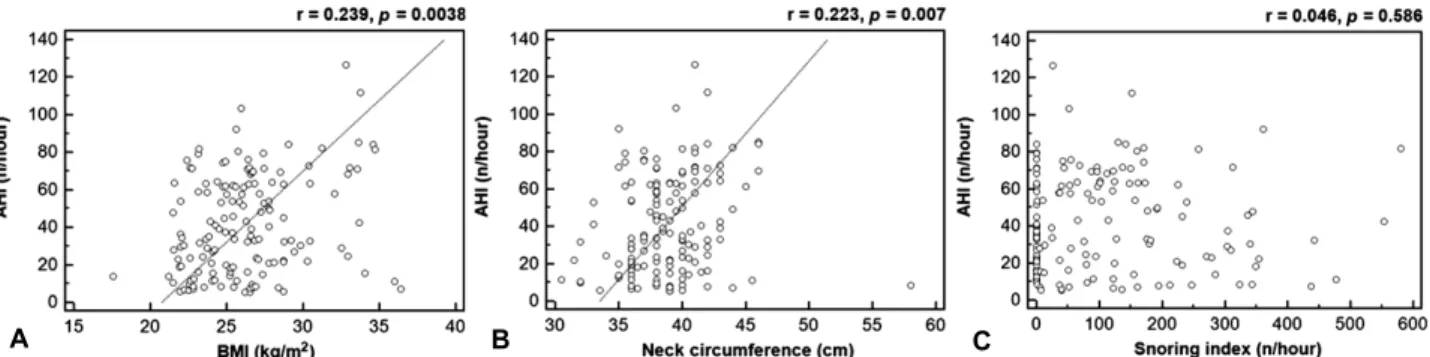
A B C
Figure 1. A positive correlation between AHI and BMI (a), and neck circumference (b) was identified, whereas there was no correla- tion between AHI and snoring index. AHI; apnea-hypopnea index, BMI; body mass index.
Results
One hundred ninety-three patients met the inclusion criteria.
One hundred fifty-seven patients were men, and 36 patients were women. The mean age of the subjects was 45.9 ± 14.0 years. Forty-eight patients (24.9%) had hypertension. The mean height of the patients was 169.2 ± 9.7 cm, and the mean body weight of the patients was 74.6 ± 12.5 kg. The median BMI of the patients was 25.4 kg/m2 (95% CI 24.9-25.9 kg/m2, range 17.6-36.4 kg/m2). The median neck circumference of the patients was 38.0 cm (95% CI 38.0-39.0 cm, range 28.0-58.0 cm). The PSG results showed a mean total sleep time of 323.9
± 62.1 minutes, a median sleep latency of 5.5 minutes (95%
CI 4.5-6.8 minutes, range 0-213.0 minutes), a median AHI of 23.6 (95% CI 18.5-32.3, range 0-126.7) a median minimum SpO2 of 82.5% (95% CI 81.0-84.0%, range 51.0-95.0%), a median time period of SpO2 < 90% of 7.6 minutes (95% CI 3.9-12.0 minutes, range 0-287.4 minutes), and a median snor- ing index of 40.1 (95% CI 23.2-64.7, range 0-580.0). The mean ESS score was 8.6 ± 4.6.
One hundred forty-five of the 193 patients were diagnosed with OSA. Table 1 shows the comparison of the clinical and
polysomnographic variables and ESS scores between patients with and without OSA. Patients with OSA were more fre- quently male and of an older age, had a higher BMI, larger neck circumference, greater AHI, longer time period of SpO2
< 90%, lower minimum SpO2, and higher snoring index com- pared with those without OSA. Multiple logistic regression analysis showed that large neck circumference and high snor- ing index were independent predictors for OSA (Table 2). Of the 145 patients with OSA, 29 patients had mild OSA, 29 had moderate OSA, and 87 had severe OSA. There was no differ- ence in the sex, age, hypertension, snoring index, or ESS scores between the patients with mild, moderate, and severe OSA.
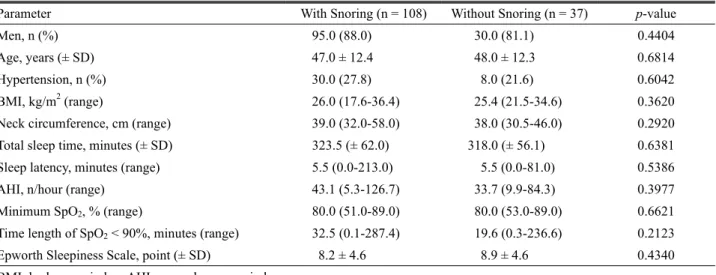
However, between the OSA severity groups, there was a sig- nificant difference in BMI and a strong difference in neck cir- cumference (Table 3). In addition, positive correlations between AHI and BMI and neck circumference were identified (BMI, r = 0.239, p = 0.0038; neck circumference, r = 0.223, p = 0.0070), but there was no correlation between AHI and snor- ing index (r = 0.046, p = 0.5866) (Fig. 1). Additionally, of the 145 patients with OSA, 108 patients were snorers and 37 pa- tients were non-snorers. There were no differences in the clin- ical or polysomnographic variables or the ESS score between these two groups (Table 4).
Discussion
The main finding of this study was that snoring frequency is a predictor of OSA but not of OSA severity. Additionally, in contrast to snoring frequency, BMI and neck circumference were significant predictors of OSA severity and were also well- correlated with AHI. Moreover, there were no differences in the clinical or polysomnographic variables or the ESS score
Table 4. Differences in clinical and polysomnographic variables between patients with obstructive sleep apnea who are snorers and non-snorers
Parameter With Snoring (n = 108) Without Snoring (n = 37) p-value
Men, n (%) 95.0 (88.0) 30.0 (81.1) 0.4404
Age, years (± SD) 47.0 ± 12.4 48.0 ± 12.3 0.6814
Hypertension, n (%) 30.0 (27.8) 8.0 (21.6) 0.6042
BMI, kg/m2 (range) 26.0 (17.6-36.4) 25.4 (21.5-34.6) 0.3620
Neck circumference, cm (range) 39.0 (32.0-58.0) 38.0 (30.5-46.0) 0.2920
Total sleep time, minutes (± SD) 323.5 (± 62.0) 318.0 (± 56.1) 0.6381
Sleep latency, minutes (range) 5.5 (0.0-213.0) 5.5 (0.0-81.0) 0.5386
AHI, n/hour (range) 43.1 (5.3-126.7) 33.7 (9.9-84.3) 0.3977
Minimum SpO2, % (range) 80.0 (51.0-89.0) 80.0 (53.0-89.0) 0.6621
Time length of SpO2 < 90%, minutes (range) 32.5 (0.1-287.4) 19.6 (0.3-236.6) 0.2123
Epworth Sleepiness Scale, point (± SD) 8.2 ± 4.6 8.9 ± 4.6 0.4340
BMI; body mass index, AHI; apnea-hypopnea index.
Table 3. Differences in clinical and polysomnographic variables between patients with mild, moderate, and severe obstructive sleep apnea
Parameter Mild OSA
(n = 29) Modera OSA
(n = 29) Severe OSA
(n = 87) p-value
Men, n (%) 23.0 (79.3) 26.0 (89.7) 76 (87.4) 0.4615
Age, years (± SD) 47.9 ± 14.2 46.8 ± 13.2 47.3 ± 11.6 0.9470
Hypertension, n (%) 6.0 (20.7) 5.0 (17.2) 27.0 (31.0) 0.2579
BMI, kg/m2 (range) 24.6 (17.6-36.4) 25.3 (21.5-34.1) 26.7 (21.5-34.7) 0.0441
Neck circumference, cm (range) 38.0 (30.5-58.0) 38.0 (31.5-42.0) 39.0 (32.0-46.0) 0.0846 Total sleep time, minutes (± SD) 328.0 (± 69.2) 313.2 (± 51.2) 323.1 (± 60.5) 0.6310 Sleep latency, minutes (range) 7.0 (0.0-155.5) 6.0 (0.0-56.5) 5.5 (0.0-213.0) 0.4483 AHI, n/hour (range) 8.5 (5.3-14.8) 22.0 (15.4-29.5) 58.8 (30.2-126.7) < 0.0001 Minimum SpO2, % (range) 80.0 (51.0-89.0) 89.0 (77.0-95.0) 89.0 (77.0-95.0) < 0.0001 Time length of SpO2 < 90%, minutes (range) 5.6 (0.1-159.7) 11.9 (0.8-118.2) 53.0 (0.6-287.4) < 0.0001 Snoring index, n/hour (range) 80.6 (0.0-477.1) 36.3 (0.0-354.0) 88.0 (0.0-580.0) 0.4914
Epworth Sleepiness Scale, point (± SD) 6.9 ± 4.8 8.0 ± 3.9 9.0 ± 4.7 0.1260
OSA; obstructive sleep apnea, BMI; body mass index, AHI; apnea-hypopnea index.
between OSA patients who were snorers and non-snorers.
Previous studies demonstrated significant differences in snor- ing characteristics of patients with and without OSA.12,13 How- ever, most of these studies did not investigate the correlation of snoring characteristics with OSA severity of the correlation of snoring frequency with AHI. Only a limited number of studies have investigated the correlation of snoring character- istics with OSA severity,14-16 and most of those studies were conducted with small a sample size and did not examine snor- ing frequency. Additionally, the subjects of those studies were not Caucasians rather than Asians. Asians exhibit many differ-
ences from Caucasians in their presentation of OSA. Asians have a different cephalometric morphology from Caucasians:
they have shorter and steeper anterior cranial bases with small- er and more posteriorly positioned mandibles compared with Caucasians. These differences might render Asians more prone to OSA.17,18 Additionally, when matched for BMI, Asians are known to have a greater severity of OSA compared with Caucasians.17,18 In addition, Asians are generally less obese than Caucasians, and the pathogenesis of OSA could vary with the degree of obesity. In obese patients, upper airway soft tissue enlargement may be the predominant risk factor for OSA, while
in non-obese patients, cephalometric abnormalities of bony struc- tures may be the predominant risk factor for OSA.19 Therefore, the results of OSA studies in Asian patients may be different from those in Caucasians. In the present study, the subjects were all Asians.
The reason that snoring frequency did not indicate OSA se- verity despite being a predictor of OSA is not clear. Although parameters, such as respiratory airflow, upper airway cross- sectional diameter, and upper airway collapsibility and resist- ance, contribute to the generation of snoring sounds, the most important factor in snoring is airflow.20 Mild reduction in air- flow is usually associated with snoring, and a more marked re- duction in airflow is associated with partially obstructed air- ways, which results in hypopneas and heavy snoring.21,22 How- ever, complete obstruction, the state of apnea, may not cause snoring due to a lack of turbulent airflow, due to a complete absence of airflow, in the airway. Thus, we can infer that snor- ing frequency is correlated with hypopnea but not with apnea.
This is supported by our correlation analysis, which we quan- tified correlations between apnea/hypopnea index and snoring index using Spearman’s rank correlation test in our patients with OSA. The apnea/hypopnea index was calculated as the number of apnea/hypopnea events per hour of sleep, respec- tively. It revealed that there was a significant positive correla- tion between hypopnea index and snoring index (r = 0.231, p
= 0.0052), whereas there was no correlation between apnea in- dex and snoring index (r = -0.112, p = 0.1798). Therefore, snoring frequency does not carry information on OSA se- verity, which is determined by the frequency of hypopnea and apnea. This was supported by the lack of a difference in OSA severity between OSA patients who were snorers and non-snorers in this study.
Furthermore, our study found that BMI and neck circum- ference were significant predictors of OSA severity, and they were also well-correlated with AHI. This result was consistent with previous reports.23,24 The roles of high BMI, which in- dicates the severity of obesity, and large neck circumference in the development of OSA has been relatively well established.
A large neck circumference reflects excessive fat deposition around the neck induced by obesity, and it can cause narrow- ing of the upper airway and alteration of the dynamic com- pliance of the soft tissue structure around the airway resulting to OSA.25 Thus, BMI and neck circumference were more reli-
able factors than snoring frequency in predicting AHI, which indicates OSA severity.
There are several limitations to this study. First, this was a retrospective study conducted at a single hospital.
Second, our study was based on a single PSG for each pa- tient, and we did not use self-report questionnaires. The results of a single PSG study may not be representative of a patients’
sleep. Third, it is a well-known that individuals who sleep in the supine position are more likely to snore than those who sleep in the lateral position. However, we did not analyze the snoring frequency according to the body position. Fourth, we only investigated snoring frequency and did not analyze other snoring characteristics, such as snoring intensity and spectral, and pitch-related features. Other features of snoring may pro- vide useful information about OSA severity. Previous reports demonstrated that the peak intensity of snoring in patients with OSA had a high frequency, while simple snoring had a low frequency, and the peak intensity of snoring was corre- lated with AHI.16,26 However, the characteristics of snoring sounds during hypopnea are highly variable due to a great var- iation in airflow and probable changes in the site of obstruction from one breath cycle to the next.22 Thus, we thought that the investigation of the number of snoring episodes per hour, snor- ing frequency, by automatic snoring detection throughout the entire night could provide more objective information than an- alyzing the characteristics of the snoring sound. Further pro- spective studies with large sample sizes may be needed to con- firm our results.
In conclusion, we confirmed that snoring frequency is a predictor of OSA. In addition, we showed for the first time that snoring frequency is not correlated with OSA severity, thus it is not a valuable marker for predicting obstructive sleep apnea severity.
REFERENCES
1. Vaessen TJ, Overeem S, Sitskoorn MM. Cognitive complaints in obstructive sleep apnea. Sleep Med Rev 2015;19:51-58.
2. Farney RJ, Walker BS, Farney RM, Snow GL, Walker JM. The STOP-Bang equivalent model and prediction of severity of ob- structive sleep apnea: relation to polysomnographic measure- ments of the apnea/hypopnea index. J Clin Sleep Med 2011;7:459- 465.
3. Epstein LJ, Kristo D, Strollo PJ, Friedman N, Malhotra A, Patil SP, et al. Clinical guideline for the evaluation, management and
long-term care of obstructive sleep apnea in adults. J Clin Sleep Med 2009;5:263-276.
4. Chung F, Yegneswaran B, Liao P, Chung SA, Vairavanathan S, Islam S, et al. STOP questionnaire: a tool to screen patients for ob- structive sleep apnea. Anesthesiology 2008;108:812-821.
5. Beck R, Odeh M, Oliven A, Gavriely N. The acoustic properties of snores. Eur Respir J 1995;8:2120-2128.
6. Ng AK, Koh TS, Baey E, Lee TH, Abeyratne UR, Puvanendran K.
Could formant frequencies of snore signals be an alternative means for the diagnosis of obstructive sleep apnea? Sleep Med 2008;9:894-898.
7. Wilson K, Stoohs RA, Mulrooney TF, Johnson LJ, Guilleminault C, Huang Z. The snoring spectrum: acoustic assessment of snoring sound intensity in 1,139 individuals undergoing polysomnography.
Chest 1999;115:762-770.
8. Ben-Israel N, Tarasiuk A, Zigel Y. Obstructive apnea hypopnea in- dex estimation by analysis of nocturnal snoring signals in adults.
Sleep 2012;35:1299-1305.
9. Sateia MJ. International classification of sleep disorders-third edi- tion: highlights and modifications. Chest 2014;146:1387-1394.
10. Berry RB, Budhiraja R, Gottlieb DJ, Gozal D, Iber C, Kapur VK, et al. Rules for scoring respiratory events in sleep: update of the 2007 AASM Manual for the Scoring of Sleep and Associated Events.
Deliberations of the Sleep Apnea Definitions Task Force of the American Academy of Sleep Medicine. J Clin Sleep Med 2012;8:
597-619.
11. Cho YW, Lee JH, Son HK, Lee SH, Shin C, Johns MW. The reli- ability and validity of the Korean version of the Epworth sleepi- ness scale. Sleep Breath 2011;15:377-384.
12. Cavusoglu M, Ciloglu T, Serinagaoglu Y, Kamasak M, Erogul O, Akcam T. Investigation of sequential properties of snoring epi- sodes for obstructive sleep apnoea identification. Physiol Meas 2008;29:879-898.
13. Perez-Padilla JR, Slawinski E, Difrancesco LM, Feige RR, Remmers JE, Whitelaw WA. Characteristics of the snoring noise in patients with and without occlusive sleep apnea. Am Rev Respir Dis 1993;
147:635-644.
14. Fiz JA, Jane R, Sola-Soler J, Abad J, Garcia MA, Morera J.
Continuous analysis and monitoring of snores and their relation-
ship to the apnea-hypopnea index. Laryngoscope 2010;120:854- 862.
15. Sola-Soler J, Fiz JA, Morera J, Jane R. Multiclass classification of subjects with sleep apnoea-hypopnoea syndrome through snoring analysis. Med Eng Phys 2012;34:1213-1220.
16. Maimon N, Hanly PJ. Does snoring intensity correlate with the se- verity of obstructive sleep apnea? J Clin Sleep Med 2010;6:475- 478.
17. Li KK, Kushida C, Powell NB, Riley RW, Guilleminault C.
Obstructive sleep apnea syndrome: a comparison between Far-East Asian and white men. Laryngoscope 2000;110:1689-1693.
18. Wang J, Thornton JC, Russell M, Burastero S, Heymsfield S, Pierson RN, Jr. Asians have lower body mass index (BMI) but higher percent body fat than do whites: comparisons of anthro- pometric measurements. Am J Clin Nutr 1994;60:23-28.
19. Sakakibara H, Tong M, Matsushita K, Hirata M, Konishi Y, Suetsugu S. Cephalometric abnormalities in non-obese and obese patients with obstructive sleep apnoea. Eur Respir J 1999;13:403- 410.
20. Gavriely N, Jensen O. Theory and measurements of snores. J Appl Physiol 1993;74:2828-2837.
21. Guilleminault C, Stoohs R, Duncan S. Snoring (I). Daytime sleepi- ness in regular heavy snorers. Chest 1991;99:40-48.
22. Azarbarzin A, Moussavi Z. Snoring sounds variability as a sig- nature of obstructive sleep apnea. Med Eng Phys 2013;35:479- 485.
23. Sharma SK, Kurian S, Malik V, Mohan A, Banga A, Pandey RM, et al. A stepped approach for prediction of obstructive sleep apnea in overtly asymptomatic obese subjects: a hospital based study.
Sleep Med 2004;5:351-357.
24. Karakoc O, Akcam T, Gerek M, Genc H, Ozgen F. The upper air- way evaluation of habitual snorers and obstructive sleep apnea patients. ORL J Otorhinolaryngol Relat Spec 2012;74:136-140.
25. Villaneuva AT, Buchanan PR, Yee BJ, Grunstein RR. Ethnicity and obstructive sleep apnoea. Sleep Med Rev 2005;9:419-436.
26. Herzog M, Schmidt A, Bremert T, Herzog B, Hosemann W, Kaftan H. Analysed snoring sounds correlate to obstructive sleep dis- ordered breathing. Eur Arch Otorhinolaryngol 2008;265:105-113.