D I A B E T E S & M E T A B O L I S M J O U R N A L
This is an Open Access article distributed under the terms of the Creative Commons Attribution Non-Commercial License (http://creativecommons.org/licenses/by-nc/4.0/) which permits unrestricted non-commercial use, distribution, and reproduction in any medium, provided the original work is properly cited.
Predictors of the Therapeutic Efficacy and
Consideration of the Best Combination Therapy of Sodium-Glucose Co-transporter 2 Inhibitors
Ji-Yeon Lee1, Yongin Cho1, Minyoung Lee1, You Jin Kim1,2, Yong-ho Lee1,3, Byung-Wan Lee1,3, Bong-Soo Cha1,3, Eun Seok Kang1,3
1Department of Internal Medicine, 2Brain Korea 21 Plus Project for Medical Science, 3Institute of Endocrine Research, Yonsei University College of Medicine, Seoul, Korea
Background: We investigated the predictive markers for the therapeutic efficacy and the best combination of sodium-glucose co- transporter 2 (SGLT2) inhibitors (empagliflozin, dapagliflozin, and ipragliflozin) therapy in patients with type 2 diabetes mellitus (T2DM).
Methods: A total of 804 patients with T2DM who had taken SGLT2 inhibitor as monotherapy or an add-on therapy were ana- lyzed. Multivariate regression analyses were performed to identify the predictors of SGLT2 inhibitor response including the class- es of baseline anti-diabetic medications.
Results: After adjusting for age, sex, baseline body mass index (BMI), diabetes duration, duration of SGLT2 inhibitor use, initial glycosylated hemoglobin (HbA1c) level, estimated glomerular filtration rate (eGFR), and other anti-diabetic agent usage, multi- variate analysis revealed that shorter diabetes duration, higher initial HbA1c and eGFR were associated with better glycemic re- sponse. However, baseline BMI was inversely correlated with glycemic status; lean subjects with well-controlled diabetes and obese subjects with inadequately controlled diabetes received more benefit from SGLT2 inhibitor treatment. In addition, dipepti- dyl peptidase 4 (DPP4) inhibitor use was related to a greater reduction in HbA1c in patients with higher baseline HbA1c ≥7%.
Sulfonylurea users experienced a larger change from baseline HbA1c but the significance was lost after adjustment for covariates and metformin and thiazolidinedione use did not affect the glycemic outcome.
Conclusion: A better response to SGLT2 inhibitors is expected in Korean T2DM patients who have higher baseline HbA1c and eGFR with a shorter diabetes duration. Moreover, the add-on of an SGLT2 inhibitor to a DPP4 inhibitor is likely to show the greatest glycemic response.
Keywords: Blood glucose; Diabetes mellitus, type 2; Glycated hemoglobin A; Sodium-glucose transporter 2 inhibitors
Corresponding author: Eun Seok Kang https://orcid.org/0000-0002-0364-4675 Department of Internal Medicine, Yonsei University College of Medicine, 50-1 Yonsei-ro, Seodaemun-gu, Seoul 03722, Korea
E-mail: [email protected]
INTRODUCTION
The prevalence of type 2 diabetes mellitus (T2DM) has in- creased along with increased obesity and sedentary lifestyles changes [1]. Most T2DM patients have metabolic disturbances with insulin resistance, such as hypertension, hyperlipidemia, and obesity, which increase the cardiovascular risk by two-fold compared to the risk in non-diabetic subjects [2]. Large ran-
domized trials have demonstrated that optimal glycemic con- trol is associated with the prevention of microvascular compli- cations and long-term reduction of the risk of cardiovascular diseases [3-5]; however, only about 50% of patients achieve the glycosylated hemoglobin (HbA1c) levels <7.0% [6].
The development of new classes of anti-diabetes drugs has allowed a wider range of therapeutic options for glycemic con- trol [7]. Among them, sodium-glucose co-transporter 2 https://doi.org/10.4093/dmj.2018.0057
pISSN 2233-6079 · eISSN 2233-6087
(SGLT2) inhibitors are a new class of drugs that were first ap- proved by the U.S. Food and Drug Administration in March 2013 [8]. Their mechanism involves the inhibition of glucose reabsorption in the renal proximal tubule, leading to increased urinary glucose excretion [9]. This exerts diuretic and natri- uretic effects, which also contribute to the reduction of body weight and blood pressure [10,11]. In addition, the Empa- gliflozin Cardiovascular Outcome Event Trial in Type 2 Diabe- tes Mellitus Patients (EMPA-REG OUTCOME) and Cana- gliflozin Cardiovascular Assessment Study (CANVAS) studies have shown that T2DM patients treated with either empa- gliflozin or canagliflozin had significantly lower rates of the primary outcome, a composite of death from cardiovascular causes, nonfatal myocardial infarction, and nonfatal stroke [12,13]. These extraglycemic beneficial effects, as well as the glycemic effects, make SGLT2 inhibitors a promising anti-dia- betic agent.
Previously, we demonstrated that dapagliflozin treatment was more effective in patients with higher baseline HbA1c and estimated glomerular filtration rate (eGFR) [14]. The present study extended the scope of these findings to investigate the ef- fectiveness of three widely used SGLT2 inhibitors (empa- gliflozin, dapagliflozin, and ipragliflozin) as monotherapy or add-on therapy and to analyze which baseline parameters or preexisting anti-diabetic drugs were associated with better re- sponse to SGLT2 inhibitor treatment in Korean T2DM pa- tients.
METHODS
Study populations
We screened patients with T2DM who were treated at the out- patient diabetes clinic of Severance Hospital, Yonsei University College of Medicine, Republic of Korea, between April 2014 and August 2017. Patients aged 18 to 75 years who had taken an SGLT2 inhibitor (empagliflozin, 10 mg once daily; dapa- gliflozin, 10 mg once daily; or ipragliflozin, 50 mg once daily) as monotherapy or an add-on therapy for at least 90 consecu- tive days were included. We excluded patients with type 1 dia- betes mellitus, gestational diabetes, insulin use, or significant renal impairment (eGFR <45 mL/min/1.73 m2). Patients who changed the class of SGLT2 inhibitors and those with missing data regarding body weight, HbA1c level, or eGFR were also excluded. Finally, a total of 804 subjects (128 empagliflozin us- ers, 500 dapagliflozin users, and 176 ipragliflozin users) were
enrolled and followed for a median of 192 days (interquartile range [IQR], 168 to 323 days). This study was approved by the Institutional Review Board of the Yonsei University Health System, Severance Hospital (No. 4-2018-0175). Informed con- sent was waived due to the retrospective nature of the study.
Study design
Demographic information including age, gender, time since diabetes diagnosis, other anti-diabetic drug use, and comor- bidities (hypertension, hyperlipidemia, coronary artery occlu- sive disease, peripheral artery occlusive disease, stroke, and transient ischemic attack) was collected through an examina- tion of electronic medical records. The subjects regularly visit- ed the outpatient clinic every 3 to 6 months according to the degree of glycemic control. At each visit, the body weight and body mass index (BMI) were calculated as the body weight di- vided by the height squared (kg/m2). Blood samples were col- lected after an overnight fasting. Fasting plasma glucose (FPG) levels were assessed by enzymatic colorimetric assay using a Cobas c 702 (Roche, Basel, Switzerland) and Hitachi 7600- 200-DDP (Hitachi, Tokyo, Japan). HbA1c levels were deter- mined by high-performance liquid chromatography on a Co- bas Integra 800 device (Roche). Lipid panels (total cholesterol, triglyceride, and high density lipoprotein cholesterol [HDL- C]), serum aspartate aminotransferase, alanine aminotransfer- ase, blood urea nitrogen, and creatinine levels were measured using a Hitachi 7600 chemistry analyzer (Hitachi). We calcu- lated low density lipoprotein cholesterol (LDL-C) levels using the following formula: LDL-C=(total cholesterol–HDL-C)–
(triglyceride/5). The eGFR was determined using the 4-vari- able modification of diet in renal disease formula [15].
We assessed the efficacy of SGLT2 inhibitor according to baseline anti-diabetic drug use: baseline metformin, sulfonyl- urea (SU), dipeptidyl peptidase 4 (DPP4) inhibitor, or thiazoli- dinedione (TZD) users and non-users. Glycemic response was evaluated using the change from baseline HbA1c (ΔHbA1c) and the percentage of subjects with baseline HbA1c ≥7% who achieved HbA1c <7% after follow-up. Body weight changes (Δweight loss) were adjusted by the baseline body weight as follows: [(baseline weight–follow-up weight)/baseline weight]
×100.
Statistical analysis
Normally distributed data are expressed as mean±standard deviations and non-normally distributed data are expressed as
median (IQR). Independent t-test or Mann-Whitney U test for continuous variables and chi-square test for categorical vari- ables were used to assess the differences in baseline character- istics. Changes in clinic-laboratory values between baseline and follow-up were analyzed by paired t-test or Wilcoxon signed-rank test. To compare the response according to the
baseline anti-diabetic agent use, Mann-Whitney U test were used. Subgroups based on initial HbA1c and BMI categories were compared by Kruskal-Wallis test. We used linear regres- sion analyses to determine the factors responsible for the changes in HbA1c. Multivariate model was adjusted for age, sex, initial BMI, diabetes duration, duration of SGLT2 inhibi-
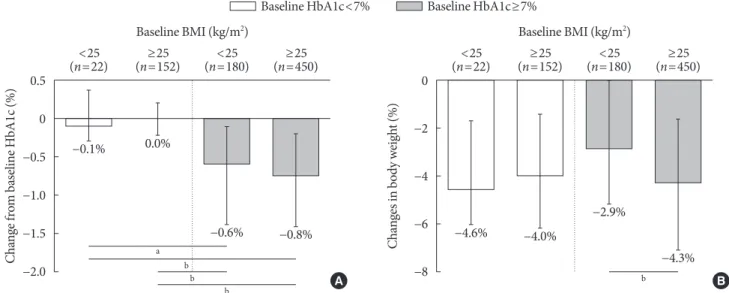
Table 1. Baseline characteristics of patients
Variable Total
(n=804) DPP4 inhibitor non-user
(n=587) DPP4 inhibitor user
(n=217) P value
Age, yr 57 (49–64) 57 (49–64) 57 (49–64) 0.524
Male sex 437 (54.4) 325 (55.4) 112 (51.6) 0.343
DM duration, yr 7.2 (3.5–11.2) 6.6 (3.1–11.2) 8.2 (4.7–11.2) 0.004
Duration of SGLT2 inhibitor use, day 201 (175–344) 197 (175–342) 217 (175–364) 0.058
Body mass index, kg/m2 27.3 (25.0–30.3) 27.4 (25.1–30.6) 26.7 (24.5–29.7) 0.065
HbA1c, % 7.7 (7.0–8.6) 7.7 (7.0–8.6) 7.8 (7.3–8.5) 0.058
FPG, mg/dL 152 (130–181) 149 (127–178) 156 (136–187) 0.020
PP2, mg/dL 232 (191–284) 230 (189–279) 247 (200–306) 0.028
Total cholesterol, mg/dL 166.5±36.2 168.8±36.2 160.4±35.4 0.003
Triglyceride, mg/dL 147 (105–207) 148 (105–214) 141 (107–203) 0.346
HDL-C, mg/dL 44 (38–51) 44 (38–51) 43 (37–49) 0.027
LDL-C, mg/dL 87.8±31.1 89.1±30.9 84.5±31.3 0.063
BUN, mg/dL 14.6 (11.8–17.4) 14.5 (11.8–17.2) 14.7 (11.9–17.5) 0.594
Creatinine, mg/dL 0.8 (0.6–0.9) 0.8 (0.6–0.9) 0.8 (0.6–0.9) 0.334
eGFR, mL/min/1.73 m2 102 (88–117) 103 (88–118) 102 (88–115) 0.812
AST, IU/L 23 (18–35) 24 (18–37) 22 (17–32) 0.121
ALT, IU/L 23 (18–35) 29 (20–49) 30 (19–47) 0.570
Hemoglobin, g/dL 14.3±1.6 14.3±1.6 14.4±1.5 0.588
Hematocrit, % 42.6±4.2 42.6±4.3 42.7±4.0 0.801
Comorbidities
Hypertension 522 (64.9) 384 (65.4) 138 (63.6) 0.631
Hyperlipidemia 539 (67.0) 378 (64.4) 161 (74.2) 0.009
CAOD/PAOD 187 (23.3) 132 (22.5) 55 (25.3) 0.394
Stroke/TIA 34 (4.2) 23 (3.9) 11 (5.1) 0.472
Other anti-diabetic drugs
Metformin 767 (95.4) 557 (94.9) 210 (96.8) 0.257
Sulfonylurea 363 (45.1) 259 (44.1) 104 (47.9) 0.336
DPP4 inhibitor 217 (26.9) - - -
Thiazolidinedione 52 (6.5) 41 (7.0) 11 (5.1) 0.327
Values are presented as median (interquartile range), number (%), or mean±standard deviation.
DPP4, dipeptidyl peptidase 4; DM, diabetes mellitus; SGLT2, sodium-glucose co-transporter 2; HbA1c, glycosylated hemoglobin; FPG, fasting plasma glucose; PP2, post-prandial 2-hour glucose; HDL-C, high density lipoprotein cholesterol; LDL-C, low density lipoprotein cholesterol;
BUN, blood urea nitrogen; eGFR, estimated glomerular filtration rate; AST, aspartate aminotransferase; ALT, alanine aminotransferase; CAOD/
PAOD, coronary artery/peripheral artery occlusive disease; TIA, transient ischemic attack.
tor use, baseline HbA1c and eGFR levels, and anti-diabetic agent use (metformin, SU, DPP4 inhibitor, and TZD). IBM SPSS Statistics for Windows, version 20.0 (IBM Corp., Ar- monk, NY, USA) was used for the statistical analyses and P<0.05 was considered significant.
RESULTS
Baseline characteristics of the study population
The baseline characteristics of the study participants are de- scribed in Table 1. The median age was 57 years (IQR, 49 to 64 years), 54.4% were male, and the median diabetes duration was 7.2 years. The baseline median BMI was 27.3 kg/m2 and the initial HbA1c and FPG were 7.7% and 152 mg/dL, respectively.
Of the 804 subjects, 767 (95.4%) were baseline metformin us- ers, 364 (45.1%) were SU users, 217 (26.9%) were DPP4 inhibi- tor users, and 52 (6.5%) were TZD users.
When classified by concurrently prescribed anti-diabetic drugs, the DPP4 inhibitor users showed a similar age and sex compared to non-users, but the diabetes duration was longer (Table 1). Fasting and postprandial plasma glucose levels were
higher but there was no difference in initial median HbA1c levels (7.7% vs. 7.8%). When classified by metformin use, most of the subjects were on metformin therapy at baseline and the characteristics were balanced except for diabetes duration (Supplementary Table 1). The SU users were older, had a lon- ger diabetes duration, and had the least controlled diabetes compared to non-users (Supplementary Table 2). A few pa- tients were on TZD treatment and there was no difference in baseline glycemic status between users and non-users (Supple- mentary Table 3).
Effect of SGLT2 inhibitors on anthropometric and biochemical parameters
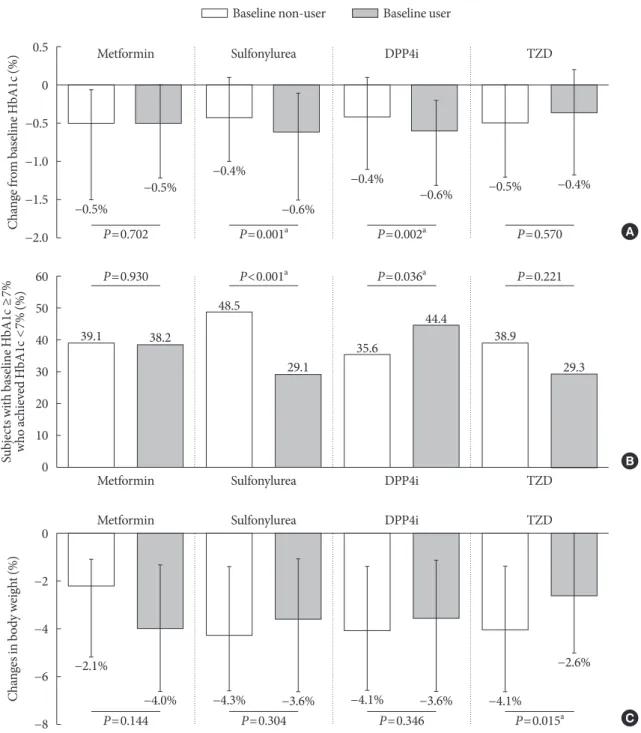
After administration of SGLT2 inhibitors (empagliflozin, dapagliflozin, or ipragliflozin) for a median of 192 days, the median HbA1c level had decreased by 0.7%, from 7.7% (IQR, 7.0% to 8.6%) to 7.0% (IQR, 6.5 to 7.8%; P<0.001) and fasting and postprandial glucose levels were significantly reduced (Ta- ble 2). The weight loss was about 3 kg, from 75 kg (IQR, 67 to 85 kg) to 72 kg (IQR, 63 to 82 kg; P<0.001). Serum triglycer- ide, HDL-C, and liver function test also improved and modest
Table 2. Changes in anthropometric and biochemical parameters in patients
Variable Baseline Follow-up P value
Body weight, kg 75 (67–85) 72 (63–82) <0.001
Body mass index, kg/m2 27.9 (25.5–31.0) 26.3 (24.5–29.4) <0.001
HbA1c, % 7.7 (7.0–8.6) 7.0 (6.5–7.8) <0.001
FPG, mg/dL 152 (130–181) 131 (116–150) <0.001
PP2, mg/dL 216 (175–269) 196 (159–245) <0.001
Total cholesterol, mg/dL 166.6±36.3 167.4±34.4 0.439
Triglyceride, mg/dL 147 (105–207) 138 (102–199) 0.017
HDL-C, mg/dL 44 (38–50) 46 (39–54) <0.001
LDL-C, mg/dL 88.4±30.5 88.2±30.1 0.832
BUN, mg/dL 14.6 (11.8–17.4) 16.3 (13.5–19.5) <0.001
Creatinine, mg/dL 0.8 (0.6–0.9) 0.8 (0.6–0.9) 0.561
eGFR, mL/min/1.73 m2 102 (88–117) 103 (87–120) 0.451
AST, IU/L 23 (18–35) 20 (16–26) <0.001
ALT, IU/L 23 (18–35) 22 (16–32) <0.001
Hemoglobin, g/dL 14.2±1.6 15.0±1.6 <0.001
Hematocrit, % 42.3±4.3 45.1±4.2 <0.001
Values are presented as median (interquartile range) or mean±standard deviation.
HbA1c, glycosylated hemoglobin; FPG, fasting plasma glucose; PP2, post-prandial 2-hour glucose; HDL-C, high density lipoprotein cholester- ol; LDL-C, low density lipoprotein cholesterol; BUN, blood urea nitrogen; eGFR, estimated glomerular filtration rate; AST, aspartate amino- transferase; ALT, alanine aminotransferase.
increases in serum hemoglobin and hematocrit levels were also observed. There were no significant changes in total cholester- ol, LDL-C, and serum creatinine levels or eGFR. In addition, when patients were classified according to the kind of SGLT2 inhibitors, there were no significant differences in the changes in HbA1c and body weight (P=0.629 and P=0.125, respective- ly) (Supplementary Table 4).
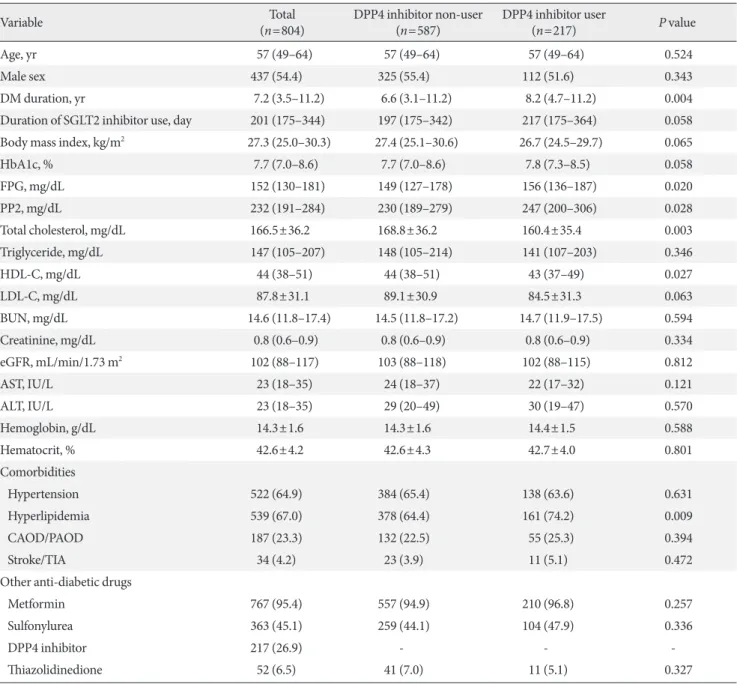
Efficacy of SGLT2 inhibitor according to baseline characteristics
The effects of SGLT2 inhibitors on the HbA1c level and body weight were compared according to baseline HbA1c (cut-off, 7%) and BMI (cut-off, 25 kg/m2). In well-controlled diabetes (left panel, Fig. 1A), the change from baseline HbA1c was minimal. In patients with inadequately controlled diabetes (right panel, Fig. 1A), the degree of HbA1c reduction was sig- nificantly larger and obese patients tended to have a better re- sponse (ΔHbA1c, –0.6% vs. –0.8%). In Fig. 1B, the adjusted weight loss did not differ in well-controlled diabetes (left panel, –4.6% vs. –4.0%), whereas significant weight reduction was observed in obese subjects with inadequately controlled diabe- tes (right panel, –2.9% vs. –4.3%).
Glycemic responses according to other baseline characteris- tics are shown in Supplementary Fig. 1. There was no differ- ence in glycemic response to SGLT2 inhibitors according to age and gender. However, a significantly larger HbA1c reduc-
tion following SGLT2 inhibitor therapy was shown in patients with shorter diabetes duration (<5 years), preserved eGFR (≥90 mL/min/1.73 m2), and poorly controlled diabetes (HbA1c ≥9%).
Efficacy of SGLT2 inhibitor according to baseline anti- diabetes use
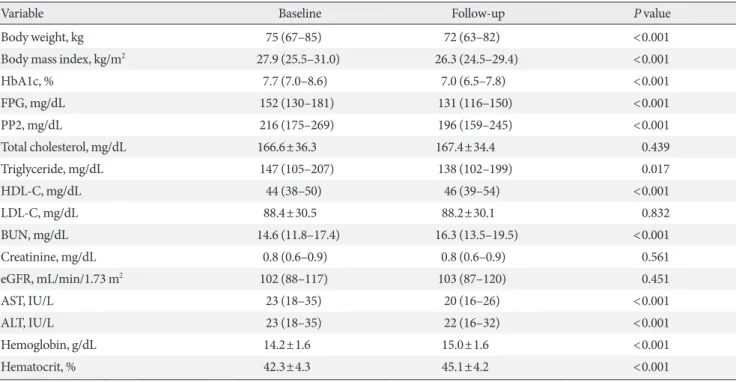
Next, the effect of SGLT2 inhibitors was observed according to concomitant anti-diabetic medications. Baseline metformin or TZD use with SGLT2 inhibitor treatment did not impact the change from baseline HbA1c or the proportions of subjects achieving HbA1c <7% (Fig. 2A and B). SU users experienced a greater reduction in HbA1c after the addition of SGLT2 in- hibitor versus non-users (–0.6% vs. –0.4%, P=0.001) (Fig. 2A), but the percentage of patients who reached the glycemic target was higher in SU non-users (29.1% vs. 48.5%, P<0.001) (Fig.
2B). As the SU users had inadequately controlled diabetes at baseline (Supplementary Table 2), it might be easier to lower the baseline high glucose, but it was not enough to reach the HbA1c <7%. On the other hand, the effect of SGLT2 inhibitor on prevalent DPP4 inhibitor users compared to non-users was significant both in the change from baseline HbA1c (–0.6% vs.
–0.4%, P=0.002) and in the proportions of subjects who achieved HbA1c <7% (44.4% vs. 35.6%, P=0.036). The adjust- ed weight loss was about 4% and was not impacted by baseline metformin, SU, or DPP4 inhibitor use, whereas the combina-
Fig. 1. Efficacy parameters according to baseline glycosylated hemoglobin (HbA1c) and body mass index (BMI). (A) Change from baseline HbA1c, (B) changes in body weight according to baseline HbA1c and BMI categories. Data are expressed as medi- an (interquartile range). aP<0.01, bP<0.001.
0.5 0
−0.5
−1.0
−1.5
−2.0
0
−2
−4
−6
Change from baseline HbA1c (%) Changes in body weight (%) −8
<25
(n=22) <25
(n=22) Baseline BMI (kg/m2)
Baseline HbA1c<7% Baseline HbA1c≥7%
Baseline BMI (kg/m2)
−0.1%
−4.6%
0.0%
−4.0%
−0.6%
−2.9%
−0.8%
−4.3%
(n=152)≥25 ≥25
(n=152)
<25
(n=180) <25
(n=180)
(n=450)≥25 ≥25
(n=450)
a b
b b
b A B
tion therapy with TZD offset the weight loss effects of the SGLT2 inhibitor (P=0.015) (Fig. 2C).
When subjects were divided according to respective drug combinations, 18 (2.2%) started SGLT2 inhibitor as monother- apy; 305 (37.9%) were on dual therapy; 353 (43.9%) were on triple combination therapy; and 128 (15.9%) were on quadru-
ple combination therapy with addition of SGLT2 inhibitor to preexisting metformin, SU, TZD, or DPP4 inhibitor therapy.
The detailed combinations of anti-diabetic drugs and the re- duction of HbA1c are described in Supplementary Table 5. Be- cause the combinations of anti-diabetic drugs were so diverse and those except for the four major combinations were difficult
Fig. 2. Efficacy parameters according to baseline anti-diabetic drug use. (A) Change from baseline glycosylated hemoglobin (HbA1c), (B) subjects with baseline HbA1c ≥7% who achieved HbA1c <7%, (C) changes in body weight. Data are expressed as median (interquartile range) or number (%). DPP4i, dipeptidyl peptidase 4 inhibitor; TZD, thiazolidinedione. aP<0.05.
0.5 0
−0.5
−1.0
−1.5
−2.0
60 50 40 30 20 10 0
0
−2
−4
−6
−8 Change from baseline HbA1c (%)Subjects with baseline HbA1c ≥7% who achieved HbA1c <7% (%)Changes in body weight (%)
Metformin
Metformin
Metformin
DPP4i
DPP4i
DPP4i Sulfonylurea
Sulfonylurea
Sulfonylurea
TZD
TZD
TZD Baseline non-user Baseline user
−0.5%
39.1
−2.1%
−0.4%
35.6
−4.1%
−0.5%
38.2
−4.0%
−0.6%
44.4
−3.6%
−0.4%
48.5
−4.3%
−0.5%
38.9
−4.1%
−0.6%
29.1
−3.6%
−0.4%
29.3
−2.6%
P=0.702 P=0.930
P=0.144
P=0.002a P=0.036a
P=0.346 P=0.001a
P<0.001a
P=0.304
P=0.570 P=0.221
P=0.015a
A
B
C
to analyze due to the small number of subjects, we analyzed subjects by baseline user or non-user through the manuscript.
Analysis of predictive markers for the response to SGLT2 inhibitors
To identify the predictive markers of SGLT2 inhibitors on
HbA1c levels, linear regression analyses were conducted (Table 3). After adjusted for age, sex, initial BMI, diabetes duration, duration of SGLT2 inhibitor use, baseline HbA1c, eGFR, and other anti-diabetic agent use (metformin, SU, DPP4 inhibitor, and TZD), shorter diabetes duration, higher baseline HbA1c, and eGFR were the common predictors for a better response following SGLT2 inhibitor treatment in all subjects (all P<
0.05). However, the baseline BMI had an inverse effect accord- ing to glycemic status. Lower BMI in well-controlled diabetes patients (baseline HbA1c <7%) and higher BMI in inade- quately controlled diabetes patients (baseline HbA1c ≥7%) were associated with better response. Preexisting anti-diabetics use did not have an impact on subjects with lower baseline HbA1c <7%, but baseline SU and DPP4 inhibitor use were po- tential moderators of the SGLT2 inhibitor effects in subjects with baseline HbA1c ≥7%. SU use was associated with a lower response after adjusting for covariates whereas DPP4 inhibitor use was related to a significantly better response after the addi- tion of SGLT2 inhibitor.
DISCUSSION
In this study, we analyzed 804 patients who were administered three widely used SGLT2 inhibitors (empagliflozin, dapa- gliflozin, and ipragliflozin). After treatment for a median 192 days, the HbA1c level decreased by 0.7% (baseline 7.7%) and the weight loss was about 3.0 kg. Evaluation of the clinical fac- tors affecting SGLT2 inhibitor response revealed that shorter diabetes duration, higher baseline HbA1c level and eGFR were associated with a greater reduction in HbA1c levels. The base- line BMI showed an opposite effect according to glycemic sta- tus and lean, tightly controlled subjects and obese, inadequate- ly controlled subjects showed better responses. The type of an- ti-diabetic agents used before the addition of an SGLT2 inhibi- tor was also an important determinant. Baseline metformin and TZD use did not have an impact, but baseline DPP4 in- hibitor users received the greatest benefit from SGLT2 inhibi- tor therapy. SU use was associated with a significantly lower response after adjusting for covariates.
As the pathophysiology of T2DM is complex, the use of combination therapy with complementary mechanisms of ac- tion may offer additive or synergistic effects in glucose control [16]. DPP4 inhibitors prevent the degradation of incretin hor- mones such as glucagon-like peptide-1 and glucose-dependent insulinotropic polypeptide, which stimulate insulin secretion Table 3. Linear regression analysis for better glycemic response
to SGLT2 inhibitors
Variable Univariate Multivariatea
β P value β P value Baseline HbA1c <7% (n=174)
Age, yr 0.001 0.874 0.006 0.268
Female sex 0.089 0.387 0.103 0.319
Initial BMI, kg/m2 –0.033 0.010 –0.031 0.018 DM duration, yr –0.040 0.001 –0.050 <0.001 Duration of SGLT2
inhibitor use, day –0.001 0.023 –0.001 0.096 Baseline HbA1c, % 0.316 0.043 0.423 0.005 Total cholesterol, mg/dL 0.002 0.305 0.001 0.588 eGFR, mL/min/1.73 m2 0.005 0.028 0.006 0.012 Metformin use –0.200 0.292 0.095 0.606
SU use –0.074 0.586 0.116 0.392
DPP4 inhibitor use –0.156 0.267 –0.203 0.128
TZD use –0.184 0.386 0.066 0.749
Baseline HbA1c ≥7% (n=630)
Age, yr –0.013 0.006 0.007 0.121
Female sex –0.129 0.195 –0.129 0.136
Initial BMI, kg/m2 0.027 0.019 0.020 0.042 DM duration, yr –0.028 <0.001 –0.030 <0.001 Duration of SGLT2
inhibitor use, day 0.001 0.638 –0.001 0.847 Baseline HbA1c, % 0.566 <0.001 0.596 <0.001 Total cholesterol, mg/dL 0.003 0.056 0.001 0.949 eGFR, mL/min/1.73 m2 0.008 <0.001 0.007 <0.001 Metformin use –0.158 0.546 –0.015 0.948
SU use –0.007 0.943 –0.191 0.034
DPP4 inhibitor use 0.122 0.255 0.229 0.013
TZD use 0.073 0.714 0.093 0.587
SGLT2, sodium-glucose co-transporter 2; HbA1c, glycosylated he- moglobin; BMI, body mass index; DM, diabetes mellitus; eGFR, esti- mated glomerular filtration rate; SU, sulfonylurea; DPP4, dipeptidyl peptidase 4; TZD, thiazolidinedione.
aAdjusted for age, sex, initial BMI, diabetes duration, duration of SGLT2 inhibitor use, baseline HbA1c and eGFR levels, and anti-dia- betic agent use (metformin, SU, DPP4 inhibitor, and TZD).
and inhibit glucagon release [17]. SGLT2 inhibitors improve glycemic control in an insulin-independent manner by pro- moting urinary glucose excretion [9]. Thus, the combination of DPP4 inhibitor and an SGLT2 inhibitor is an attractive ap- proach. Furthermore, recent studies have shown that glucos- uria produced by SGLT2 inhibitors is accompanied by in- creased endogenous glucose production (EGP), which may offset the glucose-lowering effect [18]. As DPP4 inhibitors suppress glucagon secretion from pancreatic α-cells and re- duce EGP [17], combining DPP4 inhibitor and SGLT2 inhibi- tor may exert more beneficial effects [19].
This issue includes several studies on the effect of combina- tion therapy of DPP4 inhibitor and SGLT2 inhibitor. Rosen- stock et al. [20] have assessed the efficacy and safety of the dual add-on of saxagliptin/dapagliflozin compared with those of saxagliptin or dapagliflozin added alone to metformin. Triple combination therapy showed a significantly greater HbA1c re- duction than dual therapy with saxagliptin or dapagliflozin, with a mean change from baseline HbA1c of –1.5% versus –0.9% or –1.2%. Patients were well tolerated and hypoglycemia was rare, with no events of major hypoglycemia. DeFronzo et al. [21] reported similar findings after examining the effect of the combination of empagliflozin/linagliptin added to metfor- min versus each agent alone. As most of our study patients (95.4%) were already prescribed metformin, our results are in line with those of previous studies showing the greatest re- sponse in the combined therapy of metformin plus DPP4 in- hibitor plus SGLT2 inhibitor. However, the degree of HbA1c reduction was slightly differed from the above studies. This discrepancy may probably due to the differences in drug com- pliance, which is much higher in randomized clinical trial, and the difference of baseline phenotype (ethnicity, initial HbA1c, and BMI) in patients.
On the other hand, the decrease from baseline HbA1c level was larger in baseline SU users as absolute values, but the sig- nificance was reduced after adjusting for various factors in multiple regression analysis. Compared to other anti-diabetic agents, there were significant differences between SU users and non-users; the SU users were older, and had a longer diabetes duration, and were not well-controlled (Supplementary Table 2). Thus, it appears that these characteristics of baseline SU us- ers are also related to the poor response to the addition of an SGLT2 inhibitor.
The different effect of BMI on glucose control according to baseline HbA1c is a novel finding. In previous studies evaluat-
ing the clinical characteristics of glycemic response to SGLT2 inhibitors, baseline BMI was not associated with the glucose- lowering effect of SGLT2 inhibitor treatment [14,22,23]. High- er baseline HbA1c, FPG, and eGFR are known independent predictors influencing the HbA1c reduction [14,22,23]. How- ever, as the baseline HbA1c may influence the response in dif- ferent BMI groups, we compared the therapeutic efficacy of SGLT2 inhibitor among different HbA1c and BMI categories, demonstrating that obese T2DM patients with inadequate sugar control are more responsive to SGLT2 inhibitors. The in- crease in renal glucose excretion in proportion to the plasma glucose level [24] and the greater weight loss in obese subjects may have synergistic effects, though the precise mechanisms are unknown. However, considering of small sample number (n=22) in the lean and well-controlled diabetes patients, atten- tion should be paid in interpreting this phenomenon.
Our study has several limitations. First, we could not assess diet, exercise, or drug compliance during SGLT2 inhibitor treatment. Second, as this study design was retrospective, the type or dosage of other prescribing anti-diabetic agents was not standardized. Third, the degree of urinary glucose excre- tion was not measured. However, despite these limitations, we analyzed a relatively large number of patients who used SGLT2 inhibitors in a real-world setting, revealed the clinical factors, and identified the best SGLT2 inhibitor combination for opti- mal glucose-lowering efficacy.
In summary, this retrospective observational study suggests that the addition of SGLT2 inhibitor use can provide greater glycemic benefit in inadequately controlled T2DM patients with a preserved renal function, short diabetes duration, and in baseline DPP4 inhibitor users. In association with BMI and HbA1c levels, lower BMI in well-controlled subjects and high- er BMI in poorly controlled subjects were associated with bet- ter response. Further prospective studies are warranted to ob- tain more information on the therapeutic applications of SGLT2 inhibitors.
CONFLICTS OF INTEREST
No potential conflict of interest relevant to this article was re- ported.
ACKNOWLEDGMENTS
We would like to thank Jiyu Sun (Statistician, Department of
Preventive Medicine, Yonsei University College of Medicine) for the help with statistical consultation.
REFERENCES
1. Shaw JE, Sicree RA, Zimmet PZ. Global estimates of the preva- lence of diabetes for 2010 and 2030. Diabetes Res Clin Pract 2010;87:4-14.
2. Emerging Risk Factors Collaboration, Sarwar N, Gao P, Sesha- sai SR, Gobin R, Kaptoge S, Di Angelantonio E, Ingelsson E, Lawlor DA, Selvin E, Stampfer M, Stehouwer CD, Lewington S, Pennells L, Thompson A, Sattar N, White IR, Ray KK, Danesh J. Diabetes mellitus, fasting blood glucose concentration, and risk of vascular disease: a collaborative meta-analysis of 102 prospective studies. Lancet 2010;375:2215-22.
3. UK Prospective Diabetes Study (UKPDS) Group. Intensive blood-glucose control with sulphonylureas or insulin compared with conventional treatment and risk of complications in pa- tients with type 2 diabetes (UKPDS 33). Lancet 1998;352:837- 53.
4. Holman RR, Paul SK, Bethel MA, Matthews DR, Neil HA. 10- Year follow-up of intensive glucose control in type 2 diabetes.
N Engl J Med 2008;359:1577-89.
5. Hayward RA, Reaven PD, Wiitala WL, Bahn GD, Reda DJ, Ge L, McCarren M, Duckworth WC, Emanuele NV; VADT Inves- tigators. Follow-up of glycemic control and cardiovascular out- comes in type 2 diabetes. N Engl J Med 2015;372:2197-206.
6. Ali MK, Bullard KM, Saaddine JB, Cowie CC, Imperatore G, Gregg EW. Achievement of goals in U.S. diabetes care, 1999- 2010. N Engl J Med 2013;368:1613-24.
7. Montvida O, Shaw J, Atherton JJ, Stringer F, Paul SK. Long- term trends in antidiabetes drug usage in the U.S.: real-world evidence in patients newly diagnosed with type 2 diabetes. Di- abetes Care 2018;41:69-78.
8. Mullard A. 2013 FDA drug approvals. Nat Rev Drug Discov 2014;13:85-9.
9. Chao EC, Henry RR. SGLT2 inhibition: a novel strategy for di- abetes treatment. Nat Rev Drug Discov 2010;9:551-9.
10. Ferrannini E, Ramos SJ, Salsali A, Tang W, List JF. Dapa- gliflozin monotherapy in type 2 diabetic patients with inade- quate glycemic control by diet and exercise: a randomized, double-blind, placebo-controlled, phase 3 trial. Diabetes Care 2010;33:2217-24.
11. Jung CH, Jang JE, Park JY. A novel therapeutic agent for type 2 diabetes mellitus: SGLT2 inhibitor. Diabetes Metab J 2014;38:
261-73.
12. Zinman B, Wanner C, Lachin JM, Fitchett D, Bluhmki E, Han- tel S, Mattheus M, Devins T, Johansen OE, Woerle HJ, Broedl UC, Inzucchi SE; EMPA-REG OUTCOME Investigators. Em- pagliflozin, cardiovascular outcomes, and mortality in type 2 diabetes. N Engl J Med 2015;373:2117-28.
13. Neal B, Perkovic V, Mahaffey KW, de Zeeuw D, Fulcher G, Erondu N, Shaw W, Law G, Desai M, Matthews DR; CANVAS Program Collaborative Group. Canagliflozin and cardiovascu- lar and renal events in type 2 diabetes. N Engl J Med 2017;377:
644-57.
14. Lee JY, Kim G, Kim SR, Lee YH, Lee BW, Cha BS, Kang ES.
Clinical parameters affecting dapagliflozin response in patients with type 2 diabetes. Diabetes Metab 2017;43:191-4.
15. Levey AS, Bosch JP, Lewis JB, Greene T, Rogers N, Roth D. A more accurate method to estimate glomerular filtration rate from serum creatinine: a new prediction equation. Modifica- tion of Diet in Renal Disease Study Group. Ann Intern Med 1999;130:461-70.
16. Defronzo RA. Banting Lecture. From the triumvirate to the ominous octet: a new paradigm for the treatment of type 2 dia- betes mellitus. Diabetes 2009;58:773-95.
17. Ahren B, Landin-Olsson M, Jansson PA, Svensson M, Holmes D, Schweizer A. Inhibition of dipeptidyl peptidase-4 reduces glycemia, sustains insulin levels, and reduces glucagon levels in type 2 diabetes. J Clin Endocrinol Metab 2004;89:2078-84.
18. Merovci A, Solis-Herrera C, Daniele G, Eldor R, Fiorentino TV, Tripathy D, Xiong J, Perez Z, Norton L, Abdul-Ghani MA, De- Fronzo RA. Dapagliflozin improves muscle insulin sensitivity but enhances endogenous glucose production. J Clin Invest 2014;124:509-14.
19. Abdul-Ghani M. Where does combination therapy with an SGLT2 inhibitor plus a DPP-4 inhibitor fit in the management of type 2 diabetes? Diabetes Care 2015;38:373-5.
20. Rosenstock J, Hansen L, Zee P, Li Y, Cook W, Hirshberg B, Iqbal N. Dual add-on therapy in type 2 diabetes poorly con- trolled with metformin monotherapy: a randomized double- blind trial of saxagliptin plus dapagliflozin addition versus sin- gle addition of saxagliptin or dapagliflozin to metformin. Dia- betes Care 2015;38:376-83.
21. DeFronzo RA, Lewin A, Patel S, Liu D, Kaste R, Woerle HJ, Broedl UC. Combination of empagliflozin and linagliptin as second-line therapy in subjects with type 2 diabetes inadequate- ly controlled on metformin. Diabetes Care 2015;38:384-93.
22. Strojek K, Yoon KH, Hruba V, Elze M, Langkilde AM, Parikh S.
Effect of dapagliflozin in patients with type 2 diabetes who have inadequate glycaemic control with glimepiride: a ran- domized, 24-week, double-blind, placebo-controlled trial. Dia- betes Obes Metab 2011;13:928-38.
23. Bujac S, Del Parigi A, Sugg J, Grandy S, Liptrot T, Karpefors M, Chamberlain C, Boothman AM. Patient characteristics are not associated with clinically important differential response to
dapagliflozin: a staged analysis of phase 3 data. Diabetes Ther 2014;5:471-82.
24. Ferrannini E, Veltkamp SA, Smulders RA, Kadokura T. Renal glucose handling: impact of chronic kidney disease and sodi- um-glucose cotransporter 2 inhibition in patients with type 2 diabetes. Diabetes Care 2013;36:1260-5.
Supplementary Table 1. Baseline characteristics of patients according to baseline met- formin use
Variable Prevalent metformin user
(n=767) Metformin non-user
(n=37) P value
Age, yr 57 (49–63) 57 (50–66) 0.305
Male sex 416 (54.2) 21 (56.8) 0.764
DM duration, yr 7.2 (3.7–11.2) 5.4 (2.0–8.6) 0.010
Body mass index, kg/m2 27.3 (25.0–30.1) 25.8 (24.2–31.2) 0.351
HbA1c, % 7.7 (7.0–8.6) 7.4 (6.7–8.6) 0.256
FPG, mg/dL 152 (130–181) 149 (125–182) 0.617
PP2, mg/dL 232 (192–283) 245 (155–300) 0.775
Total cholesterol, mg/dL 163 (142–187) 172 (144–192) 0.334
Triglyceride, mg/dL 147 (105–207) 139 (99–215) 0.502
HDL-C, mg/dL 44 (38–51) 43 (40–50) 0.600
LDL-C, mg/dL 84 (67–107) 97 (76–109) 0.114
BUN, mg/dL 14.6 (11.8–17.4) 14.4 (12.9–17.3) 0.650
Creatinine, mg/dL 0.8 (0.6–0.9) 0.8 (0.7–0.9) 0.497
eGFR, mL/min/1.73 m2 102 (88–117) 97 (84–119) 0.449
AST, IU/L 23 (18–36) 21 (18–31) 0.432
ALT, IU/L 30 (20–49) 22 (20–45) 0.184
Values are presented as median (interquartile range) or number (%).
DM, diabetes mellitus; HbA1c, glycosylated hemoglobin; FPG, fasting plasma glucose; PP2, post- prandial 2-hour glucose; HDL-C, high density lipoprotein cholesterol; LDL-C, low density lipopro- tein cholesterol; BUN, blood urea nitrogen; eGFR, estimated glomerular filtration rate; AST, aspar- tate aminotransferase; ALT, alanine aminotransferase.
Supplementary Table 2. Baseline characteristics of patients according to baseline sulfo- nylurea use
Variable Prevalent SU user
(n=363) SU non-user
(n=441) P value
Age, yr 58 (50–64) 56 (48–63) 0.006
Male sex 209 (57.6) 228 (51.7) 0.096
DM duration, yr 9.5 (6.0–14.2) 5.4 (2.4–9.5) <0.001
Body mass index, kg/m2 26.7 (24.6–30.0) 27.7 (25.2–30.5) 0.033
HbA1c, % 8.1 (7.6–9.0) 7.3 (6.8–8.0) <0.001
FPG, mg/dL 163 (140–196) 143 (125–166) <0.001
PP2, mg/dL 260 (209–310) 216 (180–264) <0.001
Total cholesterol, mg/dL 158 (139–180) 168 (144–193) 0.001
Triglyceride, mg/dL 140 (105–203) 151 (108–212) 0.135
HDL-C, mg/dL 43 (38–49) 44 (38–52) 0.096
LDL-C, mg/dL 82 (65–103) 87 (68–107) 0.047
BUN, mg/dL 14.9 (12.1–17.8) 14.4 (11.5–16.9) 0.011
Creatinine, mg/dL 0.8 (0.6–0.9) 0.8 (0.6–0.9) 0.423
eGFR, mL/min/1.73 m2 101 (87–119) 103 (90–116) 0.585
AST, IU/L 22 (17–32) 24 (18–39) 0.002
ALT, IU/L 27 (19–44) 32 (20–52) 0.011
Values are presented as median (interquartile range) or number (%).
SU, sulfonylurea; DM, diabetes mellitus; HbA1c, glycosylated hemoglobin; FPG, fasting plasma glucose; PP2, post-prandial 2-hour glucose; HDL-C, high density lipoprotein cholesterol; LDL-C, low density lipoprotein cholesterol; BUN, blood urea nitrogen; eGFR, estimated glomerular filtra- tion rate; AST, aspartate aminotransferase; ALT, alanine aminotransferase.
Supplementary Table 3. Baseline characteristics of patients according to baseline thia- zolidinedione use
Variable Prevalent TZD user
(n=52) TZD non-user
(n=752) P value
Age, yr 56 (48–63) 57 (49–64) 0.777
Male sex 38 (73.1) 399 (53.1) 0.005
DM duration, yr 11.2 (6.2–15.2) 6.9 (3.4–11.2) <0.001
Body mass index, kg/m2 27.2 (25.6–30.6) 27.3 (24.9–30.3) 0.623
HbA1c, % 8.0 (7.2–8.7) 7.7 (7.0–8.6) 0.288
FPG, mg/dL 160 (124–185) 152 (130–181) 0.770
PP2, mg/dL 222 (196–276) 232 (191–285) 0.766
Total cholesterol, mg/dL 163 (142–185) 164 (142–188) 0.944
Triglyceride, mg/dL 119 (86–165) 149 (106–211) 0.002
HDL-C, mg/dL 45 (41–53) 44 (38–50) 0.095
LDL-C, mg/dL 89 (71–108) 84 (66–107) 0.365
BUN, mg/dL 14.7 (13.0–18.3) 14.6 (11.7–17.3) 0.150
Creatinine, mg/dL 0.9 (0.7–1.0) 0.8 (0.6–0.9) 0.014
eGFR, mL/min/1.73 m2 95 (83–116) 103 (89–117) 0.104
AST, IU/L 19 (16–27) 23 (18–36) 0.002
ALT, IU/L 21 (16–34) 30 (20–50) <0.001
Values are presented as median (interquartile range) or number (%).
TZD, thiazolidinedione; DM, diabetes mellitus; HbA1c, glycosylated hemoglobin; FPG, fasting plasma glucose; PP2, post-prandial 2-hour glucose; HDL-C, high density lipoprotein cholesterol;
LDL-C, low density lipoprotein cholesterol; BUN, blood urea nitrogen; eGFR, estimated glomeru- lar filtration rate; AST, aspartate aminotransferase; ALT, alanine aminotransferase.
Supplementary Table 4. Baseline characteristics and changes in HbA1c and body weight according to the kinds of SGLT2 inhibitors
Variable Empagliflozin users
(n=128) Dapagliflozin users
(n=500) Ipragliflozin users
(n=176) P value
Age, yr 56 (47–63) 56 (49–63) 59 (51–66) 0.002
Male sex 92 (71.9) 246 (49.2) 99 (56.3) <0.001
DM duration, yr 5.4 (2.3–9.8) 8.9 (4.6–12.2) 5.4 (2.3–8.5) <0.001
Body mass index, kg/m2 26.7 (24.2–29.3) 27.7 (25.3–30.8) 26.8 (24.5–29.6) 0.024
HbA1c, % 7.7 (7.0–8.6) 7.8 (7.2–8.7) 7.4 (6.8–8.1) <0.001
FPG, mg/dL 146 (128–178) 156 (132–186) 145 (124–164) 0.003
PP2, mg/dL 243 (190–285) 242 (196–291) 222 (185–274) 0.109
Total cholesterol, mg/dL 161 (135–181) 163 (144–186) 168 (140–193) 0.281
Triglyceride, mg/dL 162 (113–208) 141 (103–206) 151 (106–217) 0.293
HDL-C, mg/dL 44 (38–51) 44 (27–40) 44 (37–53) 0.977
LDL-C, mg/dL 82 (64–99) 86 (68–108) 85 (67–110) 0.077
BUN, mg/dL 14.8 (12.1–18.2) 14.4 (11.8–17.3) 14.9 (11.5–17.2) 0.371
Creatinine, mg/dL 0.8 (0.7–1.0) 0.7 (0.6–0.9) 0.8 (0.7–0.9) <0.001
eGFR, mL/min/1.73 m2 100 (84–115) 103 (90–120) 99 (87–114) 0.029
AST, IU/L 24 (18–32) 23 (18–37) 24 (18–36) 0.948
ALT, IU/L 28 (17–48) 30 (20–50) 29 (20–46) 0.715
Change from baseline HbA1c, % –0.5 (–1.2 to 0) –0.5 (–1.3 to 0) –0.5 (–1.0 to 0) 0.629
Changes in body weight, % 3.5 (1.2–6.3) 4.1 (1.4–6.9) 3.5 (0.0–6.0) 0.125
Values are presented as median (interquartile range) or number (%). Change from baseline HbA1c (%) was calculated as (follow- up HbA1c–baseline HbA1c) and changes in body weight (%) were calculated as [(baseline body weight–follow-up body weight)/
baseline body weight]×100.
HbA1c, glycosylated hemoglobin; SGLT2, sodium-glucose co-transporter 2; DM, diabetes mellitus; FPG, fasting plasma glucose;
PP2, post-prandial 2-hour glucose; HDL-C, high density lipoprotein cholesterol; LDL-C, low density lipoprotein cholesterol;
BUN, blood urea nitrogen; eGFR, estimated glomerular filtration rate; AST, aspartate aminotransferase; ALT, alanine aminotrans- ferase.
Supplementary Table 5. Combination of anti-diabetic drugs and change from baseline HbA1c in each group
Medication Total
subjects Change from baseline HbA1c, %
SGLT2i only 18 –0.3
SGLT2i+Met 295 –0.5
SGLT2i+SU 8 –0.9
SGLT2i+DPP4i 1 –0.3
SGLT2i+TZD 1 –1.1
SGLT2i+Met+SU 225 –0.7
SGLT2i+Met+DPP4i 105 –0.7
SGLT2i+Met+TZD 14 –0.3
SGLT2i+SU+DPP4i 5 –1.0
SGLT2i+SU+TZD 3 –1.7
SGLT2i+DPP4i+TZD 1 –0.1
SGLT2i+Met+SU+DPP4i 95 –0.8
SGLT2i+Met+SU+TZD 25 –0.5
SGLT2i+Met+DPP4i+TZD 8 –1.1
HbA1c, glycosylated hemoglobin; SGLT2i, sodium-glucose co-trans- porter 2 inhibitor; Met, metformin; SU, sulfonylurea; DPP4i, dipepti- dyl peptidase 4 inhibitor; TZD, thiazolidinedione.
Supplementary Fig. 1. Changes in glycosylated hemoglobin (HbA1c) levels according to age, gender, diabetes duration, estimat- ed glomerular filtration rate, and baseline HbA1c level. Data are expressed as median (interquartile range) for (A) age, (B) gender, (C) diabetes duration, (D) estimated glomerular filtration rate (eGFR), (E) initial HbA1c. DM, diabetes mellitus. aP<0.05,
bP<0.01, cP<0.001.
0
−0.5
−1.0
−1.5
0
−0.5
−1.0
−1.5
1 0
−1
−2
−3
−4
0
−0.5
−1.0
−1.5 0
−0.5
−1.0
rom be HbA1c (%)elinasm bChge fanChe HbA1c (%)aselinroasange fge fm broeline HbA1c (%)Chan Chelinasm broge fane HbA1c (%)e HbA1c (%)elinasm broge fanCh −1.5
<50
<5
<7
<90
Male Female
50–60
5–10
7–9
90–120
≥60
≥10
≥9
≥120 Age (yr)
DM duration (yr)
Baseline HbA1c (%)
eGFR (mL/min/1.73 m2) Sex
a
c
c c
b b
A
C
E
D B