* This paper is supported by a project, “metri-2008-B-5”
** Researcher, Climate Research Laboratory, National Institute of Meteorological Research, Korea Meteorological Administration, [email protected]
*** Director, Climate Research Laboratory, National Institute of Meteorological Research, Korea Meteorological Administration, [email protected]
**** Senior Scientist, Climate Research Laboratory, National Institute of Meteorological Research, Korea Meteorological Administration, [email protected]
***** Junior scientist, Climate Research Laboratory, National Institute of Meteorological Research, Korea Meteorological Administration, [email protected]
Recent Spatial and Temporal Changes in Means and Extreme Events of Temperature and Precipitation across
the Republic of Korea*
Gwangyong Choi**·Won-Tae Kwon***·Kyung-On Boo****·Yu-Mi Cha*****
최근 우리나라 기온 및 강수 평균과 극한 사상의 시·공간적 변화*
최광용**·권원태***·부경온****·차유미*****
Abstract:In this study, the spatial and temporal patterns of changes in means and extreme events of temperature and precipitation across the Republic of Korea over the last 35 years (1973-2007) are examined. Over the study period, meteorological winter (December-February) mean minimum (maximum) temperature has increased by +0.54°C/decade (+0.6°C/decade), while there have been no significant changes in meteorological summer (June-August) mean temperatures. According to analyses of upper or lower 10thpercentile-based extreme temperature indices, the annual frequency of cool nights (days) has decreased by -9.2 days/decade (-3.3 days/decade), while the annual frequency of warm nights (days) has increased by +4.9 days/decade (+6.8 days/decade). In contrast, the increase rates of summer warm nights (+8.0 days/°C) and days (+6.6 days/°C) relative to changes in summer means minimum and maximum temperatures means are greater than the decreasing rates of winter nights (-5.2 days/°C) and days (-4.3 days/°C) relative to changes in winter temperatures. These results demonstrate that seasonal and diurnal asymmetric changes in extreme temperature events have occurred. Moreover, annual total precipitation has increased by 85.5 mm/decade particularly in July and August, which led to the shift of a bimodal behavior of summer precipitation into a multi-modal structure.
These changes have resulted from the intensification of heavy rainfall events above 40mm in recent decades, and spatially the statistically-significant increases in these heavy rainfall events are observed around the Taebaek mountain region.
Key Words : extreme climate indices, extreme temperature days, extreme precipitation days, the sensitivity of extreme climate events, climate change.
요약:본 연구에서는 우리나라 61개 지점 기온 및 강수 자료에서 산출한 31개의 극한 기후 지수를 바탕으로 최근 35년 동안(1973- 2007)의 계절 평균 값의 변화에 따른 우리나라 극한 기온 및 강수 사상의 시·공간적 변화 패턴을 조사하였다. 연구기간 동안 우리나
1. Introduction
The Intergovernmental Panel on Climate Change (IPCC, 2007) documented that the linear increase rate of global surface mean temperature since the 1950s was greater than that over the last 100 years (1906-2005). The enhanced increasing rate in recent decades amplifies societal concern that more frequent and intense climate extreme events could occur in the warmer 21stcentury. In fact, a single catastrophic climate event can kill more than tens of thousands of people and devastate tremendous amount of human property during a very short period. Several catastrophic weather-related disasters in recent decades including the 2003 European heat wave, 2005 US’s hurricane Katrina, and 2008 Myanmar’s cyclone Nargis exemplified how much our societies are vulnerable to extreme climate events. In the Republic of Korea, similarly extreme rainfall events including typhoon Maemi in 2003 as well as a localized heavy rainfall in Inje in 2006 demonstrated the destructiveness of extreme climate events. Climate models predict that in the warmer 21st century, extreme climate events including heat waves, heavy rainfall, and severe droughts will increase on various temporal and spatial scales due to increases in temperature means (Meehl and Tebaldi, 2004). However, the
IPCC (2007) pointed out that changes in climate mean and variance do not necessarily drive the identical sign and magnitude of changes in extreme climate events spatially and temporally.
These indicate that to develop effective warning systems as well as reliable prediction methods for extreme climate events, it is needed to fully understand the characteristics of current changes in extreme climate events based on high resolution spatial and temporal observational data.
To date, indicators or indices for extreme climate events have been actively devised by many scientists. Among more than hundreds of indices, the latest list of the most useful extreme climate indices has been provided by the Joint World Meteorological Organization Commission for Climatology (CCI)/World Climate Research Programme (WCRP) project on Climate Variability, and Predictability Expert Team on Climate Change Detection, Monitoring and Indices (ETCCDMI) (hereafter, CCI/WCRP- ETCCDMI). Many regional (Manton et al., 2001;
Peterson et al., 2002; Klein Tank and Können, 2003; Griffiths et al., 2005; New et al., 2005;
Vincent et al., 2005; Moberg and Jones, 2005;
Klein Tank et al., 2006) and global (Frich et al., 2002; Alexander et al., 2006) trends of extreme climate events have been popularly examined 라 평균적으로 기상학적 겨울철(12-1월) 일 최고기온(일 최저기온)은 +0.60℃/10년(+0.54℃/10년)의 비율로 상승한 반면, 여름철(6- 8월) 극한 기온 평균은 통계적으로 유의미한 변화를 나타내지 않았다. 기온 극한 사상의 경우에는 연구기간 동안 상·하위 10번째 퍼 센타일 값을 기준으로 한 우리나라 평균 한랭한 밤과 낮의 발생빈도가 각각 -9.2 일/10년과 -3.3 일/10년의 감소추세를 보인 반면, 온난한 밤과 낮의 발생빈도는 각각 +4.9 일/10년과 +6.8 일/10년의 증가추세를 보였다. 이와 같은 극한 기온 사상의 변화는 계절적 으로 겨울철에 더 크게 나타났지만, 오히려 일 최저 또는 일 최고 평균 상승에 따른 여름철 무더운 밤(+8.0 일/℃)과 낮(+6.6 일/℃)의 증가율은 겨울철 추운 밤(-5.2 일/℃)과 낮(-4.3 일/℃)의 감소율보다 더 높게 나타났다. 이러한 패턴은 우리나라 기온 극한 사상의 변화가 주야간 그리고 계절별로 비대칭적으로 나타나고 있다는 것을 가리킨다. 한편 우리나라 평균적인 연 총 강수량은 연구기간 동 안 85.5mm/10년의 비율로 증가추세를 보였는데, 특히 7~8월 강수량이 통계적으로 유의미하게 증가하여 여름 장마 이후의 이중 극 대점의 강수분포가 다중 극대점 구조로 전환되었다. 이러한 여름 강수패턴의 변화는 주로 40mm 이상의 여름철 극한 강수일이 증가 하면서 나타났고, 공간적으로 통계적으로 유의미한 극한 강수일의 증가 추세는 태백산맥 주변 지역을 중심으로 나타났다.
주요어 : 극한 기후 지수, 극한 기온일, 극한 강수일, 극한 사상의 민감도, 기후변화
using these indices in recent years. The use of consistent indices beyond different administrative borders through many regional workshops such as the Asian Pacific Network workshops (Manton et al., 2001; Griffiths et al., 2005) facilitated the examinations of changes in extreme climate events across the extensive regions. Similar studies on changes in extreme climates in the Republic of Korea have been also conducted actively in recent years (Choi and Kwon 2001;
Choi, 2004). Choi and Kwon (2001) examined long-term (1920-1999) trends of extreme temperature extreme events based on upper and lower 5th percentile values observed at six weather stations. Choi (2004) examined the trends of 10 extreme temperature and precipitation indices at 14 weather stations over the 1954-1999 period. In these previous studies, however, the number of weather stations was not enough to discuss spatial patterns of extreme climate events, but also most weather stations used in these studies are currently located in urbanized areas. These circumstances make it difficult to comprehend how much of the quantified changes are attributable to the global warming, or to local urbanization. Thus, it is needed to use as many weather stations with less missing data as possible in climate change studies.
The purpose of this study is to examine recent spatial and temporal changes in extreme temperature and precipitation events across the Republic of Korea based on an extensive data set (61 weather stations) and a more comprehensive set of extreme climate indices (31 indices).
Moreover, the change rates of extreme climate events in response to changes in climate means are also examined.
2. Data and Methods
In this study, daily maximum and minimum temperatures as well as daily precipitation observed at 61 weather stations across the Republic of Korea (Figure 1) are used to extract a total of 31 extreme climate indices for the period 1973-2007 (Tables 1 and 2). Basically, twenty seven indices recommended by the CCI/WCRP- ETCCDMI are used, and four additional user- defined indices are devised by incrementing thresholds for the original definitions by 5ºC.
These extreme temperature and precipitation indices have been popularly used in many other previous studies (Alexander et al., 2006). The time series of 31 indices for the period of 1973- Figure 1. 61 weather stations where daily temperatures and
precipitation data have been observed in the Republic of Korea for the period, 1973-2007
2007 are constructed for individual weather stations by running the RClimDex script (Zhang and Yang, 2004) in the R statistical computing and graphics software (http://www.r- project.org/). The homogeneity tests which detect unrealistic climatic records including zero or negative value of daily maximum-minus- minimum temperatures, outliers exceeding the given standard deviations, and negative values of daily precipitation are also carried out in the procedure of running the RClimDex script (Zhang and Yang, 2004). Four standard deviations recommended by Zhang and Yang (2004) are used to detect the outliers in the data set and their plausibility in reality is evaluated by investigating the corresponding weather conditions on the given day in order to decide whether or not the records should be excluded in the analyses.
In spite of these efforts to meet the requirement of the data homogeneity, there are several issues that we should not overlook when we interpret
the trends obtained in the analyses. For instance, the different histories of urbanization as well as relocations of weather stations (Ryoo et al., 2006) might influence change rates of extreme temperature events at individual weather stations.
Furthermore, significant changes in observational devices and practices (e.g. the change from a manual observation method to the Automated Synoptic Observation System (ASOS) since the year 2000) can also contribute to the data discontinuities (Ryoo and Kim, 2007). Ryoo and Kim (2007), however, documented that there have been few significant discontinuities in temperature data sets attributable to changes in devices and practice. In fact, trend analyses in this study, in spite of the shortcomings in the data set, demonstrate that changes in extreme climate events shows almost identical signs across the 61 weather stations and that there have been no clear urban versus rural differences in their magnitude. Moreover, the use of regional average trends in this study, which are extracted from Table 1. Extreme temperature indices used in this study
Abbreviation Index Definition
su25(su30) Summer days Annual count when TX(daily maximum) >25ºC (>30ºC) id0(id-5) Ice days Annual count when TX <0ºC (<-5ºC)
tr25(tr20) Tropical nights Annual count when TN(daily minimum) >25ºC (>20ºC) fd0(fd-5) Frost days Annual count when TN <0ºC (<-5ºC)
gsl Growing season length
Annual (1st Jan to 31stDecember in Northern Hemisphere) count between first span of at least 6 days with daily mean temperature (Tmean) >5ºC and first span after July 1 of 6 days with Tmean<5ºC
txx (txn) Max Tmax (Tmin) Monthly maximum value of TX (TN) tnx (tnn) Min Tmax (Tmin) Monthly minimum value of TX (TN)
tn10p (tn90p) Cool (warm) nights Percentage of days when TN<10th (TN>90th) percentile on the given day tx10p (tx90p) Cool (warm) days Percentage of days when TX<10th (TX>90th) percentile on the given day
wsdi (csdi) Warm (cold) spell Annual count of days with at least 6 consecutive days when TX>90th duration indicator (TN<10th) percentile
dtr Diurnal temperature
Monthly mean difference between TX and TN range
daily climatic data averaged across 61 weather stations, may help minimize the influence of potential discontinuities left in the data sets.
The extreme temperature indices extracted from daily maximum or minimum temperatures are categorized into fixed threshold-based indices and percentile-based indices (Table 1). The extreme temperature indices defined by absolute fixed values include summer days (su25 and su30), ice days (id0 and id-5), frost days(fd0 and fd-5), tropical nights (tr25 and tr20), and growing season length. The detailed thresholds for these fixed-threshold indices are summarized in Table 1. Extreme temperature indices defined by the relative upper or lower 10th percentile values include cool days (tx10p) and nights (tn10p), warm days (tx90p) and nights (tn90p), and warm (wsdi)/cold (csdi) spell duration indicator. Long- term average (1973-2000) upper and lower 10th percentile values on each calendar date are used as the relative thresholds. For instance, the upper 10thpercentile values of 30 year (1973-2000) daily maximum (minimum) temperature are used to define warm days (nights) on each calendar date.
All other indices including diurnal temperature
range (dtr), Max Tmax (txx)/Tmin (txn) and Min Tmax (tnx)/Tmin (tnn) are defined based on diurnal and monthly extreme values.
Extreme precipitation indices are derived from daily precipitation in a similar manner (Table 2).
Annual total precipitation of extremely wet days (r99p) and very wet days (r99p) is based on the long-term (1973-2000) annual average 99th and 95th percentile values, respectively. In contrast, the number of 10mm (r10mm), 20mm (r20mm), and 30mm (r30mm) precipitation days are defined based on fixed-thresholds. Max-1 day (rx 1-day) or 5-day (rx 5-day) precipitation amount is defined based on the most extreme events, and consecutive dry (wet) days are used to examine changes in their duration. The simple daily intensity index (sdii) is defined by averaging the total annual precipitation (prcptot) with the number of precipitation days.
Linear trends that are fitted to the time series of individual extreme climate indices covering the period 1973-2007 are extracted for each weather station or for regional averages. The original change rate obtained in the linear analyses is converted to the decadal change rate in this Table 2. Extreme precipitation indices used in this study
Abbreviation Index Definition
rx1day Max 1-day (5-day)
Monthly maximum 1-day (consecutive 5-day) precipitation (rx5day) precipitation amount
sdii Simple daily intensity index Annual total precipitation divided by the number of wet days (defined as precipitation (PRCP)>=1.0mm) in the year r10mm,
Number of 10mm, 20mm, Annual count of days when PRCP>=10mm, 20mm, and 30mm, r20mm,
30mm precipitation days respectively r30mm
cdd (cwd) Consecutive dry (wet) days Maximum number of consecutive days with PRCP<1mm (PRCP>=1mm) r99p (r95p) Annual total precipitation
Annual total PRCP when PRCP>95th(PRCP>99th) percentile of extremely (very) wet day
prcptot Annual total wet-day
Annual total PRCP in wet days (PRCP>=1mm) precipitation
study. For trends of seasonal or annual mean temperatures, the t-test for the simple linear analyses is used. Statistical significance for the trends in extreme climate events is investigated using the Kendall-tau test, which is known as a non-parametric method to effectively evaluate the trend of extreme climate events (Press et al., 1986). When a p-value is less than 0.05, the trend is considered as statistically significant at 95%
level. For the percentile-based temperature indices, the original percent unit is converted to the number of days. The trends for 61 weather stations and their statistical significance are represented in the spatial distribution maps using triangle symbols. The size of triangles is proportional to the magnitude of changes, and the detailed scales of changes are provided in the legend of each map. The direction of triangles indicates the sign of changes so that the reversed triangles illustrate decreasing trends of the extreme events. The significant trends are illustrated with filled symbols, while insignificant trends are illustrated with open symbols.
3. Results
1) Changes in temperature means and extreme events, 1973-2007
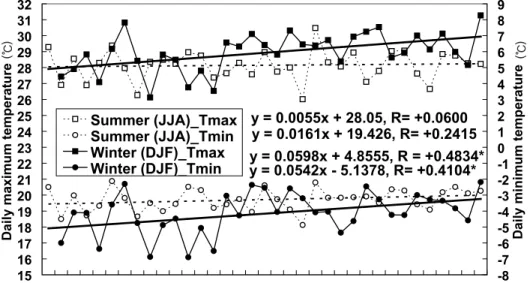
Seasonally, regional average maximum and minimum temperatures across 61 weather stations in the Republic of Korea show different signs and magnitudes of changes over the study period (1973-2007). Meteorological winter (December- February) maximum temperature has increased by 0.60ºC/decade, while winter minimum temperature has increased by 0.54ºC/decade (Figure 2). T-test for these trends indicates that the statistical significance of these trends exceed 95%. In contrast, the increasing magnitudes of meteorological summer (June-August) maximum and minimum temperatures are very small and the trends are not significant statistically.
Diurnally, change rates are greater in nighttime extreme temperature than in daytime extreme temperatures in both winter and summer.
Analyses of regional average extreme
Figure 2. Changes in meteorological summer (June-August) and winter (December-February) maximum (Tmax) and minimum (Tmin) temperatures averaged across 61 weather stations in the Republic of Korea over the
1973-2007 period *: significant at 95% level
(℃) (℃)
temperature indices derived from daily maximum or minimum temperatures averaged across 61 weather stations demonstrate that daytime extreme temperature events as well as nighttime extreme temperature events have changed significantly over the study period as summarized in Table 3. For instance, annual frequency of warm days, when daily maximum temperature exceeds the upper 10th percentile threshold of long-term data, has increased by 6.8 days/decade.
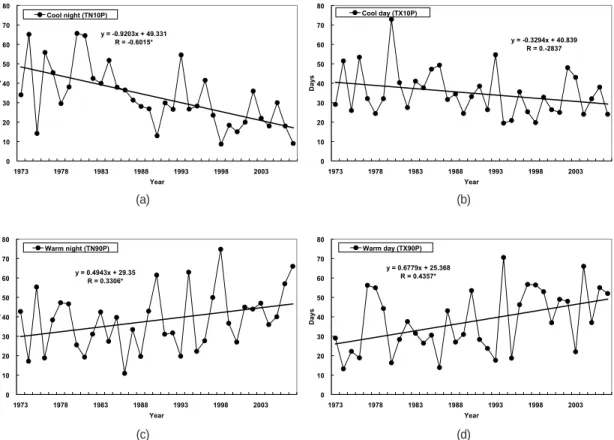
Among 20 indices, the largest magnitude of changes with the highest significance is observed in the annual frequency of cool nights. Over the study period, the annual frequency of cool nights has decreased by -9.2 days/decade, while that of warm nights have increased by 4.9 days/decade (Figure 3). According to the Kendall’s tau test, these change rates are statistically significant at 95% level. The sign of changes in cool days is consistent with that for cool nights, but the magnitude of changes is less than the half of
changes in cool nights. These indicate that change rates in winter nighttime events are greater than those in winter daytime events, resulting in asymmetric patterns diurnally.
Seasonally, the change rates of these percentile- based extreme temperature indices also show asymmetries between winter and summer. For instance, decrease rates of winter cool days and nights are greater than increase rates of summer warm days and nights. In meteorological winter, cool nights and days have decreased by -3.7 days/decade and by -3.0 days/decade, respectively (not given). To the contrary, in meteorological summer, warm nights and days have increased by 1.0 days/decade and by 0.9 days/decade, respectively. The decrease rates of winter cool days and nights are greater than increase rates of summer warm days and nights at a factor of 3.3-3.7.
Spatial maps based on trends at 61 individual weather stations demonstrate that the sign of
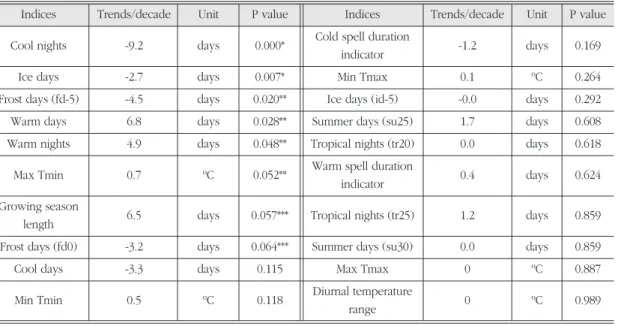
Table 3. Linear trends of annual extreme temperature indices derived from daily maximum and minimum temperatures averaged across 61 weather stations in the Republic of Korea over the 1973-2007 period. P values are calculated from the
Kendall’s tau test.
Indices Trends/decade Unit P value Indices Trends/decade Unit P value Cool nights -9.2 days 0.000* Cold spell duration
-1.2 days 0.169
indicator
Ice days -2.7 days 0.007* Min Tmax 0.1 ºC 0.264
Frost days (fd-5) -4.5 days 0.020** Ice days (id-5) -0.0 days 0.292
Warm days 6.8 days 0.028** Summer days (su25) 1.7 days 0.608
Warm nights 4.9 days 0.048** Tropical nights (tr20) 0.0 days 0.618
Max Tmin 0.7 ºC 0.052** Warm spell duration
0.4 days 0.624
indicator Growing season
6.5 days 0.057*** Tropical nights (tr25) 1.2 days 0.859 length
Frost days (fd0) -3.2 days 0.064*** Summer days (su30) 0.0 days 0.859
Cool days -3.3 days 0.115 Max Tmax 0 ºC 0.887
Min Tmin 0.5 ºC 0.118 Diurnal temperature
0 ºC 0.989
range
*: significant at 99% level, **: significant at 95% level, ***: significant at 90% level
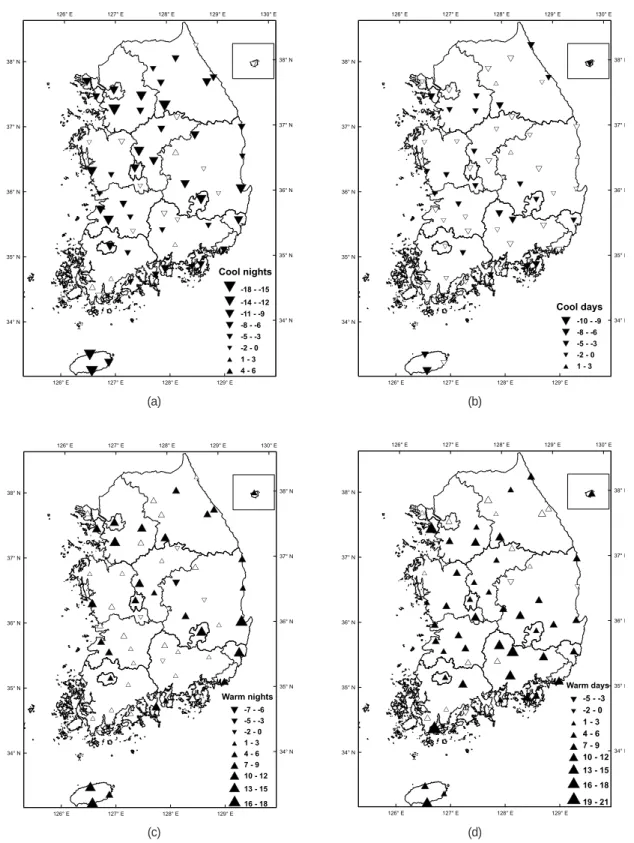
changes in extreme temperature events are spatially coherent, but the magnitude and statistical significance level of these changes vary spatially (Figure 4). The annual frequency of cool nights (warm days) shows statistically-significant decreasing (increasing) trends at more than two thirds of 61 weather stations regardless of urbanization, and there have been no obvious differences of trends between large cities and neighboring regions. Similarly, warm nights (cool days) show significant increasing (decreasing) trends at approximately 50% of the 61 weather stations. Insignificant trends also show coherent signs with other significant trends except for several stations including Mungyeong. The
statistically-significant reduction of cool nights has occurred across 61 weather stations, while the decreases of cool days are observed mostly in the western regions of the Korean Peninsula. In particular, more than 12 days/decade of reductions of cool nights are observed along the Suwon-Wonju corridor, the Pohang-Daegu-Ulsan triangle region, and on Jeju Island. In contrast, 8 or more days/decade of reduction of cool days are observed in Ganghwa and Seogwipo. The differences of the increasing rate of warm days between urban areas and their surroundings are not clear, but warm nights show greater increasing trends in industrialized regions including Pohang and Ulsan. 16 or more
Figure 3. Changes in the annual frequency of cool nights (a), cool days (b), warm nights (c), and warm days (d) derived from daily maximum and minimum temperatures averaged across 61 weather stations in the Republic of Korea over the
1973-2007 period *: significant at 95% level
(a) (b)
(c) (d)
Figure 4. Spatial patterns of linear trends (days/decade) in the annual frequency of cool nights (a), cool days (b), warm nights (c), and warm days (d) at 61 weather stations in the Republic of Korea over the 1973-2007 period
(a) (b)
(c) (d)
days/decade of increases of warm days are observed in Incheon, Wando, and Hapcheon, while 13 or more days/decade of increasing rate of warm nights are observed in the Daegu- Pohang-Ulsan triangle area, the Suwon-Seoul corridor, and Jeju Island.
Threshold-based low temperature events including frost days have reduced at the rate of 3- 5 days/decade, indicating the decreases of nighttime minimum temperature during the beginning and end periods of winter. This is a consistent pattern with increases of growing season length by 6.5 days/decade, which may be associated with the abbreviating trends of thermal winter duration over the 20th century (Choi and Kwon, 2001; Choi et al., 2006). In contrast, neither cold nor warm spell duration indicators show significant changes. Similarly, threshold- based hot temperature events including tropical nights and summer days do not show significant changes on regional scales. Diurnal temperature
range averaged across the study region also does not show any statistically-significant trend.
In previous studies (Choi and Kwon, 2001, 2008), it has been documented that significant increases in surface air temperature have occurred in the late 1980s across the Republic of Korea. Thus, 15 year average daily maximum temperature against daily minimum temperatures averaged across 61 weather stations in the Republic of Korea is compared between the pre- 1988 (1973-1987) and the post-1987 (1988-2002) periods (Figure 5). The diagram in Figure 5 illustrates that the increasing rate of daily minimum temperature is greater than that of daily maximum temperature when daily maximum temperature ranges between 20ºC and 27ºC. In contrast, the increasing rate of daily maximum temperature above 27ºC is greater than that of daily minimum temperature. Between the two periods, lower daily maximum and minimum temperatures have been noticeably reduced. Less
Figure 5. A comparison of intrannaul cycles of pentad running mean daily maximum (Tmax) against pentad running mean minimum (Tmin) temperatures in the Republic of Korea between the pre-1988 period (1973-1987) and the post-1987 period (1988-2007)
(℃)
(℃)
than 4ºC of daily maximum temperature as well as less than -6ºC of daily minimum temperature averaged across 61 weather stations have disappeared in the latter period. On the other hand, there is no identifiable difference in higher extreme temperatures between the two periods.
As aforementioned, seasonally changes in extreme temperature events are greater in winter than in summer, and diurnally nighttime events
shows more noticeable changes. On the other hand, the sensitivity of extreme temperature events related to changes in temperature means is seasonally reversed. As displayed in Figure 6, the increasing rates of summer extreme temperature events relative to increases of summer (June- August) extreme temperature means are greater than those of winter ones. The increasing rate of summer warm nights relative to increases of Figure 6. Change rate (days/°C) of seasonal extreme temperature events in response to changes in seasonal maximum
(Tmax) and minimum (Tmin) temperature means in the Republic of Korea, 1973-2007
*: significant at 95% level (a)
(b)
(℃)
(℃)
summer minimum temperature corresponds to 8.0 days/ºC. The increasing rate of summer warm days relative to increases of summer maximum temperature is 6.6 days/ºC. Comparatively, the decreasing rate of winter (December-February) cool nights relative to increases in winter minimum temperature is -5.2 days/ºC, and the decreasing rate of winter cool days relative to changes in winter maximum temperature is -4.3 days/ºC. Diurnally the decreasing rates of winter cool nights as well as increasing rates of summer warm night relative to increases of winter
maximum and minimum temperatures are greater than the sensitivities of daytime events in both seasons. These results indicate that the sensitivity of extreme temperature events relative to changes in temperature means is asymmetric seasonally and diurnally.
2) Changes in precipitation means and extreme events, 1973-2007
Since the early 1970s, annual total precipitation amount averaged across 61 weather stations in
Figure 7. Changes in annual total precipitation (a), annual total precipitation of extreme wet days above the 99thpercentile value (b) derived from daily precipitation data averaged across 61 weather stations in the Republic of Korea over the 1973-
2007 period *: significant at 95% level (a)
(b)
the Republic of Korea has increased by 85.5mm/decade (Figure 7a). The increase in annual total precipitation is primarily attributed to the increases in heavy rainfall events. The contribution of heavy rainfall to the increases of annual total precipitation can be observed in a comparison of precipitation values with the same percentile between the former (1973-1987) and latter (1988-2002) 15 year periods. As shown in Figure 8, the intensity of heavy rainfall above 40mm has increased by 29% in the latter period compared to that during the former period, while there is little noticeable difference in 40mm or less of precipitation events between the two periods. Heavy rainfall events with 40mm correspond to approximately the extremely wet days above the 99th percentile of long-term average daily precipitation during a year. Time series of extreme precipitation events also illustrate that these changes are associated with
noticeable increases of heavy rainfalls, particularly since the late 1990s (Figure 7b). The cumulative amount of precipitation on extremely wet days above the 99thpercentile values has increased by 36.1mm/decade over the 1973-2007 period. The change rate in the extremely wet day precipitation above the 99th percentile values accounts for 40% of increases of annual total precipitation. These results indicate that increases of annual total precipitation are mainly attributable to the intensification of heavy rainfall events.
To characterize the seasonality of the increase of total annual precipitation, the linear trends and statistical significance levels of each monthly total precipitation averaged across 61 weather stations are calculated (Figure 9). According to these monthly trend analyses, total precipitation in late summer or early fall has significantly increased at the rate of more than 20mm/decade, while there
Figure 8. A comparison of daily precipitation with the same percentile between the pre-1988 (1973-1987) and post-1987 (1988-2002) periods in the Republic of Korea. Solid line with open (filled) circles illustrates the linear trend for precipitation
events less than (above) 40mm.
Figure 9. Linear trends (mm/decade) of monthly total precipitation averaged across 61 weather stations in the Republic of Korea over the 1973-2007 period. Gray (black) bar indicates the linear trend with 90% (95%) significant level.
Figure 10. A comparison of intraannual variations of pentad running mean daily precipitation between post-1987 (1973- 1987) and pre-1988 (1988-2007) periods in the Republic of Korea
have been no significant changes in other monthly precipitation. In particular, monthly total precipitation in August has most significantly increased by 36mm/decade. T-test indicates that the trend is statistically significant at more than 95% level. The monthly total precipitation in July has also increased by 30mm/decade.
To examine changes in extreme precipitation events at the daily scale, the time series of pentad running mean daily precipitation between the former (1973-1987) and later (1988-2002) 15 year periods are compared (Figure 10). The comparison demonstrates that increases of daily precipitation are observable in the Changma period. The post-1987 minus pre-1988 pentad mean precipitation shows several positive departure crests between early July and mid- September. These changes led to the modification
of the conventional bimodal distribution of summer precipitation, which had been usually formed by the discontinuation between summer Changma and late Changma. In the post-1987 period, the bimodal patterns have been fragmented into multi-modal crests with less magnitude. These fragmented smaller peaks of precipitation in the later rainy period make it more difficult to predict the summer Changma offsets in recent decades. The rainy period with 5mm or more of pentad running mean precipitation has been also extended in late summer due to a delay of its offset from early September to mid-September.
Spatial patterns of changes in extreme precipitation events are different from those in extreme temperature events. The number of weather stations with significant trends of Figure 11. Spatial patterns of linear trends (mm/decade) in annual total precipitation of very wet days (a) and extremely wet
days (b) over the 1973-2007 period at 61 weather stations in the Republic of Korea
(a) (b)
extreme precipitation events is much smaller than that of extreme temperature events, but the weather stations with these significant trends are spatially clustered (Figure 11). Significant trends of heavy rainfall events such as annual total precipitation of very wet days which exceed the long-term (1973-2000) average 95th percentile values, are observed at one third of weather stations. Significant trends of annual total very wet day precipitation, are mainly observed around the Taebaek mountain regions, eastern coastal areas, and central Geyonggi province including Seoul. Similarly, significant trends of annual total extremely wet day precipitation, which corresponds to heavy rainfall events exceeding the 99th percentile values, appear around the Taebaek mountain region as well as Uleung Island. In particular, more than 120mm/decade of increasing trends of annual total very wet day precipitation are observed at
Daegwallryeong, Seoul, Uleung Island, and Seongsanpo. More than 80mm/decades of increasing trends of annual total extremely wet day precipitation are observed at Daegwallryeong, Hongcheon, and Uleung Island.
The increasing patterns of heavy rainfall day precipitation around the mountainous regions imply that topography may play an important role in changing heavy precipitation events in Korea. In reality, additional analyses show that the positive anomaly of the precipitable water is observed in the southern China (not given), but further analyses are needed to fully understand the mechanism of how the increasing transport of precipitable water interacts with the topography in Korea.
Changes in extreme precipitation events are also detected in the time series of many other extreme precipitation indices as summarized in Table 4. The number of 10mm and 20mm Table 4. Linear trends of extreme precipitation indices derived from daily precipitation averaged across 61 weather stations
in the Republic of Korea over the 1973-2007 period. P values are calculated from the Kendall’s tau test.
Indices Trends/decade Unit P value Indices Trends/decade Unit P value
Consecutive wet Annual total
days 1.4 days 0.015** precipitation of 57.6 mm 0.037**
very wet days Max 5-day
Number of 10mm
precipitation 16.2 mm 0.021**
precipitation days 2.6 days 0.046**
amount Simple daily
0.6 mm 0.027** Annual total wet-day
85.5 mm 0.059***
intensity index precipitation
Annul total precipitation of
36.1 mm 0.030** Number of 20mm
1.8 days 0.090***
extremely wet precipitation days
days
Number of 30mm
0.8 days 0.272
Max 1-day
9.3 mm 0.032** precipitation days
precipitation Consecutive dry days 0.5 days 0.679
amount
*: significant at 99% level, **: significant at 95% level, ***: significant at 90% level
precipitation days averaged across 61 weather stations has increased by 2.6 days/decade and 1.8 days/decade, respectively. Similarly, monthly maximum 5-day precipitation amount has increased by 16.2mm/decade, and monthly maximum 1-day precipitation amount has increased by 9.3mm/decade. In terms of the durations of extreme precipitation events, consecutive wet days, which is defined as a maximum number of consecutive days with sizable precipitation equal to or above 1mm, has increased by 1.4 days/decade, but there have been no significant changes in consecutive dry days over the study period. These results confirm that there have been significant changes in extreme precipitation events in the Republic of Korea in terms of their frequency, intensity, and duration as well as annual totals. It is speculated that the changes in seasonal total precipitation may be associated with changes in seasonal average extreme temperatures. As illustrated in Figure 12, the increasing trend of summer total
precipitation primarily due to the increase of extreme precipitation events might subdue the increase in summer maximum temperature as a cooling mechanism, while winter average minimum temperature has increased significantly because there has been no noticeable change in winter total precipitation.
4. Summary and Conclusions
This study provides comprehensive information about the spatial and temporal patterns of changes in means and extreme events of temperature and precipitation in the Republic of Korea over the recent 35 years (1973-2007). Daily maximum and minimum temperature data as well as daily precipitation data observed at 61 weather stations are used to construct time series data sets of 20 extreme temperature indices as well as 11 extreme precipitation indices. Major findings are
Figure 12. Relationships between changes in seasonal average extreme temperature and seasonal total precipitation in the Republic of Korea over the 1973-2007 period. Tmax (Tmin) denotes maximum (minimum) temperature. *: significant at 95% level
summarized as follows:
First, the decreasing trends of cool temperature events as well as increasing trends of warm temperature events have appeared at most of weather stations with spatial coherence. In contrast, significant increasing trends of extreme precipitation events are observed mainly around the Taebaek mountain region.
Second, the reduction rates of annual cool nights (-9.2 days/decade) are greater than those of cool days (-3.3 days/decade). On the contrary, the increasing rates of annual warm days (+6.8 days/decade) are greater than those of warm nights (+4.9 days/decade). Seasonally, the decrease rates of winter cool days and nights are greater than the increase rates of summer warm days and nights. Theses patterns indicate that asymmetric changes in extreme temperature events have occurred diurnally and seasonally.
Third, the change rates in extreme temperature events are greater in winter (nighttime) compared with those in summer (daytime), while the increase rates of summer warm nights (+8.0 days/ºC) and days (+6.6 days/ ºC) relative to changes in summer minimum and maximum temperature means are greater than the decreasing rates of winter nights (-5.2 days/ ºC) and days (-4.3 days/ºC) relative to changes in winter temperatures
Fourth, annual total precipitation has increased by 85.5mm/decade due to intensification of heavy rainfall events during the summer monsoon period. In particular, increases of heavy precipitation above 40mm contributed mostly to the increases of annual total precipitation.
Temporally, significant increases of heavy precipitation in July and August have modified the typical distribution of summer rainfalls from a bimodal structure to a multi-modal pattern, delaying the rainy period in early September.
The information on current changes in climate means and extreme events across the Republic of
Korea summarized in this study may be useful to develop warning systems as well as mitigation strategies for extreme climate events. In particular, the spatial distribution maps of changes in extreme climate events provide the key information on where we should keep more our eyes on in order to mitigate the potential damages due to the extreme climate events. In future studies, comparisons of these findings with results from other neighboring countries should be made to understand the spatial coherency of changes in extreme climate events in northeast Asia. Furthermore, the prediction of changes in extreme climate events in the 21st century could be made based on high resolution climate scenario data simulated by sophisticated regional climate models as well as on examinations of linkages between extreme climate events and atmospheric circulation.
Acknowledgement
The authors are very much grateful to the National Institute of Meteorological Research at the Korea Meteorological Administration for the financial support (metri-2008-B-5) as well as the offering of climate data.
References
Alexander, L. V., Zhang, X., Peterson, T. C., Caesar, J., Gleason, B., Klein Tank, A. M. G., Haylock, M., Collins, D., Trewin, B., Rahimzadeh, F., Tagipour, A., Rupa Kumar, K., Revadekar, J., Riffiths, G., Vincent, L., Stephenson, D. B., Burn, J., Aguilar, E., Brunet, M., Taylor, M., New, M., Zhai, P., Rusticucci, M., and Vazquez-Aguirre, J.
L., 2006, Global observed changes in daily climate extremes of temperature and precipitation, Journal of Geophysical Research,
111, 1-22.
Choi, G. and Kwon, W. T., 2001, Shift of natural seasons’
cycle and change of life temperature indices in South Korea during the 20th century, Journal of Geography Education, 45, 14-25.
Choi, G. and Kwon, W. T., 2008, Current and future changes in the type of wintertime precipitation in South Korea, Journal of the Korean Geographical Society, 43, 1-19.
Choi, G., Kwon, W. T., and Robinson, D. A., 2006, Seasonal onset and duration in South Korea, Journal of the Korean Geographical Society, 41, 435-456.
Choi, Y., 2004, Trends on temperature and precipitation extreme events in Korea, Journal of the Korean Geographical Society, 39, 711-721.
Frich, P., Alexander, L. V., Della-Marta, P., Gleason, B., Haylock, M., Klein Tank, A. M. G., and Peterson, T., 2002, Observed coherent changes in climatic extremes during the second half of the twentieth century, Climate Research, 19, 193-212.
Griffiths, G. M., Chambers, L. E., Haylock, M. R., Manton, M. J., Nicholls, N., Baek, H.-J., Choi, Y., Della- Marta, P. M., Gosai, A., Iga, N., Lata, R., Laurent, V., Maitrepierre, L., Nakamigawa, H., Ouprasitwong, N., Solofa, D., Tahani, L., Thuy, D. T., Tibig, L., Trewin, B., Vediapan, K., and Zhai, P., 2005, Change in mean temperature as a predictor of extreme temperature change in the Asia-Pacific region, International Journal of Climatology, 25, 1301-1330.
IPCC (Intergovernmental Panel on Climate Change), 2007, Climate Change 2007: The Physical Science Basis. Contribution of Working Group I to the Fourth Assessment Report of the Intergovernmental Panel on Climate Change [Solomon, S., Qin, D. Manning, M. Chen, Z., Marquis, M., Averyt, K. B., Tignor, M., and Miller, H. L.(eds.)], Cambridge University Press, Cambridge, United Kingdom and New York, NY, USA.
Klein Tank, A. M. G. and Können, G. P., 2003, Trends indices of daily temperature and precipitation extremes in Europe, 1946-99, Journal of Climate, 16, 3665-3680.
Klein Tank, A. M. G., Peterson, T. C., Quadir, D. A., Dorji, S., Xukai, Z., Hongyu, T., Santhosh, K., Joshi, U. R., Jaswal, A. K., Kolli, R. K., Sikder, A., Deshpande, N. R., Revadekar, J., Yeleuova, K., Vandasheva, S., Faleyeva, M., Gomboluudev, P., Budhathoki, K. P., Hussain, A., Afzaal, M., Chandrapala, L., Anvar, H., Amanmurad, D., Asanova, V. S., Jones, P. D., New, M. G., and Spektorman, T., 2006, Changes in daily temperature and precipitation extremes in Central and South Asia, Journal of Geophysical Research, 111, D16105, doi:10.1029/2005JD00 6316.
Manton, M. J., Della-Marta, P. M., Haylock, M. R., Hennessy, K. J., Nicholls, N., Chambers, L. E., Collins, D. A., Daw, G., Finet, A., Gunawan, D., Inape, K., Isobe, H., Kestin, T. S., Lefale, P., Leyu, C. H., Lwin, T., Maitrepierre, L., Ouprasitwong, N., Page, C. M., Pahalad, J., Plummer, N., Salinger, M. J., Suppiah, R., Tran, V. L., Trewin, B., Tibig, I., and Yee, D., 2001, Trends in extreme daily rainfall and temperature in southeast Asia and the South Pacific: 1961- 1998, International Journal of Climatology, 21, 269-284.
Meehl, G. A. and Tebaldi, C., 2004, More intense, more frequent, and longer lasting heat waves in the 21stcentury, Science, 305, 994-997.
Moberg, A. and Jones, P. D., 2005, Trends in indices for extremes in daily temperature and precipitation in central and western Europe, 1901-99, International Journal of Climatology, 25, 1149- 1171.
New, M., Hewitson, B., Stephenson, D., Tsiga, A., Kruger, A., Manhique, A., Gomez, B., Coelho, C.
A. S., Masisi, D. N., Kululanga, E., Mbambalala, E., Adesina, F., Saleh, H., Kanyanga, J., Adosi, J., Bulane, L., Fortunata, L., Mdoka, M. L., and Lajoie, R., 2006, Evidence of trends in daily climate extremes over Southern and West Africa, Journal of Geophysical Research, 111, D14102, doi:10.1029/2005JD006289
Peterson, T. C., Taylor, M. A., Demeritte, R., Duncombe, D. L., Burton, S., Thompson, F., Porter, A., Mercedes, M., Villegas, E., Fils, R. S., Klein Tank,
A. M. G., Martis, A., Warner, R., Joyette, A., Mills, W., Alexander, L., and Gleason, B., 2002, Recent changes in climate extremes in the Caribbean region, Journal of Geophysical Research, 107 (D21), 4601, doi: 10.1029/2002JD002251.
Press, W. H., Flannery, B. P., Teukolsky, S. A., and Vetterling, W. T., 1986, Numerical Recipes: The Art of Scientific Computing, Cambridge University Press, Cambridge.
Ryoo, S. B. and Kim, Y. H., 2007, Inhomogeneities in Korean climate data (II): Due to the changes of the computing procedure of daily mean, Atmosphere, 17, 17-26.
Ryoo, S. B., Kim, Y. H., Kwon, T. H., and Park, I. S., 2006, Inhomogeneities in Korean climate data (I): Due to site relocation, Atmosphere, 16, 215- 223.
Vincent, L. A., Peterson, T. C., Barros, V. R., Marino, M.
B., Rusticucci, M., Carrasco, G., Ramirez, E., Alves, L. M., Ambrizzi, T., Berlato, M. A., Grimm, A. M., Marengo, J. A., Molion, L., Moncunill, D.
F., Rebello, E., Anunciação, Y. M. T., Quintana, J., Santos, J. L., Baez, J., Coronel, G., Garcia, J., Trebejo, I., Bidegain, M., Haylock, M. R., and Karoly, D., 2005, Observed trends in indices of daily temperature extremes in South America:
1960-2000, Journal of Climate, 18, 5011-5023.
Zhang, X. and Yang, F., 2004, RClimDex (1.0) User Manual.
http://www.r-project.org/
Correspondence:Gwangyong Choi, Climate Research Laboratory, National Institute of Meteorological Research, Korea Meteorological Administration, 460- 18, Shindaebang-dong, Dongjak-gu, 156-720, Seoul, Republic of Korea (e-mail: [email protected], phone: 02-6712-0316)
교신: 최광용, 156-720 서울특별시 동작구 신대방동 460-18 기 상 청 국 립 기 상 연 구 소 기 후 연 구 과 (이 메 일 : [email protected], 전화:02-6712-0316)
Recieved June 26, 2008 Accepted December 10, 2008