ABSTRACT
Purpose: Nutrition screening is vital to ensure patients are appropriately managed in hospital. In paediatrics there is currently no universally accepted nutrition screening tool.
The Nutrition Evaluation Screening Tool (NEST) was developed as an easy to use and practical screening tool for hospitalised children. We aim to evaluate compliance of the NEST and assess agreement of the NEST with the already validated nutrition screening tools, Screening Tool for Risk on Nutritional Status and Growth (STRONGkids), Screening Tool for the Assessment of Malnutrition in Paediatrics (STAMP) and the Subjective Global Nutritional Assessment (SGNA) tool.
Methods: Retrospective review of 102 patient episodes at the Evelina London Children's Hospital. Electronic records were used to assess NEST compliance and to complete the nutrition tools for each patient episode. Cohen's kappa was used to determine the level of agreement between each nutrition tool.
Results: There was moderate agreement between the NEST and the two screening tools, STRONGkids (κ=0.472) and STAMP (κ=0.416) for patients on initial screening at admission.
87.2% of patient episodes were NEST compliant within 24 hours of admission to hospital.
Conclusion: The moderate agreement between these two already validated screening tools enhances the NEST's validity as a paediatric screening tool. The NEST had the strongest correlation with the SGNA tool compared to other screening tools. The NEST is user friendly screening tool for hospitalised children.
Keywords: Nutrition assessment; Malnutrition; Nutritional status; Child; Pediatrics
INTRODUCTION
Malnutrition remains a common problem in hospitalised children despite the advances in medical interventions [1]. Suboptimum nutrition can lead to malnutrition which has been associated with increased morbidity, prolonged hospital stay and mortality in critically ill children [2,3]. Nutrition screening to identify at risk hospitalised adults is recommended by the European Society for Clinical Nutrition and Metabolism [4], the American Society for Parenteral and Enteral Nutrition [5] and the United Kingdom (UK) National Institute for Health and Care Excellence [6]. Although it is considered a good practice to screen all hospitalised children upon hospital admission, there is no universally accepted standards for assessment of nutritional
Original Article
Received: Jun 10, 2020 Revised: Jul 25, 2020 Accepted: Aug 17, 2020 Correspondence to Mohamed Mutalib
Department of Paediatric Gastroenterology, Evelina London Children's Hospital, Westminster Bridge Road, London SE1 7EH, UK.
E-mail: [email protected] Copyright © 2021 by The Korean Society of Pediatric Gastroenterology, Hepatology and Nutrition
This is an open-access article distributed under the terms of the Creative Commons Attribution Non-Commercial License (https://
creativecommons.org/licenses/by-nc/4.0/) which permits unrestricted non-commercial use, distribution, and reproduction in any medium, provided the original work is properly cited.
ORCID iDs Kitt Dokal
https://orcid.org/0000-0002-2516-0823 Nadia Asmar
https://orcid.org/0000-0003-0526-0787 Mohamed Mutalib
https://orcid.org/0000-0001-8869-9466 Conflict of Interest
The authors have no financial conflicts of interest.
Kitt Dokal ,1 Nadia Asmar ,1 Rita Shergill-Bonner,2 and Mohamed Mutalib 1,2
1Faculty of Life Science and Medicine, King's College London, London, UK
2Department of Paediatric Gastroenterology, Evelina London Children's Hospital, London, UK
Nutrition Evaluation Screening Tool:
An Easy to Use Screening Tool for
Hospitalised Children
status in children. The World Health Organisation has set up guidance to define both acute and chronic malnutrition in children based on z scores of anthropometric measurements [7].
Nutrition screenings tools are designed to identify those at risk of malnutrition who may benefit from nutritional interventions. Validated nutrition screening tools are associated with improved care and reduced prevalence of nutritional derangement [8]. The UK Department of Health recommends that all adult inpatients are nutritionally screened within 24 hours of admission and paediatric inpatients within 48 hours of hospital admission with similar guidelines exist in other countries.
In paediatrics, there is no consensus on the best nutrition screening tool for hospitalised children [9]. Available paediatric screening tools were designed to achieve different objectives hence poor level of agreement between different tools. All tools were designed to capture at least one of the following: the current nutritional status of the child, the need for nutritional intervention or to predict the clinical outcome if no intervention is undertaken [10]. Some tools utilise weight and height measurement as part of their assessment while other tools rely on questions obtained from parents or healthcare professionals, as a result, most screening tools are intended for use by different groups of healthcare professionals [11].
The majority of paediatric screening tools acknowledge the existing medical conditions as contributing factors to the risk of malnutrition in children but they place different score to different medical conditions which may lead to over or under estimation of nutritional risk [12,13]. In practical terms this may lead to false reassurance or high level of inappropriate referrals to dietitians. None of the existing screening tools offer guidance on children with multiple food allergies and/or enteral feeding tubes, an increasingly large group among hospitalised children whose nutritional requirement can be met based on the individual institutional resources, they may not be at nutritional risk but will require careful catering to accommodate their requirement independent of their acute medical need. The current complex healthcare systems in most countries rely on provision of care in secondary and tertiary settings with variable level of resources and increasingly looking after patients with complex morbidities [14]. They require a practical, simple and standardised screening tool that uses objective measure and produce transferable outcomes.
The Nutritional Evaluation Screening Tool (NEST) (Appendix) was developed over a number of years at Evelina London Children' Hospital, a tertiary paediatric hospital in London to provide nutritional assessment and to identify children who require nutritional intervention based on an outcome score. The tool was designed to be used by nurses or healthcare assistants with minimum training. It also provides practical sign postings for children with multiple food allergies and different types of feeding tubes.
We aim to assess the level of agreement between NEST and three validated paediatric screening tools and to ascertain the level of agreement between the three tools. We included Screening Tool for Risk on Nutritional Status and Growth (STRONGkids): A Dutch screening tool found to have good interrater reliability and accessibility, that uses subjective clinical impression [15], Screening Tool for the Assessment of Malnutrition in Paediatrics (STAMP) was developed in the UK [16], like the STRONGkids is noted for its high sensitivity and ease of use in clinical practice and The Subjective Global Nutritional Assessment (SGNA) [17] which uses nutritional history and physical examination in surgical care, and has been used to assess the concurrent validity of some of the published paediatric nutrition screening tools.
MATERIALS AND METHODS
The project was registered with the hospital clinical governance board as an audit project to review clinical practice. Approval number 10092.
A retrospective data collection for children admitted to Evelina London Children' Hospital between September to December 2019. Two of the authors (KD and NA) independently competed the four screening tools (NEST, STRONGkids, STAMP, and SGNA) for included children within 24 hours of admission and subsequently every week while the child was in hospital for the duration of the study. Data was collected from electronic medical records and children with incomplete data were excluded.
The cohort was divided into three categories: initial screening (Group 1); those who had at least one follow up nutritional screening over the project period (Group 2) and a third category comprising Group 1 and Group 2 together (Group 3).
Statistical analysis and level of agreements between the screening tools were assessed with Cohen's Kappa analysis of agreement [18] using IBM SPSS Statistics for Windows, Version 25.0 (IBM Co., Armonk, NY, USA). Standard error and p-values (value<0.05 was considered statistically significant) were obtained and 95% confidence intervals (CI) of Kappa value (κ) were calculated. The levels of agreement were interpreted from the κ.
RESULTS
A total of 102 patient episodes were collected from 76 patients, 33 (43.4%) were females and 43 (56.6%) were males. Mean±SD age was 6±5.5 years (Table 1). The NEST was completed by the medical staff in 89/102 (87.2%) episodes within 24 hours of admission or once every week since admission. Of the 13 not completed, 5/13 (38.5%) did not have a single NEST episode completed. The remaining 8/13 (61.5%), patients had the NEST completed but not within recommended time frame. After assessing compliance, the 102 episodes were screened with the NEST, STRONGkids, and STAMP. A 98 viable episodes were screened with the SGNA as 4 episodes had incomplete data.
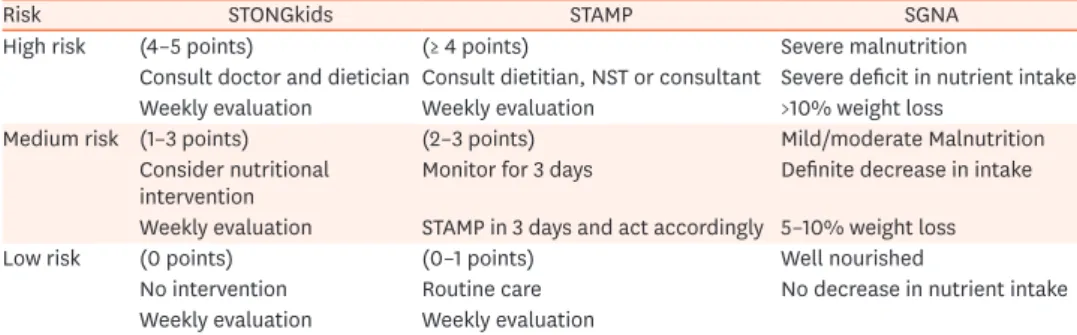
Table 2 shows the definitions and nutrition outcomes of STRONGkids, STAMP and SGNA.
Table 1. Background diagnosis and demographic data
Parameter Value
Number of children 76
Male:female 33 (43.4):43 (56.6)
Mean age (yr) 6.0±5.5
Diagnosis
Surgery 15 (19.7)
Neurology 11 (14.5)
Renal 8 (10.5)
Ear, nose and throat 7 (9.2)
Metabolic 1 (1.3)
General 24 (31.6)
Gastroenterology 8 (10.5)
Cardiology 2 (2.6)
Values are presented as number only, number (%), or mean±standard deviation.
Group 1 (screened on admission)
Patients screened on admission (N=76), were assessed using the four nutrition screening tools (Table 3). Agreement was compared between the NEST, STRONGkids, STAMP and SGNA. The NEST showed moderate agreement, κ=0.472 (95% CI, 0.307–0.633), p<0.005 and moderate agreement κ=0.416 (95% CI, 0.251–0.580), p<0.005 with the STRONGkids and STAMP, respectively (Table 3D). There was fair agreement between NEST and SGNA k=0.30 (95% CI, 0.138 to 0.464), p<0.005.
STRONGkids and STAMP showed fair agreement, κ=0.371 (95% CI, 0.208–0.534), p<0.005.
STRONGkids and SGNA showed slight agreement κ=0.179 (95% CI, 0.034–0.324), p<0.05. Finally STAMP and SGNA showed fair agreement κ=0.218 (95% CI, 0.079–0.357), p<0.005 (Table 3).
Table 2. Nutrition outcome for the included screening tools
Risk STONGkids STAMP SGNA
High risk (4–5 points) (≥ 4 points) Severe malnutrition
Consult doctor and dietician Consult dietitian, NST or consultant Severe deficit in nutrient intake Weekly evaluation Weekly evaluation >10% weight loss
Medium risk (1–3 points) (2–3 points) Mild/moderate Malnutrition
Consider nutritional
intervention Monitor for 3 days Definite decrease in intake
Weekly evaluation STAMP in 3 days and act accordingly 5–10% weight loss
Low risk (0 points) (0–1 points) Well nourished
No intervention Routine care No decrease in nutrient intake
Weekly evaluation Weekly evaluation
STRONGkids: Screening Tool for Risk on Nutritional Status and Growth, STAMP: Screening Tool for the Assessment of Malnutrition in Paediatrics, SGNA: Subjective Global Nutritional Assessment, NST, nutrition support team.
Table 3. NEST (A)
NEST STRONGkids Total
Low risk Medium risk High risk
Low risk 26 13 1 40
Medium risk 3 19 1 23
High risk 1 6 6 13
Total 30 38 8 76
(B)
NEST STAMP Total
Low risk Medium risk High risk
Low risk 27 11 2 40
Medium risk 4 13 6 23
High risk 1 4 8 13
Total 32 28 16 76
(C)
NEST SGNA Total
Normal Moderate Severe
Low risk 35 2 0 37
Medium risk 14 8 1 23
High risk 5 6 2 13
Total 54 16 3 73
(D)
Nutrition tool Group 1: agreement with the NEST
Kappa (κ) N=episodes p-value Standard error Confidence interval
STRONGkids 0.472 76 <0.005 0.082 0.311–0.633
STAMP 0.416 76 <0.005 0.084 0.251–0.580
SGNA 0.301 73 <0.005 0.083 0.138–0.464
STRONGkids: Screening Tool for Risk on Nutritional Status and Growth, STAMP: Screening Tool for the Assessment of Malnutrition in Paediatrics, SGNA: Subjective Global Nutritional Assessment, NEST: Nutrition Evaluation Screening Tool.
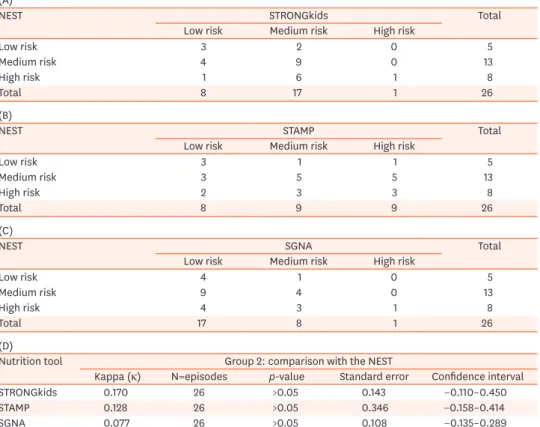
Group 2 (follow-up)
Children who remained in the hospital for more than one week formed Group 2 (N=26).
There was slight agreement between NEST and STRONGkids κ=0.170 (95% CI, −0.110–
0.450), p=0.172. Slight agreement between NEST and STAMP κ=0.128 (95% CI, −0.158–
0.414), p=0.346 and slight agreement between NEST and SGNA κ=0.077 (95% CI, −0.135–
0.289), p=0.458.
Agreement between the STRONGkids and STAMP was slight κ=0.191 (95% CI, −0.044–
0.426), p=0.101. SGNA agreement with the STRONGkids and STAMP was κ=0.226 (95% CI,
−0.025–0.477), p=0.106 and κ=0.207 (95% CI, −0.020–0.434), p=0.069 respectively (Table 4).
Group 3 (initial episodes and follow-up combined)
Group 1 and 2 were combined to form Group 3, with total number of episodes, N=102 (Table 5).
The STRONGkids and the STAMP level of agreement with the NEST were κ=0.391 (95% CI, 0.242–0.540), p<0.005 fair agreement and, κ=0.439 (95% CI, 0.295–0.582), p<0.005 moderate agreement, respectively. NEST and SGNA showed slight agreement κ=0.188 (95% CI, 0.061–
0.315), p<0.005.
There was fair agreement between STRONGkids and STAMP, κ=0.309 (95% CI, 0.160–0.458), p<0.005. When comparing the SGNA with the STRONGkids and STAMP the agreement was slight, κ=0.170 (95% CI, 0.043–0.297), p<0.05 and, κ=0.133 (95% CI, 0.021–0.245), p<0.05 respectively (Table 5).
Table 4. NEST (A)
NEST STRONGkids Total
Low risk Medium risk High risk
Low risk 3 2 0 5
Medium risk 4 9 0 13
High risk 1 6 1 8
Total 8 17 1 26
(B)
NEST STAMP Total
Low risk Medium risk High risk
Low risk 3 1 1 5
Medium risk 3 5 5 13
High risk 2 3 3 8
Total 8 9 9 26
(C)
NEST SGNA Total
Low risk Medium risk High risk
Low risk 4 1 0 5
Medium risk 9 4 0 13
High risk 4 3 1 8
Total 17 8 1 26
(D)
Nutrition tool Group 2: comparison with the NEST
Kappa (κ) N=episodes p-value Standard error Confidence interval
STRONGkids 0.170 26 >0.05 0.143 −0.110–0.450
STAMP 0.128 26 >0.05 0.346 −0.158–0.414
SGNA 0.077 26 >0.05 0.108 −0.135–0.289
STRONGkids: Screening Tool for Risk on Nutritional Status and Growth, STAMP: Screening Tool for the Assessment of Malnutrition in Paediatrics, SGNA: Subjective Global Nutritional Assessment, NEST: Nutrition Evaluation Screening Tool.
DISCUSSION
The widely accepted definition for paediatric malnutrition is the negative balance between nutrition intake and the child requirement leading to protein, energy or micronutrients deficiency that may adversely impact on growth and development [7]. The risk of acute and chronic malnutrition in hospitalised children is high with reported prevalence between 24–50% [19,20]. A significant number of children develop undernutrition during hospital stay with increasing morbidity and mortality burden [2,3,21,22]. To capture at risk population, an effective nutrition screening tool will enable early detection and stratification of children at risk of nutritional deficiencies. The “ideal” screening tool should be simple, practical with clear outcomes that linked to action plan and is reproducible across different healthcare settings [23].
There are numerous paediatric nutrition screening tools that utilise different parameters to address various clinical settings but there is no single tool that is universally acknowledged.
Anthropometric measurements alone are less reliable in certain conditions like severe neurodisabilities were accurate measurements are difficult and surrogate measurement are [24,25] used or in children prone to oedema and fluid shift [26]. Short term assessment of oral intake will over/under estimate children with long term conditions that limit their intake and may not address clinical scenarios with increasing energy requirement or expenditure [27].
Also, most published paediatric screening tools do not take into account certain practical aspect such as enteral tube feedings and multiple food allergies. In busy and complex clinical settings, the tool of choice should combine the risk stratification aspect and the ability to utilise local resources (such as feeds and kitchen units) without extra burden on dietetic Table 5. NEST
(A)
NEST STRONGkids Total
Low risk Medium risk High risk
Low risk 29 15 1 45
Medium risk 10 25 1 36
High risk 2 10 9 21
Total 41 50 11 102
(B)
NEST STAMP Total
Low risk Medium risk High risk
Low risk 30 13 2 45
Medium risk 5 23 8 36
High risk 2 7 12 21
Total 37 43 22 102
(C)
NEST SGNA Total
Normal Moderate Severe
Low risk 38 3 0 41
Medium risk 27 8 1 36
High risk 7 10 4 21
Total 72 21 5 98
(D)
Nutrition tool Group 3: agreement with the NEST
Kappa (κ) N=episodes p-value Standard error Confidence interval
STRONGkids 0.391 102 <0.005 0.076 0.242–0.540
STAMP 0.439 102 <0.005 0.073 0.296–0.582
SGNA 0.188 98 <0.005 0.065 0.061–0.315
teams. The NEST was developed with these concepts in mind and is in clinical use at Evelina London Children's Hospital for the last few years. Of the children included in this cohort, 87.2% were found to have NEST completed within the recommended guidelines.
In the first group of this cohort, 76 children were screened on admission to hospital. NEST showed moderate agreement with STRONGkids (κ=0.472, 95% CI, 0.307–0.633; p<0.005) and STAMP (κ=0.416, 95% CI, 0.251–0.580; p<0.005) but a fair agreement with SGNA (k=0.30, 95%
CI, 0.138–0.464; p<0.005). It is generally acceptable that SGNA is a more comprehensive tool, requires certain level of training and is not practical as a simple screening tool for all children.
Interestingly there were fair agreement between STAMP and STRONGkids, fair agreement between STRONGkids and SGNA but only slight agreement between STAMP and SGNA.
Previous studies reported variable levels of agreements between different screening tools but there were great heterogeneity between the studied populations rendering the results of the previously published data unsuitable for direct comparison [12,28,29].
In the second group, we reviewed the 26 children who stayed in hospital for more than one week to compare the level of agreement between the screening tools. There were slight agreements between all the studied tools (NEST, STRONGkids, STAMPT, and SGNA).
As most of the screening tools were designed for use in the first few days of admission to hospital it is not certain if any of the tools is superior in this setting. Although malnutrition can develop in hospitalised children, there is no agreement on the optimum nutrition tool to screen children during their hospital stay.
We then combined group 1 and 2 to review the whole cohort, there were moderate agreements between NEST and both STRONGkids and STAMP but slight agreement with SGNA while STRONGkids and SATMP showed fair agreement between them, their agreement with SGNA was slight.
Different nutrition screening tools were designed with overlapping but different aims. To establish the nutritional status, to identify the need for intervention, to provide prognosis or prediction of healthcare use are the commonly used themes, however an overreliance on one objective can lead to disjoined outcome [10]. Selection of the appropriate screening tool requires a careful consideration of the purpose of use, clinical validity, ease of use and local implementation process [10,23]. The NEST was developed as a practical, easy to use tool to establish the nutritional status, identify the need for intervention and adjusted to its current status to ensure high uptake.
In conclusion, NEST is an easy to use and practical nutrition screening tool for hospitalised children. It had a moderate level of agreement with other recognised paediatric nutrition screening tools in particular STAMP and STRONGkids and SGNA. It can provide an alternative screening tool when other tools are unsuitable.
This review of practice has number of limitations, it is a retrospective data collection in a heterogeneous group of children but it is common in modern children hospitals to have children with diverse complex medical backgrounds. We did not look at nutritional intervention and clinical outcomes but we compared NEST to other validated paediatric nutrition screening tool. In the absence of a universally acknowledged paediatric nutrition screening tool, the challenge of validating paediatric tools will remain.
We would like to acknowledge the contribution of Ms Sophie Hall (paediatric dietitian) to the original design of NEST.
REFERENCES
1. Joosten KF, Zwart H, Hop WC, Hulst JM. National malnutrition screening days in hospitalised children in The Netherlands. Arch Dis Child 2010;95:141-5.
PUBMED | CROSSREF
2. Chen MY, Yang YJ. Being underweight is an independent risk factor for poor outcomes among acutely critically ill children. Nutr Clin Pract 2018;33:433-8.
PUBMED | CROSSREF
3. Hecht C, Weber M, Grote V, Daskalou E, Dell'Era L, Flynn D, et al. Disease associated malnutrition correlates with length of hospital stay in children. Clin Nutr 2015;34:53-9.
PUBMED | CROSSREF
4. Cederholm T, Barazzoni R, Austin P, Ballmer P, Biolo G, Bischoff SC, et al. ESPEN guidelines on definitions and terminology of clinical nutrition. Clin Nutr 2017;36:49-64.
PUBMED | CROSSREF
5. Mueller C, Compher C, Ellen DMAmerican Society for Parenteral and Enteral Nutrition (A.S.P.E.N.) Board of Directors. A.S.P.E.N. clinical guidelines: nutrition screening, assessment, and intervention in adults. JPEN J Parenter Enteral Nutr 2011;35:16-24.
PUBMED | CROSSREF
6. National Institute for Health and Care Excellence (NICE). Nutrition support for adults: oral nutrition support, enteral tube feeding and parenteral nutrition. London: NICE, 2006.
7. Mehta NM, Corkins MR, Lyman B, Malone A, Goday PS, Carney LN, et al. Defining pediatric malnutrition: a paradigm shift toward etiology-related definitions. JPEN J Parenter Enteral Nutr 2013;37:460-81.
PUBMED | CROSSREF
8. Eglseer D, Halfens RJ, Lohrmann C. Is the presence of a validated malnutrition screening tool associated with better nutritional care in hospitalized patients? Nutrition 2017;37:104-11.
PUBMED | CROSSREF
9. Teixeira AF, Viana KD. Nutritional screening in hospitalized pediatric patients: a systematic review. J Pediatr (Rio J) 2016;92:343-52.
PUBMED | CROSSREF
10. Elia M, Stratton RJ. Considerations for screening tool selection and role of predictive and concurrent validity. Curr Opin Clin Nutr Metab Care 2011;14:425-33.
PUBMED | CROSSREF
11. Kovacevich DS, Boney AR, Braunschweig CL, Perez A, Stevens M. Nutrition risk classification: a reproducible and valid tool for nurses. Nutr Clin Pract 1997;12:20-5.
PUBMED | CROSSREF
12. Chourdakis M, Hecht C, Gerasimidis K, Joosten KF, Karagiozoglou-Lampoudi T, Koetse HA, et al.
Malnutrition risk in hospitalized children: use of 3 screening tools in a large European population. Am J Clin Nutr 2016;103:1301-10.
PUBMED | CROSSREF
13. Wiskin AE, Owens DR, Cornelius VR, Wootton SA, Beattie RM. Paediatric nutrition risk scores in clinical practice: children with inflammatory bowel disease. J Hum Nutr Diet 2012;25:319-22.
PUBMED | CROSSREF
14. Bodenheimer T, Fernandez A. High and rising health care costs. Part 4: can costs be controlled while preserving quality? Ann Intern Med 2005;143:26-31.
PUBMED | CROSSREF
15. Huysentruyt K, Alliet P, Muyshont L, Rossignol R, Devreker T, Bontems P, et al. The STRONG(kids) nutritional screening tool in hospitalized children: a validation study. Nutrition 2013;29:1356-61.
PUBMED | CROSSREF
16. McCarthy H, Dixon M, Crabtree I, Eaton-Evans MJ, McNulty H. The development and evaluation of the Screening Tool for the Assessment of Malnutrition in Paediatrics (STAMP©) for use by healthcare staff. J Hum Nutr Diet 2012;25:311-8.
PUBMED | CROSSREF
17. Secker DJ, Jeejeebhoy KN. Subjective Global Nutritional Assessment for children. Am J Clin Nutr 2007;85:1083-9.
PUBMED | CROSSREF
18. Bland JM, Altman DG. Statistical methods for assessing agreement between two methods of clinical measurement. Lancet 1986;1:307-10.
PUBMED | CROSSREF
19. Beer SS, Juarez MD, Vega MW, Canada NL. Pediatric malnutrition: putting the new definition and standards into practice. Nutr Clin Pract 2015;30:609-24.
PUBMED | CROSSREF
20. Joosten KF, Hulst JM. Malnutrition in pediatric hospital patients: current issues. Nutrition 2011;27:133-7.
PUBMED | CROSSREF
21. Costa CA, Tonial CT, Garcia PC. Association between nutritional status and outcomes in critically-ill pediatric patients - a systematic review. J Pediatr (Rio J) 2016;92:223-9.
PUBMED | CROSSREF
22. Grippa RB, Silva PS, Barbosa E, Bresolin NL, Mehta NM, Moreno YM. Nutritional status as a predictor of duration of mechanical ventilation in critically ill children. Nutrition 2017;33:91-5.
PUBMED | CROSSREF
23. Elia M, Stratton RJ. An analytic appraisal of nutrition screening tools supported by original data with particular reference to age. Nutrition 2012;28:477-94.
PUBMED | CROSSREF
24. Bell KL, Davies PS. Prediction of height from knee height in children with cerebral palsy and non-disabled children. Ann Hum Biol 2006;33:493-9.
PUBMED | CROSSREF
25. Stevenson RD. Use of segmental measures to estimate stature in children with cerebral palsy. Arch Pediatr Adolesc Med 1995;149:658-62.
PUBMED | CROSSREF
26. Reber E, Gomes F, Vasiloglou MF, Schuetz P, Stanga Z. Nutritional risk screening and assessment. J Clin Med 2019;8:1065.
PUBMED | CROSSREF
27. Weekes CE, Elia M, Emery PW. The development, validation and reliability of a nutrition screening tool based on the recommendations of the British Association for Parenteral and Enteral Nutrition (BAPEN).
Clin Nutr 2004;23:1104-12.
PUBMED | CROSSREF
28. Carter LE, Shoyele G, Southon S, Farmer A, Persad R, Mazurak VC, et al. Screening for pediatric malnutrition at hospital admission: which screening tool is best? Nutr Clin Pract 2020;35:951-8.
PUBMED | CROSSREF
29. Ong SH, Chen ST. Validation of Paediatric Nutrition Screening Tool (PNST) among hospitalized Malaysian children. J Trop Pediatr 2020;66:461-9.
PUBMED | CROSSREF
Appendix. Nutrition Evaluation Screening Tool
Screening questions No Yes
Has the child unintentionally lost weight or had poor weight gain within the past 2 months? 0 1
Has the child been eating or feeding less over the past 2 months? 0 1
Does the child have a diagnosis that could cause a risk of malnutrition? (see Table below) 0 2
Height and weight over 2 centiles apart on the e-noting growth chart? 0 2
"Diagnoses with a risk of malnutrition:
Anorexia nervosa, burns, cancer, cardiac disease, coeliac disease, cystic fibrosis, inflammatory bowel disease, intestinal failure, liver disease, kidney disease, metabolic disease, malabsorption, neuro-disability, prematurity, surgery, trauma"
Outcome score
4–6 points High risk Commence food and fluid chart, monitor input/output and refer to a dietitian
2–3 points Medium risk Commence food and fluid chart. Consult the child’ medical team. Consider referring to a dietitian
0–1 points Low risk Weekly nutrition screening
Other considerations
Does the child require parenteral nutrition Refer to the Nutrition Support Team
Does the child require tube feeding Refer to the feeds unit–consider referring to the ward dietitian Does the child on a specialist feed of have
multiple food allergies Refer to the feeds unit, inform catering department–consider referring to the ward dietitian