JKSPEN Vol. 5, No. 2, 2013
82
Received May 4, 2013 Revised May 29, 2013 Accepted June 24, 2013
Correspondence to Jae Gil Lee
Department of Surgery, Yonsei University College of Medicine, 50, Yonsei-ro, Seodaemun-gu, Seoul 120-752, Korea
Tel: +82-2-2228-2127, Fax: +82-2-313-8289, E-mail: [email protected] Copyright ⓒ 2013. The Korean Society for Parenteral and Enteral Nutrition. All Rights Reserved.
This is an Open Access article distributed under the terms of the Creative Commons Attribution Non-Commercial License (http://creativecommons.org/licenses/ by-nc/3.0) which permits unrestricted non-commercial use, distribution, and reproduction in any medium, provided the original work is properly cited.
일개 대학병원에서 영양검색 도구 개발
세브란스병원 영양팀, 1연세대학교 의과대학 외과학교실, 2세브란스병원 약무국 이호선ㆍ심홍진1ㆍ장지영1ㆍ정아람ㆍ김수희2ㆍ김형미ㆍ김경식1ㆍ이재길1
Development of a New Nutrition Screening Tool for Use in an Acute Care Hospital Hosun Lee, M.S., Hongjin Shim, M.D.1, Ji Young Jang, M.D.1, A Ram Jung, Soo Hee Kim, B.Pharm2, Hyungmi Kim, Kyung Sik Kim, M.D., Ph.D.1, Jae Gil Lee, M.D., Ph.D.1
Department of Nutrition and Dietetics, Severance Hospital, Yonsei University Health System, 1Department of Surgery, Yonsei University College of Medicine, 2Pharmacy, Severance Hospital, Yonsei University Health System, Seoul, Korea
Purpose: The objective of this study was to develop a new nutrition screening tool for quality improvement of the nutritional care process in an acute care hospital with a 2,000-bed capacity.
Methods: To evaluate the current nutrition screening tool, we first examined 435 patients (274 men, aged 59.0±12.2 years). In the second step, the nutritional status of 387 patients (215 men, aged 57.5±13.3 years) was assessed by the scored patient-generated subjective global assess- ment (PG-SGA) tool. Variables such as age, body mass index (BMI), plasma albumin concentration, weight change, food intake change, and disease severity were analyzed to select indices for developing a new Severance nutrition screening index (SNSI).
Results: The current nutrition screening tool had a poor correlation with the PG-SGA (κ=0.180, P<0.0001). The SNSI was calculated as follows: SNSI = 1.5×albumin+
1.0×BMI+4.5×intake change+1.5×weight loss (for al- bumin<3.0, BMI<20, and decreased intake and weight loss>5% of usual body weight). The SNSI showed a sen- sitivity of 90.5%, a specificity of 90.7%, and a high corre- lation (κ=0.628, P<0.0001) with the PG-SGA.
Conclusion: The SNSI appears to be a valid and useful nutrition screening tool to determine the nutritional risk of patients in acute care hospitals. (JKSPEN 2013;5(2):
82-88)
Key Words: Nutrition status, Nutritional index, Screening, Nutrition
중심 단어: 영양상태, 영양 지표, 검색, 영양
INTRODUCTION
The prevalence of malnutrition is reported to be up to 60%, depending on the type and composition of the patient group and the assessment methods used.1 The ability of medical in- formation on admission to accurately predict the risk for malnu- trition-related complications is crucial in efforts to initiate early restorative medical nutritional therapy and to efficiently utilise nutritional care resources. The Joint Commission International has advised a nutrition assessment within 24 hours of admission to identify malnutrition as early as possible and to manage nu- tritional problems through adequate intervention. Nutritional screening tools vary with regard to the risk parameters used and their ability to determine nutritional risk. The nutrition risk in- dex (NRI), malnutrition universal screening tool (MUST), nutri- tional risk screening 2002 (NRS 2002) and mini nutritional as- sessment (MNA) are the most popular screening tools and have been approved as being reliable.2
We have developed and employed an automated nutrition screening tool using percentage of current weight to ideal body weight (%IBW), serum albumin (s-alb), and severity of diagnosis. These data were automatically collected from the elec- tronic medical records within 24 hours after hospital admission to screen the 200∼250 new patients admitted daily since 2005.
Although this method may be simple and rapid, it is limited in its ability to reflect nutritional stability and future risk of malnu-
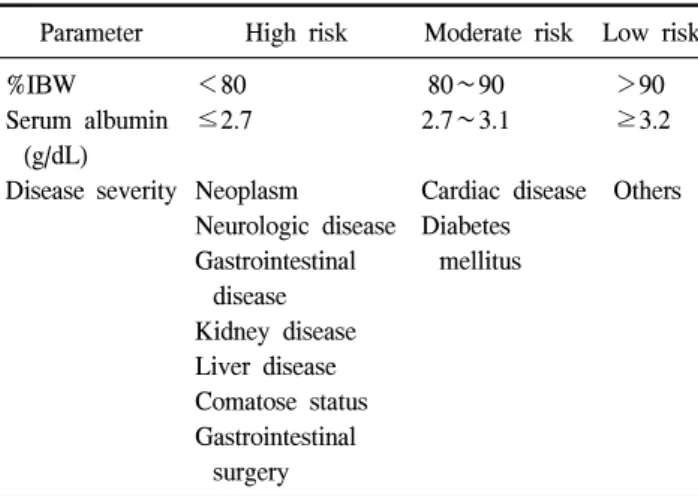
Table 1. Nutrition screening criteria
Parameter High risk Moderate risk Low risk
%IBW Serum albumin
(g/dL) Disease severity
<80
≤2.7
Neoplasm Neurologic disease Gastrointestinal
disease Kidney disease Liver disease Comatose status Gastrointestinal
surgery
80∼90 2.7∼3.1
Cardiac disease Diabetes
mellitus
>90
≥3.2
Others
High risk group = more than 1 high risk parameter; moderate risk group = more than 1 moderate risk parameter or 1 high risk param- eter and 1 moderate risk parameter; low risk group = the others;
%IBW = percentage of current body weight to ideal body weight.
trition by excluding changes in recent weight and food intake.
As the first step in a quality improvement program for the nutritional care process in an acute care hospital with a 2,000-bed capacity, we conducted this study to evaluate and re- vise our current nutritional screening criteria and to validate the newly developed one.
MATERIALS AND METHODS
This study was prospectively conducted in two phases: 1) evaluation of the current nutrition screening tool and 2) devel- opment of a new nutritional screening index.
1. Subjects
To evaluate the current nutrition screening tool, we examined 435 patients who were admitted to Severance Hospital, a ter- tiary university hospital, for gastrointestinal cancer surgery be- tween May 1 and September 30, 2011.3 In the second phase of the study, to develop a new Severance nutrition screening index (SNSI), we enrolled 387 patients who were admitted to 2 medi- cal and 2 surgical wards during January 2012. We choose these 4 wards to determine whether SNSI could be applied to a broad spectrum of patient populations in this acute care university hospital. This study was approved by the institutional review board of Severance Hospital (IRB No. 4-2011-0016), and writ- ten informed consent was obtained from each patient before enrolment.
2. Evaluation of current nutrition screening tool The current nutrition screening tool, used since 2005, divided the patients into 3 groups-low, moderate and high nutritional risk-using %IBW, s-alb and diagnosis (Table 1). For evaluation of the current nutrition screening tool, two clinical dieticians interviewed the patients and assessed their nutritional status us- ing the scored patient-generated subjective global assessment (PG-SGA) within 24 hours after hospital admission. Data were collected regarding patient age, gender, diagnosis, height, weight, s-alb, and total lymphocyte count (TLC) from medical records. The scored PG-SGA assessment classified patients into well-nourished (PG-SGA stage A), mild to moderately mal- nourished (PG-SGA stage B), and severely malnourished (PG-SGA stage C) groups. We analyzed the consistency be- tween the results from the current nutrition screening tool and PG-SGA using kappa (κ) statistics.
3. Development of the new nutrition screening index To develop a new SNSI, we reviewed and compared the pa- rameters of currently the advised and validated nutrition screen- ing tool, i.e. NRS 2002, MNA, MUST, and scored PG-SGA.4 Two clinical dieticians collected information on patient age, gender, medical department, anthropometric measurements (height, weight, and body mass index [BMI]), s-alb, and TLC.
Patients were interviewed within 24 hours after admission.
Weight loss, intake change, and current intake were collected.
The nutritional status of patients was evaluated using scored PG-SGA. Indicators for developing a SNSI were selected by multiple logistic regressions, which used the nutritional status from the PG-SGA as the dependent variable (well-nourished and mild to moderate malnutrition vs. severe malnutrition) and age, BMI, s-alb, weight change, changes in food intake, and disease severity were analysed as independent variables.
Nutritional risk was determined by the best optimal cut-off point, which was the probability determined using Youden’s in- dex (sensitivity+specificity-1).
4. Statistical analysis
Data were analysed using IBM SPSS ver. 20.0 (IBM Co., Armonk, NY, USA). P-values of <0.05 were considered to be significant. Consistency between the PG-SGA and SNSI was evaluated with κ statistics. The value of κ varies from 0 to 1, a value of <0.2=poor, 0.2∼0.4=fair, 0.4∼0.6 moderate, 0.6∼
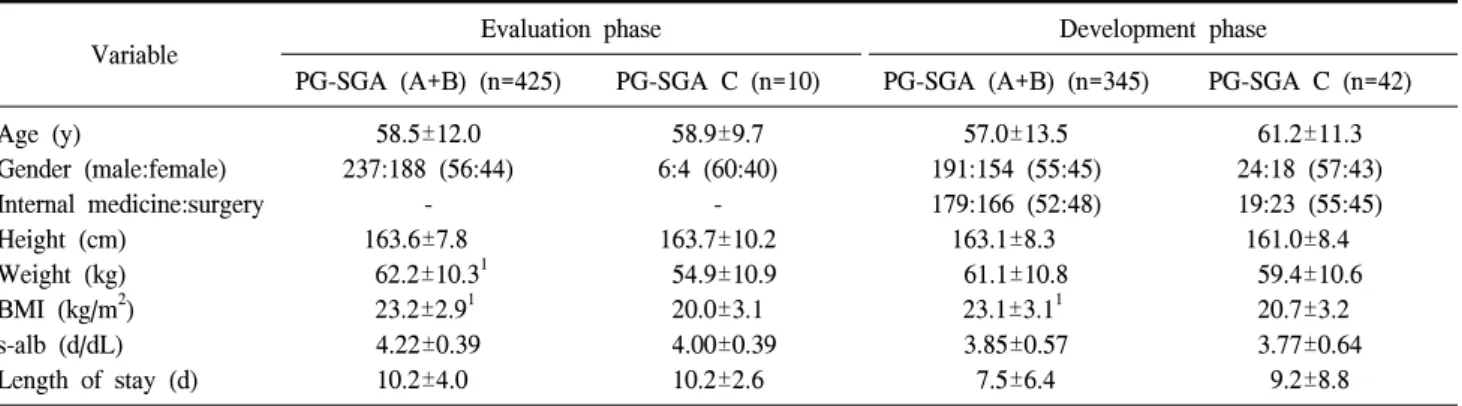
Table 2. General characteristics
Variable Evaluation phase Development phase
PG-SGA (A+B) (n=425) PG-SGA C (n=10) PG-SGA (A+B) (n=345) PG-SGA C (n=42) Age (y)
Gender (male:female) Internal medicine:surgery Height (cm)
Weight (kg) BMI (kg/m2) s-alb (d/dL) Length of stay (d)
58.5±12.0 237:188 (56:44)
- 163.6±7.8
62.2±10.31 23.2±2.91 4.22±0.39 10.2±4.0
58.9±9.7 6:4 (60:40)
- 163.7±10.2
54.9±10.9 20.0±3.1 4.00±0.39 10.2±2.6
57.0±13.5 191:154 (55:45) 179:166 (52:48)
163.1±8.3 61.1±10.8 23.1±3.11 3.85±0.57 7.5±6.4
61.2±11.3 24:18 (57:43) 19:23 (55:45)
161.0±8.4 59.4±10.6 20.7±3.2 3.77±0.64
9.2±8.8 Values are presented as mean±standard deviation or number.
1Significantly different from the severely malnourished patients (P<0.05).
PG-SGA = patient-generated subjective global assessment; BMI = body mass index; s-alb = serum albumin.
Table 3. Distribution of the diagnosis of the patients in the development phase
Diagnosis Department
Internal medicine Surgery All
Cancer
Gastrointestinal Hepatobiliary Thyroid Breast Others
Gastrointestinal disease Hepatobiliary disease Non-cancer
Kidney disease Respiratory disease Others
Total
114 56 0 0 2 13 14
0 2 1 202
94 8 18 14 3 28 14
1 0 5 185
208 64 18 14 5 41 28
1 2 6 387 0.8 substantial and >0.8 almost perfect concordance.5 Multiple
logistic regression analysis was conducted to developing a SNSI. The validity of the SNSI was analysed by sensitivity, specificity, and negative and positive predictive values. The correlation between the SNSI and PG-SGA was assessed by the receiver operator characteristic (ROC) curve with the area under the curve. The area under the curve ranges from 0.5 to 1, a value of 0.9∼1=excellent, 0.8∼0.9=good, 0.7∼0.8=fair, 0.6∼
0.7=poor, 0.5∼0.6=fail.
RESULTS
In the evaluation phase, patients were 59.0±23.2 years old, and 243 of the 435 patients (55.9%) were men. In the develop- ment phase, patients were 57.5±13.3 years old, and 215 of the 387 patients (55.6%) were men. Ten patients (2.3%) in the evaluation phase were classified into the severe malnutrition group and 50 patients (10.4%) into the moderate malnutrition group, based on PG-SGA criteria. In the evaluation phase, there were no significant differences in age and s-alb between the well-nourished or moderately malnourished (SGA A and B) and the severely malnourished, whereas body weight and BMI were significantly lower in the severely malnourished group (SGA C) compared with the well-nourished or moderately malnour- ished patients (54.9±10.9 kg vs 62.2±10.3 kg, P=0.035; 20.0±
3.1 kg/m2 vs 23.2±2.9 kg/m2, P=0.006) (Table 2).
Among the patients in the development phase, 185 patients were admitted to the medical department and 202 to the surgi- cal department. The majority of the subjects were diagnosed with cancer (n=309, 79.8%) (Table 3). Forty-two patients
(10.9%) in the development phase were severely malnourished based on PG-SGA criteria. The prevalence of severe malnu- trition did not differ significantly between the medical patients and the surgical patients (11.4% vs. 10.3%, P=0.724). Although age, body weight, and s-alb did not show any significant differ- ences between the two groups (SGA A+B vs. SGA C), BMI of the SGA C groups was significantly lower than that of the SGA A+B group (20.7±3.2 kg/m2 vs. 23.1±3.1 kg/m2, P<
0.0001) (Table 2).
1. Evaluation of the current nutrition screening tool Based on the nutrition screening criteria, the majority of the patients were at low risk (n=390, 89.7%), whereas 37 patients
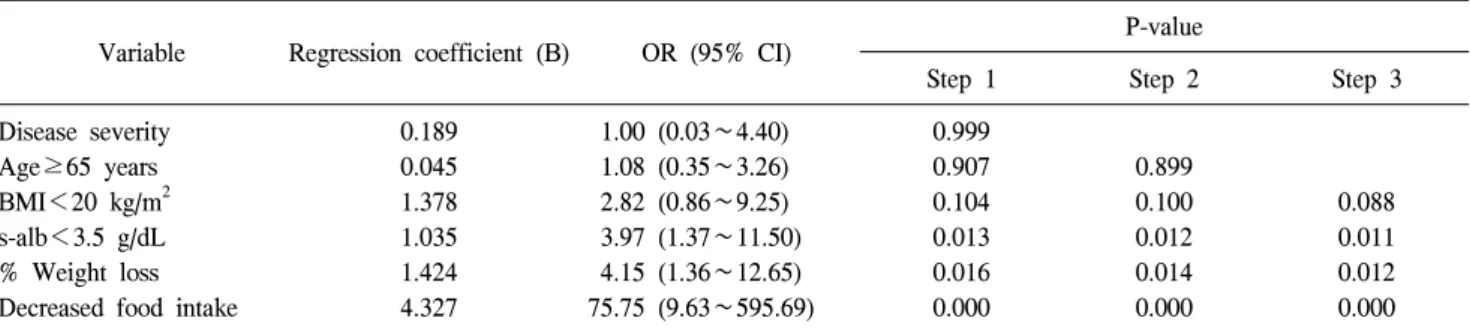
Table 5. Odds ratios (OR) of significant variables for patients-generated subjective global assessment from multiple logistic regression analysis
Variable Regression coefficient (B) OR (95% CI) P-value
Step 1 Step 2 Step 3
Disease severity Age≥65 years BMI<20 kg/m2 s-alb<3.5 g/dL
% Weight loss Decreased food intake
0.189 0.045 1.378 1.035 1.424 4.327
1.00 (0.03∼4.40) 1.08 (0.35∼3.26) 2.82 (0.86∼9.25) 3.97 (1.37∼11.50) 4.15 (1.36∼12.65) 75.75 (9.63∼595.69)
0.999 0.907 0.104 0.013 0.016 0.000
0.899 0.100 0.012 0.014 0.000
0.088 0.011 0.012 0.000 Explicative variables: disease severity, age, BMI, s-alb, % weight loss, decreased food intake.
CI = confidence interval; disease severity = cancer, HIV, pulmonary or cardiac cachexia, gastrointestinal fistula, pressure sore, trauma, renal failure; BMI = body mass index; s-alb = serum albumin; % weight loss = weight loss of ≥5% of usual body weight for the past 1 month or ≥10% of usual body weight for the past 6 months; decreased food intake, decreased food intake for the past 1 week.
Table 4. Comparison of the results of the current nutrition screening tool and PG-SGA
PG-SGA
Total κ
A B C
Nutritional risk Low Moderate High Total
348 (89.2) 26 (70.3) 4 (50.0) 378 (86.9)
35 (9.0) 10 (27.0) 2 (25.0) 47 (10.8)
7 (1.8) 1 (2.7) 2 (25.0) 10 (2.3)
390 (100) 37 (100) 8 (100) 435 (100)
0.180
Values are presented as number of subjects (%). Kappa value (κ)
<0.2 (poor), 0.2∼0.4 (fair), 0.4∼0.6 (moderate), 0.6∼0.8 (substantial), >0.8 (perfect).
PG-SGA = patient-generated subjective global assessment.
Table 6. Model of the newly developed Severance nutrition screening index (SNSI)
Variable Value
SNSI
Albumin (g/dL) BMI (kg/m2) Food intake change Weight change
Model=(1.5 s-alb)+(1.0 BMI)+(4.5 food in- take change)+ (1.5 weight change)
≥3.5=1, <3.5=2
≥20=1, <20=2
No change or increase=1, decrease=2 No change, increase, or decrease <5% of
usual body weight=1, decrease ≥5%=2 s-alb = serum albumin; BMI = body mass index.
(8.5%) were at moderate risk and 8 patients (1.8%) at high nu- tritional risk (Table 4). The correlation between the PG-SGA and the current nutrition screening tool was poor, with κ=
0.180 (P<0.0001; Table 4), which indicated the necessity of developing a new nutrition screening tool to improve specificity and sensitivity.
2. Development of Severance nutrition screening index We reviewed the candidate variables which are used in the nutrition screening tools in the PG-SGA, NRS 2002, NRI, and MNA for SNSI. Variables were required to be simple and quick to administer; use routinely available data; and minimise in- complete screening due to missing data. Age, disease severity, weight loss, intake change, BMI, and s-alb, which satisfied the selection criteria, were chosen for multiple logistic regressions.
Multiple logistic regression identified significant explanatory variables in nutritional status, such as decreased food intake
(odds ratio [OR], 75.8; 95% confidence interval [CI], 9.63∼
595.69; P<0.0001), weight loss (OR, 4.15; 95% CI, 1.36∼
12.65; P=0.012), s-alb (OR, 3.97; 95% CI, 1.37∼11.50;
P=0.011), and BMI 2.82 [0.86∼9.25], P=0.088; Table 5).
The SNSI was calculated as described in Table 6. Intake change was scored as 1 (no change or increase in intake) or 2 (decrease). Weight loss was determined using the previous month’s weight as the base and scored as 1 (no change, in- creased or decrease<5% of usual body weight) or 2 (decrease
≥5%). S-alb was scored as 1 (≥3.5 g/dL) or 2 (<3.5 g/dL) and BMI as 1 (≥20 kg/m2) or 2 (<20 kg/m2). A SNSI score no less than 13.5 was set as the cut-off score for malnutrition risk based on sensitivity and specificity levels against PG-SGA (Table 6).
3. Validity of the SNSI
When the SNSI cut-off point for malnutrition was set as the highest score (Youden’s index=0.822), there were 70 high nu-
Table 7. Validity of the newly developed Severance nutrition screening index (SNSI)
PG-SGA SNSI
Total Low risk High risk
Well-nourished or mod- erately malnourished1 Severely malnourished2 Total
Sensitivity Specificity Kappa value (κ)
313 (90.7)
4 (9.5) 317 (72.1) 90.5 90.7 0.628
32 (9.3)
38 (90.5) 70 (27.9)
345 (100)
42 (100) 387 (100)
Values are presented as number (% or percent only). P<0.0001 for percentage of agreement between PG-SGA and SNSI at κ statistic.
1PG-SGA stage A+B according to PG-SGA assessment, 2PG-SGA stage C according to PG-SGA assessment.
PG-SGA = patient-generated subjective global assessment.
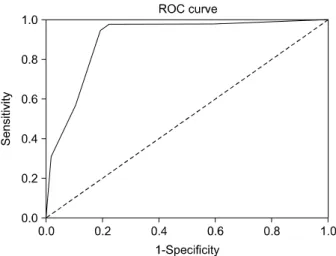
Fig. 1. Receiver operator characteristic (ROC) curve for the newly developed Severance nutrition screening index (SNSI) compared with patient-generated subjective global assessment. The 45o line represents a curve for a ROC area of 0.5. The area under the curve is 0.899 (95% confidence interval, 0.854∼0.943) for the SNSI.
tritional risk patients (18.1%). ROC analysis for the cross-val- idity of the SNSI is presented in Fig. 1. The goodness of the SNSI model was checked with the area under the ROC curve for the SNSI compared with a PG-SGA of 0.899 (95% CI, 0.854∼0.943), which showed high accuracy according to an ar- bitrary guideline. The sensitivity and specificity of the SNSI for the Scored PG-SGA (gold standard) were 90.5% and 90.7%, respectively. The relationship between the two methods was high, with κ=0.628 (P<0.0001, Table 7).
We determined the consistency between the two methods in the evaluation phase patients using κ statistics. The value of κ was increased from 0.180 to 0.347. The area of under the ROC curves was 0.711 (95% CI, 0.498∼0.925), which showed fair accuracy according to an arbitrary guideline.
DISCUSSION
As the first step in a quality improvement program for the nutrition care process in a university hospital, a new nutrition screening tool (SNSI) was developed and validated for the screening of malnutrition in hospitalised patients. A number of nutritional screening and assessment tools have been developed to assess nutritional risk. Each tool has advantages and disadvantages. Many researchers have compared a large number of nutrition screening and assessment tools. Skipper et al.6 ana- lysed the evidence to identify the most valid and reliable nu- trition screening tools for use in acute care and hospital-based
ambulatory care settings. They reported that the malnutrition screening tool (MST) was the only tool that was shown to be both valid and reliable for identifying undernutrition. MST in- corporates three components: presence of weight loss (score 0 or 2), amount of weight lost (score 1∼4), and poor food intake or poor appetite (score 0 or 1).7 A score ≥2 means that the patients is at risk for malnutrition. Kyle et al.8 reported that the NRS 2002 had higher sensitivity and specificity than the MUST and NRI compared with the SGA. The European Society for Clinical Nutrition and Metabolism recommends the NRS 2002 to screen hospitalised adults.4 Because the NRS 2002 is based on anthropometrics, food intake, age, and metabolic stress, ap- plying this tool to the identification of nutrition risk groups for all hospitalised patients is associated with large costs in terms of time and manpower. For Korean cancer patients, Kim et al.9 reported that the sensitivity and specificity of the NRI and NRS 2002 against the PG-SGA (gold standard) were 81.8%, 48.7%
and 72.9%, 81.9%, respectively, and developed the malnutrition screening tool for cancer patients for the screening of malnu- trition in hospitalised cancer patients with higher sensitivity (94.0%), specificity (84.2%), and kappa (0.7) value than those of the NRI (0.22) and NRS 2002 (0.5) against PG-SGA. As a 2,000-bed university hospital, we have patients with various diseases, not limited to cancer, and need a nutrition screening tool that can be used for all of our patients.
In this study, we improved the consistency between the result of nutrition screening and that of the PG-SGA from 0.180 to 0.628, as evaluated by kappa statistics. Whereas the current nu-
trition screening tool includes %IBW, s-alb and diagnosis, which are convenient in terms of speed and completion rate, i.e. minimising missing patients, but fail to represent nutritional stability and future risk of development of malnutrition. The SNSI includes changes in food intake, weight loss, BMI and s-alb as significant parameters through multiple logistic re- gression analysis. s-alb, % weight loss, changes in food intake and BMI all proved to be related to clinical outcomes such as length of stay (LOS), morbidity and mortality, whereas the lev- el of associations with LOS was lower than that obtained with the SGA, NRI, MUST or NRS 2002, showing the superior val- ue of these nutritional screening tools over single parameters.8 Knowing whether there has been recent weight loss over time helps to identify patients who are at risk for malnutrition, and this information seems to be the most important single indicator of nutritional status.10 Moreover, this finding suggests that nu- tritional screening tools should use both BMI and weight loss to predict risk for malnutrition.11
Based on the SNSI, 18.1% of the patients were evaluated as high nutritional risk. The prevalence of malnutrition differs across tools and depends on the subject’s characteristics. The nutrition screening tool should be selected considering the char- acteristics of the subject populations and the capability of the institutions, i.e. the personnel for nutrition screening and the nutrition care process for selected malnourished patients. Our hospital has 200 to 250 new patients every day and lacks clin- ical dieticians and we decided to select the patients who were at risk of severe malnourishment (SGA C). The purpose of nu- tritional screening is to identify those patients who are at nutri- tional risk and at higher risk for complications. Selecting the patients with established severe malnutrition or who are at risk of developing the condition is an more effective strategy in set- tings that lack clinical dieticians who can conduct nutritional intervention. Generally, approximately 15% of patients admitted daily are identified as being at moderate to high risk for malnu- trition with the current nutrition screening tools. The increased prevalence of patients at high risk for malnutrition might be due to the practice of changes in weight and food intake prior to admission. In a study of mixed hospitalised patients in Singapore, 22.3% of the subjects were identified as being at risk of malnutrition with the MST; however, of those subjects, approximately 69% were confirmed to be malnourished.1 In the EuroOOPS study, 32.6% of the 5,051 patients were defined as at-risk by the NRS 2002.12 For Korean cancer patients, 26.1%
of 257 patients were classified as malnourished by another nu- trition screening tool.9 Poulia et al.13 and Kyle et al.8 showed differences in the prevalence of malnutrition among nutrition screening tools even when applied to the same patients.
We used the Scored PG-SGA as the gold standard for devel- opment and validation of the SNSI. The SGA has been reported as an accurate nutrition assessment tool that is a predictor of complications, such as infections and poor wound healing, and is associated with longer LOS in severely malnourished patients.14,15 The SGA was developed to assess nutrition-asso- ciated complications, but Jeejeebhoy16 suggested that it could equally likely represent an index of sickness rather than nutrition. Furthermore, examiner training to improve competency in nutritional assessment may be necessary to obtain higher spe- cificity and sensitivity with the SGA. Although trained clinical dieticians have conducted nutrition assessments using the PG- SGA, the SGA has some limitations as a reference assessment tool. Therefore, using the PG-SGA as a gold standard to devel- op and validate SNSI is a limitation of the present study.
However, the PG-SGA is one of the best available tools for assessing nutrition status because it is patient centred, in- corporates clinical history and physical examination, and has been demonstrated to be associated with patient outcome. Many studies on developing or validating nutrition screening tools used the PG-SGA as a gold standard, whereas some studies used the results of clinical nutrition assessments.6,17 In the clin- ical setting, nurses are more likely to perform such a survey about changes in weight and food intake; thus, it might be nec- essary to ensure consistency in the methods used by different investigators to evaluate the validity and reproducibility of the new nutrition screening tool.
CONCLUSION
In the present study, we developed a new nutrition screening index, the SNSI, for patients who were admitted to an acute care university hospital with various diseases. For the SNSI, % weight loss, decreased food intake, s-alb and BMI were selected as significant. Few studies directly link the nutrition process to improved outcomes. Further research is needed to evaluate the benefits of nutritional screening and intervention and their ef- fect on outcomes in various disease populations.
REFERENCES
1. Raja R, Lim AV, Lim YP, Lim G, Chan SP, Vu CK.
Malnutrition screening in hospitalised patients and its im- plication on reimbursement. Intern Med J 2004;34(4):176-81.
2. Elia M, Stratton R. On the ESPEN guidelines for nutritional screening 2002. Clin Nutr 2004;23(1):131-2.
3. Shim HJ, Cheong JH, Lee KY, Lee H, Lee JG, Noh SH.
Perioperative nutritional status changes in gastrointestinal can- cer patients. Yonsei Med J 2013 (in press).
4. Kondrup J, Allison SP, Elia M, Vellas B, Plauth M; Educatio- nal and Clinical Practice Committee, European Society of Parenteral and Enteral Nutrition (ESPEN). ESPEN guidelines for nutrition screening 2002. Clin Nutr 2003;22(4):415-21.
5. Landis JR, Koch GG. The measurement of observer agreement for categorical data. Biometrics 1977;33(1):159-74.
6. Skipper A, Ferguson M, Thompson K, Castellanos VH, Porcari J. Nutrition screening tools: an analysis of the evi- dence. JPEN J Parenter Enteral Nutr 2012;36(3):292-8.
7. Anthony PS. Nutrition screening tools for hospitalized patients. Nutr Clin Pract 2008;23(4):373-82.
8. Kyle UG, Kossovsky MP, Karsegard VL, Pichard C.
Comparison of tools for nutritional assessment and screening at hospital admission: a population study. Clin Nutr 2006;
25(3):409-17.
9. Kim JY, Wie GA, Cho YA, Kim SY, Kim SM, Son KH, et al. Development and validation of a nutrition screening tool
for hospitalized cancer patients. Clin Nutr 2011;30(6):724-9.
10. Kyle UG, Genton L, Pichard C. Hospital length of stay and nutritional status. Curr Opin Clin Nutr Metab Care 2005;
8(4):397-402.
11. Leuenberger M, Kurmann S, Stanga Z. Nutritional screening tools in daily clinical practice: the focus on cancer. Support Care Cancer 2010;18(Suppl 2):S17-27.
12. Sorensen J, Kondrup J, Prokopowicz J, Schiesser M, Krähen- bühl L, Meier R, et al; EuroOOPS study group. EuroOOPS:
an international, multicentre study to implement nutritional risk screening and evaluate clinical outcome. Clin Nutr 2008;
27(3):340-9.
13. Poulia KA, Yannakoulia M, Karageorgou D, Gamaletsou M, Panagiotakos DB, Sipsas NV, et al. Evaluation of the efficacy of six nutritional screening tools to predict malnutrition in the elderly. Clin Nutr 2012;31(3):378-85.
14. Sungurtekin H, Sungurtekin U, Hanci V, Erdem E. Compari- son of two nutrition assessment techniques in hospitalized patients. Nutrition 2004;20(5):428-32.
15. Christensson L, Unosson M, Ek AC. Evaluation of nutritional assessment techniques in elderly people newly admitted to municipal care. Eur J Clin Nutr 2002;56(9):810-8.
16. Jeejeebhoy KN, Detsky AS, Baker JP. Assessment of nutri- tional status. JPEN J Parenter Enteral Nutr 1990;14(5 Suppl):
193S-6S.
17. Boléo-Tomé C, Monteiro-Grillo I, Camilo M, Ravasco P.
Validation of the Malnutrition Universal Screening Tool (MUST) in cancer. Br J Nutr 2012;108(2):343-8.