Effect of Electrolyte Composition on Corrosion Behavior of PEO Treated AZ91 Mg Alloy
Kyeong Jin Park and Jae Ho Lee†
Department of Materials Science and Engineering, Hongik University 72-1 Sangsu-dong, Mapo-gu, Seoul 121-791 Korea
(Received November 3, 2009; Revised December 30, 2009; Accepted December 30, 2009)
Mg and Mg alloys have been used for lots of applications, including automobile industry, aerospace, mobile phone and computer parts owing to low density. However, Mg and Mg alloys have a restricted application because of poor corrosion properties. Thus, improved surface treatments are required to produce protective films that protect the substrate from corrosive environments. Environmental friendly Plasma Electrolytic Oxidation (PEO) has been widely investigated on magnesium alloys. PEO process combines electrochemical oxidation with plasma treatment in the aqueous solution. In this study, AZ91 Mg alloys were treated by PEO process in controlling the current with PC condition and treated time, concentration of NaF, NaOH, and Na2SiO3. The surface morphology and phase composition were analyzed using SEM, EDS and XRD.
The potentiodynamic polarization tests were carried out for the analysis of corrosion properties of specimen.
Additionally, salt spray tests were carried out to examine and compare the corrosion properties of the PEO treated Mg alloys.
Keywords : plasma, oxidation, salt spray test, magnesium alloy
†Corresponding author: [email protected]
1. Introduction
Recently many industries are paying attention to the as- pects of substitution of various components with lighter ones made of magnesium alloys. Magnesium and Mg al- loys have excellent physical and mechanical properties, such as low density, high strength, good cast ability, high electrical conductivity, high thermal conductivity, high di- mensional stability and good electromagnetic shielding characteristics.1)-3) However, the importance factor limiting broad application of Mg alloys is their high corrosion rate and low hardness.4)
Plasma electrolytic oxidation (PEO) has emerged as having a view technique for the production of hard, thick ceramic oxide coating on metals substrate such as alumi- num, titanium and magnesium alloys in order to protect them from severe abraded and corrosion.
The division which is mainly researched magnesium PEO process is used with the electrolyte, the potassium fluoride (KF), sodium fluoride(NaF), potassium hydrox- ide(KOH), sodium phosphate(Na3PO4), sodium silicate (Na2SiO3), sodium aluminate (NaAlO2), sodium hydroxide (NaOH). It changes composition and consistency of sol-
ution and the result which researches the specific of oxide film.5)-9) Among them, additive containing fluoride ion is known to assist the oxide film to grow fast.10)-11) The PEO is the complicated process of electrochemical oxidation and plasma process in aqueous solution. The PEO is simultaneously progressive process such as oxide layer growth, dielectric breakdown, dissolution of the oxi- dation layer which is already formed, and gas discharge.12) The mechanism of PEO oxide layer formation is oxide film growth in micro-arc discharge zone. During plasma discharging, it lead to fusing and recrystallization of the oxide film.10)
In this study, magnesium alloys were treated by PEO process and the surface morphology and phase composi- tion were analyzed. The electrochemical potentiodynamic polarization tests were carried out for the analysis of corro- sion properties of specimen. Additionally, salt spray tests were carried out to examine and compare the corrosion properties of the PEO treated films.
2. Experimental procedure
The oxide ceramic coatings were produced on specimen plates (15x15x3 mm) of the AZ91 magnesium alloy. The composition of AZ91 is Al 8.5-9.5 wt%, Zn 0.6-1.4 wt%,
Fig. 1. PEO Experimental system (1)cathode (stainless steel grid), (2)anode (magnesium alloy), (3)thermometer, (4)electrolyte reservoir, (5)pump, (6)stainless steel heat exchanger, (7)hot electrolyte, (8)cold electrolyte.
and Mg balance. After polishing with 1 μm Al2O3 polish- ing slurry, the samples were first cleaned with acetone and then ultrasonically cleaned in ethanol followed by rins- ing with distilled water.
The PEO solution solutions contained Na2SiO3, NaF and NaOH. As shown in Fig. 1, PEO system consisted of reaction bath, a high voltage power supply unit, chilling system to keep the temperature of the solution constant, and the electrolyte reservoir. a stainless steel container that also served as the counter electrode, a cyclic cooling system. The specimens were working as the anode and stainless steel grid was working as the cathode. The current density was varied from 0.1 A to 0.4 A. The experiments was running 0~40 min. The temperature of the electrolyte was kept between 2 and 10 °C.
The surface morphologies and phase compositions were analyzed using SEM and XRD. The composition of the coating was examined using EDS. The electrochemical analysis of the coating was performed using potentiody- namic polarization tests which was carried out at room temperature in 5 wt.% NaCl corrosive environment. A con- ventional three electrode system was used for the corrosion evaluation. The salt spray test was conducted for 72 hours.
The chamber temperature was 35 ℃ and 3.5 wt% NaCl solution was used. The weight of specimens before and after salt spray test were measured and the surface of specimens were also analyzed.
3. Results and discussion
In PEO process, if the electrolyte was containing P an F, it formed stable phase of Mg3(PO4) or MgF2 in the coating. Those magnesium compounds contributed to in- crease corrosion resistance.12)-13) In this experiments, NaF
0 20 40 60 80 100 120 140 160 180 200
0 1 2 3 4 5 6 7 8 9 10 11
Current (A)
time (sec)
400V 450V 500V
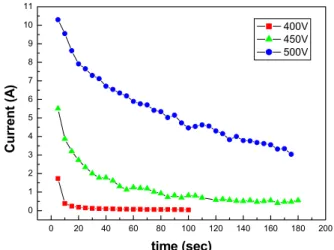
Fig. 2. Variation of current with treatment time for PEO of AZ91 at 400-500 V in solution containing 1 g/L NaF, 2 g/NaOH, 10 g/L Na2SiO3.
was added to improve corrosion properties. The experi- ments was run at constant voltage, the responding current was very high at the first couple of minutes and dropped abruptly after highly resistant hydroxide layer formation.
The change of current with time at different applied volt- age was shown in Fig. 2. After dropped from high current, the current density was gradually decreased since the hy- droxide/oxide layer was grown. The high voltage and high current in the first couple of minutes can grow the oxide quickly, however the surface of PEO treated specimen was rough and porous. To improve the surface roughness the constant current was applied for the PEO treatment.
The effects of NaF concentration on the voltage were investigated. Fig. 3. shows the variations of the voltage with time during PEO process in the Na2SiO3-NaOH sol- utions with varying NaF concentration. The applied current
0 200 400 600 800 1000 1200
0 50 100 150 200 250 300 350 400 450
Voltage (V)
Time (sec)
No add 1g/L 2g/L 4g/L
Fig. 3. Variation of voltage with PEO processing time: (a) No add NaF, (b) 1 g/L NaF, (c) 2 g/L NaF, (d) 4 g/L NaF.
Fig. 5. Shows the SEM images of the oxide films on AZ91 substrate by PEO for different concentration of NaF. (a) No addition NaF (b) 1 g/L NaF (c) 2 g/NaF.
0 1 2 3 4
140 160 180 200 220 240 260
140 160 180 200 220 240 260 Plasma Ignition Time (sec)
Plasma Starting Voltage (V)
Quantity (g/L)
Plasma Starting Voltage Plasma Ignition Time
Fig. 4. Influence of NaF concentration on plasma occurring voltage and ignition time.
was 0.1 A and the other electrolyte components were fixed at 10 g/L Na2SiO3 and 2 g/L NaOH. The process time was 20 min. When the concentration NaF was increased from 0 g/L to 4 g/L, the plasma starting voltage was de- creased from 270 V to 230 V and the ignition time was decreased from 204 to 132 sec. Fig. 4 shows the change of plasma starting time and voltages.
The surface morphologies were examined using SEM.
Fig. 5 shows the surface of the oxide films. Under the same operating conditions, the surface of oxide film is gradually smoothed as the result of the reduced pores num- ber, as well as the decreased pore size in accordance with increasing NaF concentration. The addition of NaF plays an essential role for fabricating ceramic coatings with low- er porosity.
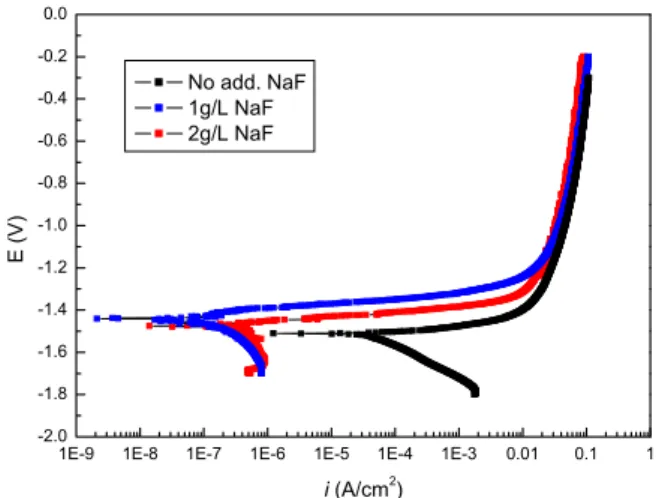
The corrosion resistance of the oxide film by PEO treat- ment was determined using the potentiodynamic polar- ization test in 5 wt.% NaCl solution at the scanning rate of 1 mV/s. Fig. 6 shows polarization curve for different specimens. The corrosion potential was not significantly
1E-9 1E-8 1E-7 1E-6 1E-5 1E-4 1E-3 0.01 0.1 1 -2.0
-1.8 -1.6 -1.4 -1.2 -1.0 -0.8 -0.6 -0.4 -0.2
E (V)
i (A/cm2) No add. NaF 1g/L NaF 2g/L NaF
Fig. 6. Potentiodynamic polarization curves obtained in 5% NaCl aqueous solution (scanning rate 0.1 mV/sec) (a):1 g/L NaF, (b) 2 g/L NaF, (c) without NaF.
changed however the current at active and passive range was decreased after PEO treatment. PEO treated specimen at 2 g/L NaF electrolyte shows the better corrosion resistant.
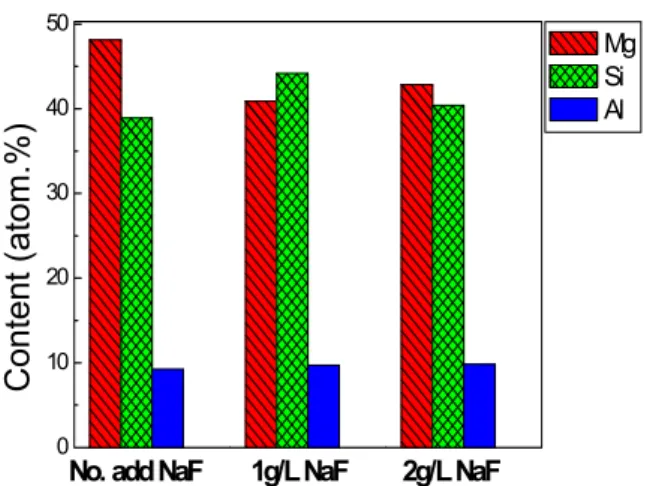
The chemical compositions of oxide layers were exam- ined using EDS and was shown in Fig. 7. The addition of NaF did not influence on the oxide composition significantly.
The effect of NaOH concentration was investigated.
As NaOH concentration was increased, the voltage was lowered with time. It is due the conductivity of the electro- lyte has a strong influence on the plasma formation. Fig.
8 shows the change of voltage with time at different NaOH concentrations. At high and low concentration of NaOH, the voltage was dropped after certain period of time. Since the oxide layer was getting thicker and the resistance of the oxide is higher, the voltage should be increased to
0 10 20 30 40 50
No. add NaF 1g/L NaF 2g/L NaF
Content (atom.%)
Mg Si Al
Fig. 7. The EDS analyze for oxide film in different concentrate NaF. (1) 1 g/L NaF, (2) 2 g/L NaF.
0 200 400 600 800 1000 1200
0 50 100 150 200 250 300 350 400 450
Voltage (V)
Time (sec)
1g/L 2g/L 4g/L 8g/L 10g/L 20g/L
Fig. 8. Variation of voltage with treatment time in PEO process:
(a) 1 g/L NaOH, (b) 2 g/L NaOH, (c) 4 g/L NaOH, (d) 8 g/L NaOH, (e) 10 g/L NaOH, (f) 20 g/L NaOH.
0 10 20 30 40
40 60 80 100 120 140 160 180 200 220 240 260
40 60 80 100 120 140 160 180 200 220 240 260 Plasma Ignition Time (sec)
Plasma Starting Voltage (V)
Quentity (g/L)
Plasma Starting Voltage Plasma Ignition Time
Fig. 9. Influence of concentration of electrolyte on plasma occur voltage, ignition time.
maintain the constant current. At two conditions, the sur- face oxide was not uniform and certain area was not coated. The resistance on uncoated area was very low, the voltage was dropped to maintain the constant current.
From those observations, the optimum concentration was 10 g/L NaOH.
The influence of NaOH concentration on plasma occur- ring voltage and ignition time were investigated. Fig. 9 shows the plasma occurring voltage and ignition time with NaOH concentrations. As increasing NaOH concentration, the plasma occurring voltage was decreased and ignition time was also decreased. When the concentration NaOH was increased from 1 g/L to 20 g/L, the plasma starting voltage was decreased from 250 V to 120 V and the igni- tion time was decreased from 155 to 65 sec.
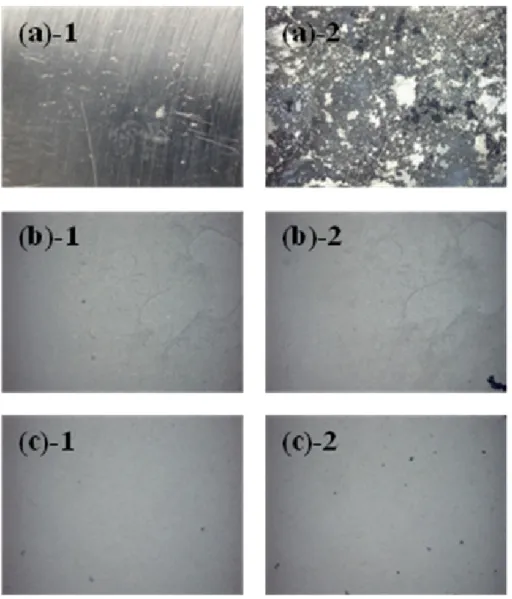
The salt spray test was conducted to investigate the cor- rosion resistance of the oxide layer. The surface of speci- mens were analyzed after 72 hours salt spray test; the chamber temperature was fixed at 35 ℃. The surface mor- phologies after salt spray test were shown in Fig. 10. The untreated specimens were severely damaged after 72 hr salt spray test. On the other hand, the surfaces of PEO treated specimens were hardly changed after salt spray test.
The corrosion rate is 245 g/y.m2 for the untreated speci- men. On the other hand the corrosion rate of PEO treated specimen is less than 16 g/y.m2.
4. Conclusions
The effects of NaF and NaOH concentration on PEO treated oxide were investigated at constant current mode.
When NaF concentration increased, voltage increasing rate and plasma starting voltage is lowered. Also pore of oxide film became smaller and its surface was smoothed. When NaOH concentration increased, pH is increased, voltage increasing rate and plasma occur voltage are lowered.
However, over 20 g/L NaOH concentration, the voltage was dropped with time due to the non-uniform formation of oxide film. The result of the salt spray test and polar- ization plots proves that corrosion resistance of treated specimen by PEO was improved. Current control was bet- ter than voltage control to obtain dense oxide film.
Acknowledgments
This work is supported by Korea Research Foundation (Grant: 2007-D00953) and also supported by Seoul R&BD Research Program No. 10555.
References
1. B.L. Mordike and T. Ebert, Mater. Sci. Eng. A: Struct., 302, 37 (2001).
2. I.M. Baghni, Y.S. Wu, J.Q. Li, C.W. Du, and W. Zhang, Trans. Nonferr. Met. Soc. China, 13, 1253 (2003).
3. G.H. Wu, M. Xie, C.Q. Zhai, Z.Q. Zeng, Y.P. Zhu,
Fig. 10. Morphologies of specimens before and after 72 hours salt spray test. (a)-1: uncoated-before (a)-2: uncoated-after (b)-1:
treated-before add 1 g/L NaF (b)-2: treated-after add 1 g/L NaF, (c)-1: treated-before add 2 g/L NaF, (c)-2: treated-after add 2 g/L NaF.
and W.J. Ding, Trans. Nonferr. Met. Soc. China, 13, 1260 (2003).
4. E.F. Emley, Principles of Magnesium Technology, Pergamon Press, London, 1966.
5. O. Khaselev, D. Weiss, and J. Yahalom, Corrosion Science, 43, 1295 (2001).
6. Y. Ma, X. Nie, D. O. Northwood, and H. Hu, Thin Solid Films, 469, 472 (2004).
7. H. F. Guo, M. Z. An, H. B. Huo, S. Xu, and L. J.
Wu, Applied Surface Science, 252, 7911 (2006).
8. F. A. Bonilla, A. Berkani, Y. Liu, P. Skeldon, G. E.
Thompson, H. Habazaki, K. Shimizu, C. John, and K.
Stevens, J. of the Electrochemical Society, 149, B4
(2002).
9. O. Khaselev, D. Weiss, and J. Yahalom, J. of the Electrochemical Society, 146, 1757 (1999).
10. H.F. Guo, M.Z. Applied Surface Science, 246, 229 (2005).
11. L. Wang, Li Chen, Z. Yan, H. Wang, and J. Peng, J.
of Alloys and Compounds, 480, 469 (2009).
12. A. L. Yerokhin, X. Nie, A. Leyland, A. Matthews, and S. J. Dowey, Surface and Coating Technology, 122, 73 (1999).
13. E. Gulbrandsen, J. Taft, and A. Olse, Corros. Sci., 34, 1423 (1993).