Diagnostic value of procalcitonin and CRP in critically ill patients admitted with suspected sepsis
Jae-Sik Joen
1and Sung-Mi Ji
21Department of Laboratory Medicine, College of Medicine, Dankook University, Cheonan, Korea
2Department of Anesthesiology and Pain Medicine, College of Medicine, Dankook University Hospital, Cheonan, Korea
Background: Identifying early markers of septic complications can aid in the diagnosis and therapeutic management of hospitalized patients. In this study, the utility of procalcitonin (PCT) vs. C-reactive protein (CRP) as early markers of sepsis was compared.
Methods: A series of 2,697 consecutive blood samples was collected from hospitalized patients and serum PCT and CRP levels were measured. Patients were categorized by PCT level as follows: < 0.05 ng/ml, 0.05-0.49 ng/ml, 0.5-1.99 ng/ml, 2-9.99 ng/ml, and > 10 ng/ml. Diagnostic utility was analyzed by receiver operating characteristic (ROC) curves.
Results: Mean CRP levels varied among the five PCT categories at 0.31 ± 2.87, 5.65 ± 6.26, 13.78 ± 8.01, 12.15 ± 10.16, and 17.77 ± 10.59, respectively (P < 0.05). PCT and CRP differed between positive and negative blood culture groups (PCT: 15.9 vs. 4.78 mg/dl; CRP: 11.5 ng/ml vs. 9.57 ng/ml; P < 0.05). The areas under the ROC curves (PCT, 95% confidence interval [CI]: 0.743, range: 0.698–0.789 at a threshold of 0.5 ng/ml;
CRP, 95% CI: 0.540, range: 0.478-0.602 at a threshold of 8 mg/l) differed for PCT and CRP (P < 0.05).
Conclusions: Therefore, PCT is a reliable marker for sepsis diagnosis and is more relevant than CRP in patients with a positive blood culture. These findings can be useful for the treatment of critically ill sepsis patients.
Key Words: C-reactive protein; Infection; Procalcitonin; Sepsis.
Copyrightⓒ 2015 Journal of Dental
Anesthesia and Pain Medicine Received: 2015. 09. 08.•Revised: 2015. 09. 22.•Accepted: 2015. 09. 22.
Corresponding Author: Sung-Mi Ji, Department of Anesthesia and Pain Medicine, Dankook University Hospital, Manghyeng-Ro 201, Dongnam-Gu, Cheonan-Si 330-714, Korea
Tel: +82-41-550-6819 Fax: +82-41-550-6819 E-mail: [email protected]
INTRODUCTION
Infection is a major complication in hospitalized and post-surgical patients that greatly impacts patient outcome and increases healthcare costs for society. However, the clinical distinction between minor infection and sepsis is not always apparent, making diagnosis difficult at early stages. For example, systemic inflammatory response syndrome (SIRS) with fever frequently occurs in hospitalized patients in the absence of an infection. SIRS can be self-limiting or may progress to severe sepsis or septic shock in some cases [1]. As such, an accurate and timely diagnosis of infection vs. sepsis and the imple- mentation of adequate treatment are essential. The
identification of early specific and sensitive biomarkers of SIRS or sepsis can aid in this regard. Although blood cultures are currently the best method for diagnosing an infection, they are not universally informative. Further- more, cytokines such as interleukin (IL)-6 and -8 have been shown to be associated with sepsis severity and patient outcome, but are not established tools for diagnosis and clinical decision-making [2,3]. On the other hand, C-reactive protein (CRP) is a commonly used marker for detecting infection that is highly sensitive and convenient forclinical follow-up, but has only limited specificity.
Procalcitonin (PCT) is a recently identified marker of inflammation and infection. The The 116-amino acid PCT protein issynthesized and secreted by thyroid C cells as
a precursor of calcitonin in humans; however, PCT levels are increased in sepsis from an extrathyroidal origin [4,5]
and are markedly elevatedduring severe infection and endotoxemia [6,7]. PCT is detectable after infection following an increase in the levels of proinflammatory cytokines such as tumor necrosis factor-α or IL-6, with high levels maintained from 8 to 24 h, after which levels return to baseline values more rapidly than that of CRP [8].
This study evaluatedthe diagnostic value of PCT as an early marker of infection and compared PCT and CRP in terms of their ability to predict sepsis based on the results of blood cultures.
MATERIAL AND METHODS
We retrospectively analyzed 2,697 consecutive blood samples obtained from hospitalized patients at a Dankook University Hospital between January 2014 and December 2014 who had undergone laboratory tests for the measure- ment PCT and CRP levels. This study was approved by our hospital ethics committee,and informed consent was waived owing to the nature of retrospective data collection. PCT and CRP were measured from the same sample in all patients, and in some cases sampling was performed multiple times. PCT and CRP values were measured by enzyme-linked fluorescent assay using the VIDAS system (bioMerieux Co., Lyon, France) and by nephelometry with the IMMAGE system (Beckman Coulter Co., Fullerton, CA, USA), respectively. Clinical and laboratory data were obtained from computerized databases.
PCT values were divided into five categories according to clinical status as follows: Group 1, normal state (PCT values < 0.05 ng/ml); Group 2, local infection (PCT value of 0.05-0.49 ng/ml); Group 3, sepsis (PCT value of 0.5-1.99 ng/ml); Group 4,severe sepsis (PCT value of 2-9.99 ng/ml); and Group 5, septic shock (PCT value >
10 ng/ml). Blood cultures were carried out for 1,010 of the 2,697 samples using the Cobas e601 system (Roche Diagnostics, Mannheim, Germany), which has a detecta-
ble range of 0.02-100 ng/ml, sensitivity of 0.06 ng/ml, and specificity of < 0.02 ng/ml.
Samples were further divided into positive and negative blood culture groups. For the former, Bacillus spp., Cory- nebacterium spp., Propionibacterium spp., or coagulase- negative staphylococci identified in a single culture flask were treated as contaminants; however, if present in at least two culture flasks they were treated as possible pathogens, as were all other detected species. Samples with contaminants were excluded and only the results pertaining to pathogenic bacteria were analyzed in this study.
Values are expressed as mean ±standard deviation (SD), median and interquartile range, or number and percentage. Results of the five PCT categories were compared and the mean ± SD of CRP was compared among the five categories. PCT and CRP values were also compared with respect to positive/negative blood culture groups. The area under the curve (AUC) of PCT and CRP receiver operating characteristic (ROC) curves forpredicting sepsis (thresholds: PCT > 0.5 ng/ml and CRP > 8 mg/dl) were calculated. Sensitivity, specificity, and positive/negative predictive values were also deter- mined to assess the clinical significance of PCT test results and to evaluate threshold values for predicting sepsis based onblood culture results. AUC values were compared using a previously described method [9]. CRP values of the five PCT groups were compared byanalysis of variance. The Student’s t test was used to compare mean PCT and CRP values based on blood culture results.
Differences with a P value < 0.05 was considered statisti- cally significant. Statistical analyses were performed using MedCalc 13.1.1.0 (Mariakerke, Belgium) and SPSS 20.0 for Windows (SPSS Inc., Chicago, IL, USA).
RESULTS
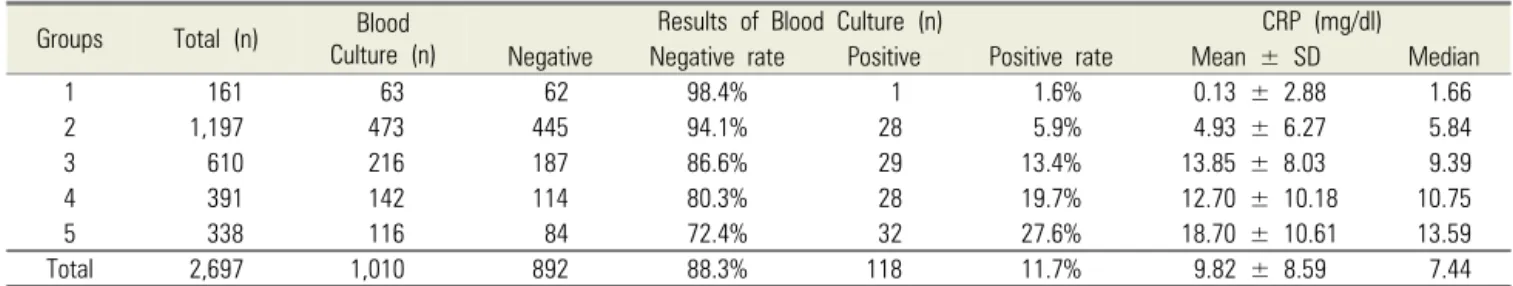
The distribution of the sampled population according to PCT categories is shown in Table 1. CRP values increased from Group 1 through 5 as a function of PCT
Groups Total (n) Blood Culture (n)
Results of Blood Culture (n) CRP (mg/dl)
Negative Negative rate Positive Positive rate Mean ± SD Median
1 161 63 62 98.4% 1 1.6% 0.13 ± 2.88 1.66
2 1,197 473 445 94.1% 28 5.9% 4.93 ± 6.27 5.84
3 610 216 187 86.6% 29 13.4% 13.85 ± 8.03 9.39
4 391 142 114 80.3% 28 19.7% 12.70 ± 10.18 10.75
5 338 116 84 72.4% 32 27.6% 18.70 ± 10.61 13.59
Total 2,697 1,010 892 88.3% 118 11.7% 9.82 ± 8.59 7.44
Levels of procalcitonin corresponds to group 1, < 0.05 ng/mL; group 2, 0.05-0.49 ng/mL; group 3, 0.5-1.99 ng/mL; group 4, 2-9.99 ng/mL and group 5, > 10 ng/mL. SD: standard deviation.
Table 1. Distribution of sample population in accordance with the categorized groups of procalcitonin level
Fig. 1. Comparison of C-reactive protein levels in accordance with the five categorized groups of patients based on procalcitonin levels as follows: Group 1: 10 ng/mL. The box plot shows the lower quartile, mean, and upper quartile value.
Fig. 2. Procalcitonin levels in the blood culture-positive group and blood culture negative-group. The boxes show the lower quartile, median, and upper quartile values.
Fig. 3. C-reactive protein levels between the blood culture-positive group and blood culturenegative group. The boxes show the lower quartile, median, and upper quartile values.
AUC Standard divisiona
Approximate 95% confidence interval
Lower Upper
PCT .743 .023 .698 .789
CRP .540 .032 .478 .602
Fig. 4. Receiver operating characteristic curve for procalcitonin (PCT) and C-reactive protein (CRP) values for sepsis prediction. The area under the curve respectively, indicating a statistically significant difference (P <
0.0001).
level and the differences between groups were statistically significant (P < 0.05 Fig. 1). Mean CRP concentrations in the five PCT categories were 0.13 ± 2.88, 4.93 ± 6.27,
13.85 ± 8.03, 12.70 ± 10.18, and 18.70 ± 10.61mg/dl, respectively (P < 0.01).
Blood cultures were established for 1010 samples 118 were positive whereas the remaining 892 were negative.
Median PCT values were 2.55 and 0.35 ng/ml (Fig. 2) andmedian CRP values were 7.41 and 7.49 mg/dl (Fig.
3) in the positive and negative blood culture groups, respectively. Thus, both CRP and PCT levels were higher in the positive than in the negative blood culture group;
however, the difference was only statistically significant for PCT (P < 0.01) and not for CRP (P = 0.07).An analysis of ROC curves to assess the predictive value of PCT and CRP for sepsis found that the AUC of PCT was higher than that of CRP (P < 0.01 Fig. 4).
DISCUSSION
The results of this study demonstrate that CRP value increased proportionately with increases in PCT level in hospitalized patients. In Group 5, which hadthe highest PCT levels, CRP levels were higher than those in Group 1, which hadthe lowest PCT levels. Furthermore, both PCT and CRP values were higher in the positive than in the negative blood culture group. Previous studies have compared biomarkers in patient groups categorized according to PCT level [10,11]. Our measurements could therefore be useful for predicting clinically relevant sepsis in hospitalized patients. In this regard, PCT was found to be a more accurate marker than CRP to predict postoperative sepsis.
The early identification of hospitalized patients who may develop sepsis can enable more timely intervention.
Decision-making based on symptoms of infection is often subjective, as these may be attenuated or nonspecific. As such, detecting an infection or sepsis in hospitalized patients remains a challenge, and there is a need for reliable biomarkers for this purpose however, currently available clinical and biological parameters such as leukocyte count and CRP cannot always distinguish between sepsis and SIRS. Furthermore, routine laboratory
tests lack sensitivity and specificity, and confirmatory results of microbiological studies are not immediately available.
Biomarkers such as PCT, CRP, and erythrocyte sedi- mentation rate are known indicators of bacterial infection [12]. In our study, CRP and PCT levels were higher in the positive than in the negative blood culture group.
These results underscore the importance of combining biochemical information from biomarkers and clinical statusfor diagnosing sepsis. Moreover, the observed increases in PCT and CRP levels imply that these bio- markers are clinically useful for predicting sepsis, although their levels were also elevated in some patients in the negative blood culture group these may be non-microbiologically confirmed cases, which represent about one third of all sepsis patients [13].
PCT is one of the most accurate biomarkers for diagnosing sepsis and infection [6]. In the present study, we found that a serum PCT concentration > 10 ng/ml was highly suggestive of sepsis with good sensitivity (75.0%), specificity (56.5%), and predictive value. This is consistent with previous studies demonstrating the usefulness of PCT as a marker for infection for instance, high serum PCT was detected in patients with severe bacterial infection, whereas in those without sepsis serum PCT was undetectable [6].
CRP levels have been widely used to diagnose and track infections. Aserum CRP level > 50 mg/l in intensive care unit patients was found to be highly suggestive of sepsis, with a sensitivity of 98.5% and a specificity of 75% [14], although it did not predict disease outcome or severity. CRP is also inadequate for immediate diagnosis and prognosis because of the time taken for a reaction to occur and the limited duration of increased serum levels [9,15,16]. In our study, CRP sensitivity was 47.3% and specificity was 53.1% moreover, the AUC of PCT was higher than that of CRP (0.701, 0.511), suggesting that PCT is superior to CRP as a marker for identifying and diagnosing sepsis. However, it is still unclear whether PCT is more specific than cytokines for infection; although this point remains controversial [17],
several studies have provided evidence for the usefulness of PCT as a predictive biomarker in clinical settings [5,13].
Our study had some limitations. Firstly, given that it was a retrospective and single-center study there may have been observational and selection biases for example, the heterogeneous nature of patient blood samples may have obscured greater differences in the results. Secondly, the influence of disease time course must be taken into consideration, since some studies have shown that the PCT level increases at an earlier time point than that of CRP after sepsis onset and also decreases sooner during the course of controlled sepsis [18,19]. Therefore, follow-up studies may be needed for patients with clinically suspected sepsis.
In conclusion, PCT is a reliable and specific sepsis biomarker in critically ill patients, and may be a useful predictive tool. Accurate determination of PCT levels in a clinical setting can improve the treatment of hospi- talized patients by enabling a timely diagnosis and avoiding potentially unnecessary treatment.
Declaration of interest: The authors have no conflicts of interest.
Funding: This work was supported solely from institutional and departmental sources and no specific funding was received.
REFERENCES
1. Rangel-Frausto MS, Pittet D, Costigan M, Hwang T, Davis CS, Wenzel RP. The natural history of the systemic inflammatory response syndrome (sirs). A prospective study. JAMA 1995; 273: 117-23.
2. Biffl WL, Moore EE, Moore FA, Peterson VM. In- terleukin-6 in the injured patient. Marker of injury or mediator of inflammation? Ann Surg 1996; 224: 647-64.
3. Mokart D, Capo C, Blache JL, Delpero JR, Houvenaeghel G, Martin C, et al. Early postoperative compensatory
anti-inflammatory response syndrome is associated with septic complications after major surgical trauma in patients with cancer. Br J Surg 2002; 89: 1450-6.
4. Ghillani PP, Motte P, Troalen F, Jullienne A, Gardet P, Le Chevalier T, et al. Identification and measurement of calcitonin precursors in serum of patients with malignant diseases. Cancer Res 1989; 49: 6845-51.
5. Maruna P, Nedelnikova K, Gurlich R. Physiology and genetics of procalcitonin. Physiol Res 2000; 49 Suppl 1:
S57-61.
6. Assicot M, Gendrel D, Carsin H, Raymond J, Guilbaud J, Bohuon C. High serum procalcitonin concentrations in patients with sepsis and infection. Lancet 1993; 341: 515-8.
7. Karzai W, Oberhoffer M, Meier-Hellmann A, Reinhart K. Procalcitonin--a new indicator of the systemic response to severe infections. Infection 1997; 25: 329-34.
8. Dandona P, Nix D, Wilson MF, Aljada A, Love J, Assicot M, et al. Procalcitonin increase after endotoxin injection in normal subjects. J Clin Endocrinol Metab 1994; 79:
1605-8.
9. Hanley JA, McNeil BJ. A method of comparing the areas under receiver operating characteristic curves derived from the same cases. Radiology 1983; 148: 839-43.
10. Harbarth S, Holeckova K, Froidevaux C, Pittet D, Ricou B, Grau GE, et al. Diagnostic value of procalcitonin, interleukin-6, and interleukin-8 in critically ill patients admitted with suspected sepsis. Am J Respir Crit Care Med 2001; 164: 396-402.
11. Muller B, Becker KL, Schachinger H, Rickenbacher PR, Huber PR, Zimmerli W, et al. Calcitonin precursors are reliable markers of sepsis in a medical intensive care unit.
Crit Care Med 2000; 28: 977-83.
12. Chalupa P, Beran O, Herwald H, Kasprikova N, Holub M. Evaluation of potential biomarkers for the discrimina- tion of bacterial and viral infections. Infection 2011; 39:
411-7.
13. Hur M, Moon HW, Yun YM, Kim KH, Kim HS, Lee KM. [comparison of diagnostic utility between procalci- tonin and c-reactive protein for the patients with blood culture-positive sepsis]. Korean J Lab Med 2009; 29:
529-35.
14. Povoa P, Almeida E, Moreira P, Fernandes A, Mealha R, Aragao A, et al. C-reactive protein as an indicator of sepsis. Intensive Care Med 1998; 24: 1052-6.
15. Haupt W, Fritzsche H, Hohenberger W, Zirngibl H.
Selective cytokine release induced by serum and separated plasma from septic patients. Eur J Surg 1996; 162: 769-76.
16. Martin C, Boisson C, Haccoun M, Thomachot L, Mege JL. Patterns of cytokine evolution (tumor necrosis factor- alpha and interleukin-6) after septic shock, hemorrhagic shock, and severe trauma. Crit Care Med 1997; 25: 1813-9.
17. Gattas DJ, Cook DJ. Procalcitonin as a diagnostic test
for sepsis: Health technology assessment in the icu. J Crit Care 2003; 18: 52-8.
18. Claeys R, Vinken S, Spapen H, ver Elst K, Decochez K, Huyghens L, et al. Plasma procalcitonin and c-reactive protein in acute septic shock: Clinical and biological correlates. Crit Care Med 2002; 30: 757-62.
19. Oberhoffer M, Karzai W, Meier-Hellmann A, Bogel D, Fassbinder J, Reinhart K. Sensitivity and specificity of various markers of inflammation for the prediction of tumor necrosis factor-alpha and interleukin-6 in patients with sepsis. Crit Care Med 1999; 27: 1814-8.