INTRODUCTION
In vitro antifungal susceptibility tests provide a reli- able measure of the relative activities of various drugs.
324 DOI 10.3343/kjlm.2009.29.4.324
324
Flucytosine과 세 Azole의 Spectrophotometric Broth Microdilution법을 이용한 항진균제 감수성 검사를 위한 최적의 파장
The Optimal Wavelength of Spectrophotometric Broth Microdilution Antifungal Susceptibility Test for Flucytosine and Three Azoles
Ja Young Lee, M.D.
1, Eun Jung Lee
1, Si Hyun Kim
1, Haeng Soon Jeong
1, Seung Hwan Oh, M.D.
1, Hye Ran Kim, M.D.
1, Jeong Nyeo Lee, M.D.
1,2, Chulhun L. Chang, M.D.
3, Weon-Gyu Kho, M.D.
2,4,5, and Jeong Hwan Shin, M.D.
1,2Department of Laboratory Medicine1, Inje University College of Medicine; Paik Institute for Clinical Research2, Inje University College of Medicine, Busan; Department of Laboratory Medicine3, Pusan National University School of Medicine, Busan; Department of Parasitology4, Inje University College of Medicine; Mitochondrial Research Group (Frontier Inje Research for Science and Technology)5, Inje University
College of Medicine, Busan, Korea
이자영
1∙이은정
1∙김시현
1∙정행순
1∙오승환
1∙김혜란
1∙이정녀
1,2∙장철훈
3∙고원규
2,4,5∙신정환
1,2인제대학교 의과대학 진단검사의학교실1, 인제대학교 백인제기념임상의학연구소2, 부산대학교 의학전문대학원 진단검사의학교실3, 인제대학교 의과대학 기생충학교실4, 인제대학교 의과대학FIRST미토콘드리아 사업단5
324 324
Background : There is no guideline for the appropriate wavelength at which to measure the opti- cal density (OD) value in broth microdilution antifungal susceptibility testing, although a spectropho- tometric reading method is commonly used. The present study aimed to analyze the difference in the OD values over the range of visible light and to ascertain the optimal wavelength for the spec- trophotometric method of microdilution testing.
Methods : We measured the OD of background blank controls of broth medium, antifungal agents, and inocula of five type strains using a Synergy HT multi-detection microplate reader at 5-nm inter- vals from 380 nm to 760 nm. We also estimated the OD differences between the 50% of growth con- trol and blank control.
Results : The OD of the blank control showed a parabola shape with two peaks and steadily de- creased at longer wavelengths. The curves of the antifungal agent were similar to those of blank controls, and the influence of each antifungal agent on the OD was minimal. For the difference in OD between 50% of growth control and the blank control, the curve was the opposite of the blank control, and the OD increased steadily at the wavelengths above 600 nm.
Conclusions : The range between 600 nm and 700 nm was the optimal wavelength for broth microdi- lution antifungal susceptibility testing, although any wavelength within the visible light spectrum can be used. (Korean J Lab Med 2009;29:324-30)
Key Words : Antifungal susceptibility test, Broth microdilution method, Spectrophotome- ter, Wavelength
Received :April 28, 2009 Manuscript No :KJLM09-056 Revision received :May 27, 2009
Accepted :June 24, 2009
Corresponding author :Jeong Hwan Shin, M.D.
Department of Laboratory Medicine, College of Medicine, Inje University, 633-165 Gaegeum-dong, Busanjin-gu, Busan 614-735, Korea
Tel : +82-51-890-6475, Fax : +82-51-893-1562 E-mail : jhsmile@inje.ac.kr
*This work was supported by a 2008 Inje University Research Grant.
They predict the likely outcome of therapy, provide the means with which to monitor the development of drug resistance, and reveal the therapeutic potential of inves- tigational agents [1-3]. The CLSI published reference gui- delines for susceptibility testing of Candidaspecies and Cryptococcus neoformansas M27-A2 in 2002 [4] and revis- ed it as M27-A3 in 2008 [5]. However, this standard me- thod for broth dilution susceptibility testing of yeasts still has some problems in the determination of the minimum inhibitory concentration (MIC). Especially for flucytosine and the azoles, endpoints are typically less well defined than for amphotericin B, which may be a significant source of variability in a broth microdilution test [5]. It is recom- mended that the MIC for azoles and flucytosine be defined as the lowest concentration at which a prominent decrease in turbidity is observed.
Recently, several alternative methods such as flow cy- tometry [6, 7], E test [8-10], colorimetric assay [11-13], and spectrophotometric reading of broth microdilution [14, 15] have been used in an attempt to obtain an objec- tive and convenient interpretation of antifungal suscep- tibility results. Among these options, a modified broth microdilution format using spectrophotometry comple- mented by visual reading was accepted in CLSI M27-A2 for determining the MICs of such organisms, which is the first well that shows a 50% decrease in optical density (OD) relative to the drug-free growth control well [4]. This spec- trophotometric reading provides an objective result con- cordant with traditional visual reading. However, we found that the wavelength for spectrophotometric reading was different in various articles, and the reason for the choice of a specific wavelength was not specified. Also, there are no guidelines for the appropriate wavelength to measure OD value anywhere in CLSI M27-A2. So, the present study aimed to analyze the difference of OD in relation to the measured wavelength at 5-nm intervals between 380 nm and 760 nm and to ascertain the optimal wavelength for determination of the MIC in spectrophotometric broth microdilution antifungal susceptibility testing of flucy- tosine and three azoles.
MATERIALS AND METHODS
We tested the ODs of the broth medium, RPMI 1640- morpholinopropanesulfonic acid (MOPS), at different wavelengths to determine the value of the background blank control. The medium was identical to those used for the broth microdilution antifungal susceptibility test;
the absence of an antifungal agent and yeast inoculum were the only differences. We selected the range from 380 to 760 nm because it is within the visible spectrum and is used most commonly in the laboratory. The OD mea- surement was achieved by a Synergy HT multi-detection microplate reader (Bio-Tek, Winooski, VT, USA) at 5-nm intervals.
The influence of an antifungal agent on the OD is also of great importance. To confirm the influence of antifun- gal agents themselves, we included four agents, flucyto- sine, itraconazole, ketoconazole, and fluconazole. Stock solutions of itraconazole and ketoconazole were prepared by dissolving the powder in 100% dimethylsulfoxide), whe- reas fluconazole and flucytosine were dissolved in sterile distilled water. The solution was divided into 1-mL ali- quots at a concentration of 1,280 μg/mL and frozen at -70℃ until use. On the day the test was performed, the stock solution was thawed and diluted in RPMI-1640 (with L-glutamine but without bicarbonate) buffered to pH 7.0 with 0.165 M 3-N-MOPS. The broth microdilution testing was performed according-NMOPS to the guidelines of the CLSI using 96-well microplates [4]. The plates contained serial dilutions of the antifungal agents without a yeast inoculum. The final concentrations were 0.125-16 μg/mL for itraconazole and ketoconazole and 0.125-64 μg/mL for flucytosine and fluconazole. The blank control well contained 200 μL of RPMI 1640 medium. The OD for each concentration was likewise measured by the microplate reader between 380 and 760 nm.
The growth control well contained RPMI 1640-MOPS medium and dilutions of yeast inoculum without antifun- gal agent. This growth control is used to assess the via- bility of the organism in antifungal susceptibility testing and also serves as a turbidity control for reading endpo-
ints. We used five type strains of Candida species (C. albi- cansATCC 64550, C. albicansATCC 90028,C. parapsilo- sisATCC 22019, C. tropicalisATCC 20138, and C. krusei ATCC 6258). The isolates were stored in skim milk at -70℃
until used. They were grown on Sabouraud dextrose agar for 24 hr at 35℃ prior to testing, and the inoculum prepa- ration followed the directions of document M27-A2 of the CLSI guidelines [4]. Five colonies with diameters of more than 1 mm on Sabouraud dextrose agar were suspended in sterile 0.85% saline and adjusted to a final concentra- tion of 0.5-2.5×10³/mL in RPMI 1640-MOPS. The mic- roplates contained only the inocula of the five type strains with RPMI 1640. After incubation at 35℃ for 48 hr, we measured the OD of the growth control well between 380 and 760 nm. All procedures were repeated twice for rep- roducibility.
The MIC value of flucytosine and the three azoles cor- responds to the first well that shows a 50% decrease rel- ative to the OD in the drug-free growth control well. We verified the difference between the half OD of the growth
control and the OD of the blank control to seek the opti- mal wavelength for spectrophotometric antifungal sus- ceptibility testing.
RESULTS
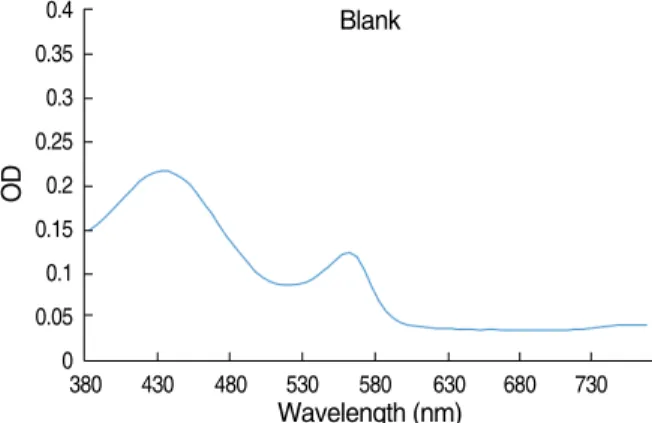
The continuous OD curve of the blank control well is shown in Fig. 1. The curve was a parabola with two peaks.
Fig. 1. Absorbance spectrum curve of blank control well.
Abbreviation: OD, optical density.
OD
0.4 0.35 0.3 0.25 0.2 0.15 0.1 0.05 0
380 430 480 530 580 630 680 730
Wavelength (nm) Blank
Fig. 2. Absorbance spectrum curves of antifungal agent-containing wells.
Abbreviation: See Fig. 1.
OD
0.4 0.35 0.3 0.25 0.2 0.15 0.1 0.05 0
380 430 480 530 580 630 680 730
nm Itraconazole
OD
0.4 0.35 0.3 0.25 0.2 0.15 0.1 0.05 0
380 430 480 530 580 630 680 730
nm Ketoconazole
OD
0.4 0.35 0.3 0.25 0.2 0.15 0.1 0.05 0
380 430 480 530 580 630 680 730
nm 5-Flucytosine
OD
0.4 0.35 0.3 0.25 0.2 0.15 0.1 0.05 0
380 430 480 530 580 630 680 730
nm Fluconazole
16 μg/mL 8 μg/mL 4 μg/mL 2 μg/mL 1 μg/mL 0.5 μg/mL 0.25 μg/mL 0.125 μg/mL Blank
64 μg/mL 32 μg/mL 16 μg/mL 8 μg/mL 4 μg/mL 2 μg/mL 1 μg/mL 0.5 μg/mL 0.25 μg/mL 0.125 μg/mL Blank 64 μg/mL
32 μg/mL 16 μg/mL 8 μg/mL 4 μg/mL 2 μg/mL 1 μg/mL 0.5 μg/mL 0.25 μg/mL 0.125 μg/mL Blank
16 μg/mL 8 μg/mL 4 μg/mL 2 μg/mL 1 μg/mL 0.5 μg/mL 0.25 μg/mL 0.125 μg/mL Blank
The OD generally was higher at shorter wavelengths and lower at longer wavelengths. The OD at the starting wave- length, 380 nm, was relatively high. The values increased steadily to 435 nm and then decreased until the wave- length reached 520 nm. The values increased at 560 nm and decreased at about 600 nm. The OD values of second parabola and peak were lower than those of the first para- bola and peak. The OD remained unchanged above 600 nm.
The ODs of four antifungal agent-containing wells with the previously mentioned concentrations are shown in Fig. 2. The shape and value of the curves for the wells containing itraconazole and fluconazole were nearly the same as those of the blank control well, whereas the val- ues for flucytosine and ketoconazole were slightly higher than those of the blank control well in the two peak re- gions. However, the ODs had no relation to the drug con- centrations of flucytosine and ketoconazole, and the dif- ference was minor, so it could be ignored. The influence of these four antifungal agents on the OD was minute at any wavelength between 380 and 760 nm.
The final MICs are the concentrations in the wells show- ing a 50% reduction relative to the OD in the drug-free growth control well. So we could presume that the wave- length showing a high OD for growth control and the grea- test difference between the growth control and the blank
wells would be the most suitable for the susceptibility test.
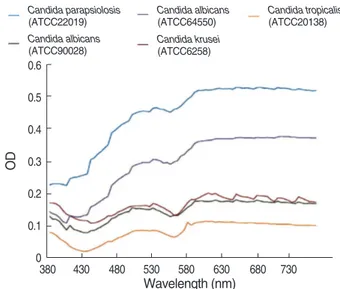
The ODs of five type strains were sufficiently high com- pared with those of the blank control (Fig. 3). For two strains, C. albicansATCC 64550 and C. parapsilosisATCC 22019, the ODs increased steadily as the wavelength be- came longer, but the OD curve patterns from other three strains, namely, C. albicans ATCC 90028,C. krusei ATCC 6258, and C. tropicalis ATCC 20138, were similar to that of the blank control and could be attributable to the broth medium. The difference in the half OD of growth control and the OD of the blank control showed a characteristic feature resembling a blank control curve upside down (Fig.
4). For all type strains, it was decreased to the range of 380-440 nm, increased at wavelengths above 440 nm with a lower peak at 560 nm, and then increased steadily up to 560 nm. Although all ranges from 380 to 760 nm could be used for broth microdilution testing, we ascertained that the optimal wavelengths would be between 600 and 700 nm because the differences were exceedingly larger after 600 nm.
DISCUSSION
In vitro antifungal susceptibility testing is influenced by a number of technical variables, including inoculum Fig. 3. Absorbance spectrum curves according to wavelength of
five type strains after incubation at 35°C for 48 hr.
Abbreviation: See Fig. 1.
OD
1.2
1
0.8
0.6
0.4
0.2
0
380 430 480 530 580 630 680 730
Wavelength (nm)
Candida parapsiolosis (ATCC22019) Candida albicans (ATCC90028)
Candida albicans (ATCC64550) Candida krusei (ATCC6258)
Candida tropicalis (ATCC20138) Blank
Fig. 4. Difference between half OD of growth control and the OD of the blank control.
Abbreviation: See Fig. 1.
OD
0.6
0.5
0.4
0.3
0.2
0.1
0
380 430 480 530 580 630 680 730
Wavelength (nm)
Candida parapsiolosis (ATCC22019) Candida albicans (ATCC90028)
Candida albicans (ATCC64550) Candida krusei (ATCC6258)
Candida tropicalis (ATCC20138)
size and preparation, medium formulation and pH, dura- tion and temperature of incubation, and the criterion used for MIC endpoint determination [16, 17]. This has led to increasing standardization of the reference methods for Candidaspecies in CLSI M27-A2 published in 2002, and for both Candidaspecies andC. neoformansin the third revised CLSI M27-A3 published in 2008 [4, 5]. These me- thods have improved the reproducibility of in vitro sus- ceptibility data and facilitated the establishment of inter- pretive breakpoints for antifungal agents.
Traditionally, the final MIC value is determined at the endpoint showing a prominent decrease in turbidity. How- ever, this technique introduces a subjective decision that causes variable results from person to person and bet- ween laboratories [18]. To overcome this limitation, sev- eral modifications have been adopted as broth-based alter- native approaches that may better serve practical clini- cal laboratory needs; such as spectrophotometric method [14, 15], colorimetric method [11-13], flow cytometry [6, 7], and E test [8-10]. Among these, the spectrophotometric reading of broth microdilution tests provides a more accu- rate and objective result and eliminates the subjective judgments that can confuse visual assessment of MIC end- points [15]. Consequently, the broth microdilution method with spectrophotometric reading, which provided the least variable results among the different laboratories, is includ- ed in the CLSI as a reference method for the antifungal susceptibility testing of yeasts. The method has been in common use for several years.
It is important to select the optimal wavelength when spectrophotometry is used. However, in previous articles, the wavelength was diverse: 405 nm [15, 19], 450 nm [20], 492 nm [14], 530 nm [21, 22], and 570 nm [23]. There was no reason explained for the selection of a specific wave- length. Also, there has been no recommendation in the CLSI guideline for a standard wavelength. So, we mea- sured the ODs of microplate wells at 5-nm intervals with- in the range of 380-760 nm, an area of visible light, by spectrophotometer to assess the optimal wavelength for MIC endpoint determination.
The blank control well contained only broth medium.
The OD of this control is the background value, so the lower OD is more appropriate in microdilution susceptibil- ity testing with spectrophotometric reading. In this study, the continuous OD curve of the blank control revealed a parabola shape with two peaks and decreased gradually with increasing wavelength. The continuous OD curve of the antifungal agent wells without yeast inocula closely resembled the pattern of the blank control. The ODs of flucytosine and ketoconazole were slightly greater than those of the blank controls. This could be caused by the color, the constituent, and the solvent of antifungal agents.
We believed that this would not influence the determina- tion of MIC because the increase is minute compared with those of the growth controls containing yeast. However, it could influence the final results if the OD difference between the well with a 50% decrease in growth and the blank control is small. We considered this point when selecting the optimal wavelength.
The growth control of five type strains revealed two characteristic patterns of the OD curves. We could not determine why these differences were observed, although we thought that it could be secondary to the difference of growth occasioned by various factors according to Can- didaspecies. However, for all type strains, the difference between the half OD of growth control and the OD of the blank control showed the same pattern. It decreased slight- ly to 435 nm, the lowest OD value. After that, the ODs increased gradually and were steady above 590 nm. If the OD of the growth control is sufficiently high, any wave- length between 380 nm and 760 nm could be used for sus- ceptibility testing; however, if the OD of the growth con- trol is low, the determination of the MIC could be difficult, and we should consider the influences of the blank con- trol and the antifungal agents.
In conclusion, we suggest that the range between 600 nm and 700 nm is the optimal wavelength to determine the MIC, because the OD of the blank control well was steady and the lowest, and the difference between the OD of the growth control and that of the blank was the high- est at this range of wavelength.
REFERENCES
1. Neely MN and Ghannoum MA. The exciting future of antifungal therapy. Eur J Clin Microbiol Infect Dis 2000;19:897-914.
2. Pfaller MA, Jones RN, Doern GV, Sader HS, Messer SA, Houston A, et al. Bloodstream infections due to Candida species: SENTRY antimicrobial surveillance program in North America and Latin America, 1997-1998. Antimicrob Agents Chemother 2000;44:747-51.
3. Rex JH, Pfaller MA, Walsh TJ, Chaturvedi V, Espinel-Ingroff A, Ghan- noum MA, et al. Antifungal susceptibility testing: practical aspects and current challenges. Clin Microbiol Rev 2001;14:643-58.
4. Clinical and Laboratory Standards Institute. Reference method for broth dilution antifungal susceptibility testing of yeasts; approved standard-second edition. CLSI document M27-A2. 2nd ed. Wayne, PA: Clinical and Laboratory Standards Institute, 2002.
5. Clinical and Laboratory Standards Institute. Reference method for broth dilution antifungal susceptibility testing of yeasts; approved standard-third edition. CLSI document M27-A3. 3rd ed. Wayne, PA:
Clinical and Laboratory Standards Institute, 2008.
6. Pina-Vaz C, Costa-de-Oliveira S, Rodrigues AG, Espinel-Ingroff A.
Comparison of two probes for testing susceptibilities of pathogenic yeasts to voriconazole, itraconazole, and caspofungin by flow cytom- etry. J Clin Microbiol 2005;43:4674-9.
7. Chaturvedi V, Ramani R, Pfaller MA. Collaborative study of the NCCLS and flow cytometry methods for antifungal susceptibility testing of Candida albicans. J Clin Microbiol 2004;42:2249-51.
8. Pfaller MA, Boyken L, Messer SA, Tendolkar S, Hollis RJ, Diekema DJ. Evaluation of the etest method using Mueller-Hinton agar with glucose and methylene blue for determining amphotericin B MICs for 4,936 clinical isolates of Candida species. J Clin Microbiol 2004;42:
4977-9.
9. Park JY, Shin JH, Uh Y, Kim EC, Kee SJ, Kim SH, et al. In vitro am- photericin B susceptibility of Korean bloodstream yeast isolates as- sessed by the CLSI broth microdilution method, Etest, and Minimum fungicidal concentration test. Korean J Lab Med 2008;28:346-52. (박 지영, 신종희, 어영, 김의종, 기승정, 김수현등. CLSI 액체배지미량희석 법, Etest 및 Minimum Fungicidal Concentration 검사에의한국내혈 액에서 분리된 효모균의 시험관 내 Amphotericin B 내성 성적. 대한진 단검사의학회지 2008;28:346-52.)
10. Wanger A, Mills K, Nelson PW, Rex JH. Comparison of Etest and National Committee for Clinical Laboratory Standards broth mac-
rodilution method for antifungal susceptibility testing: enhanced ability to detect amphotericin B-resistant Candida isolates. Antimi- crob Agents Chemother 1995;39:2520-2.
11. Lopez-Jodra O, Torres-Rodriguez JM, Mendez-Vasquez R, Ribas- Forcadell E, Morera-Lopez Y, Baro-Tomas T, et al. In vitro suscepti- bility of Cryptococcus neoformans isolates to five antifungal drugs using a colorimetric system and the reference microbroth method. J Antimi- crob Chemother 2000;45:645-9.
12. Shin JH, Choi JC, Lee JN, Kim HH, Lee EY, Chang CL. Evaluation of a colorimetric antifungal susceptibility test by using 2,3-diphenyl- 5-thienyl-(2)-tetrazolium chloride. Antimicrob Agents Chemother 2004;48:4457-9.
13. To WK, Fothergill AW, Rinaldi MG. Comparative evaluation of macrodilution and alamar colorimetric microdilution broth meth- ods for antifungal susceptibility testing of yeast isolates. J Clin Micro- biol 1995;33:2660-4.
14. Pfaller MA, Messer SA, Coffmann S. Comparison of visual and spec- trophotometric methods of MIC endpoint determinations by using broth microdilution methods to test five antifungal agents, includ- ing the new triazole D0870. J Clin Microbiol 1995;33:1094-7.
15. Arthington-Skaggs BA, Lee-Yang W, Ciblak MA, Frade JP, Brandt ME, Hajjeh RA, et al. Comparison of visual and spectrophotomet- ric methods of broth microdilution MIC end point determination and evaluation of a sterol quantitation method for in vitro suscepti- bility testing of fluconazole and itraconazole against trailing and nontrailing Candida isolates. Antimicrob Agents Chemother 2002;46:
2477-81.
16. Pfaller MA, Rex JH, Rinaldi MG. Antifungal susceptibility testing:
technical advances and potential clinical applications. Clin Infect Dis 1997;24:776-84.
17. Rex JH, Pfaller MA, Galgiani JN, Bartlett MS, Espinel-Ingroff A, Ghannoum MA, et al. Development of interpretive breakpoints for antifungal susceptibility testing: conceptual framework and analy- sis of in vitro-in vivo correlation data for fluconazole, itraconazole, and Candida infections. Subcommittee on Antifungal Susceptibility Testing of the National Committee for Clinical Laboratory Stan- dards. Clin Infect Dis 1997;24:235-47.
18. Hawser SP, Norris H, Jessup CJ, Ghannoum MA. Comparison of a 2,3-bis(2-methoxy-4-nitro-5-sulfophenyl)-5-[(phenylamino)carbonyl]- 2H-t etrazolium hydroxide (XTT) colorimetric method with the stan- dardized National Committee for Clinical Laboratory Standards
method of testing clinical yeast isolates for susceptibility to antifun- gal agents. J Clin Microbiol 1998;36:1450-2.
19. Yi JY, Shin JH, Lee K, Yong D, Chae MJ, Suh SP, et al. Evaluation of spectrophotometric broth microdilution method to determine the fluconazole MIC of the Candida species. Korean J Lab Med 2002;22:
253-9. (이지연, 신종희, 이경원, 용동은, 채명종, 서순팔 등. Candida 균 종의 Fluconazole 감수성검사를위한 Spectrophotometric Broth Micro- dilution법의평가. 대한진단검사의학회지 2002; 22:253-9.)
20. Chryssanthou E and Cuenca-Estrella M. Comparison of the Anti- fungal Susceptibility Testing Subcommittee of the European Com- mittee on Antibiotic Susceptibility Testing proposed standard and the E-test with the NCCLS broth microdilution method for voricona- zole and caspofungin susceptibility testing of yeast species. J Clin
Microbiol 2002;40:3841-4.
21. Moore CB, Walls CM, Denning DW. Comparison of three methods for in vitro susceptibility testing of Candida species with flucytosine.
J Antimicrob Chemother 2003;51:297-304.
22. Cuenca-Estrella M, Lee-Yang W, Ciblak MA, Arthington-Skaggs BA, Mellado E, Warnock DW, et al. Comparative evaluation of NCCLS M27-A and EUCAST broth microdilution procedures for antifungal susceptibility testing of Candida species. Antimicrob Agents Chemoth- er 2002;46:3644-7.
23. Matar MJ, Ostrosky-Zeichner L, Paetznick VL, Rodriguez JR, Chen E, Rex JH. Correlation between E-test, disk diffusion, and microdi- lution methods for antifungal susceptibility testing of fluconazole and voriconazole. Antimicrob Agents Chemother 2003;47:1647-51.