Transl Clin Pharmacol
TCP
http://dx.doi.org/10.12793/tcp.2016.24.1.372016;24(1):37-42
HPLC-UV method for the simultaneous determinations of ascorbic acid and
dehydroascorbic acid in human plasma
Yunjeong Kim and Min-Gul Kim*
Clinical Pharmacology Unit and Biomedical Research Institute, Chonbuk National University Hospital, Jeonju 54907, Korea
*Correspondence: M. G. Kim; Tel: +82-63-259-3480, Fax: +82-63-274-5546, E-mail: [email protected]
A high performance liquid chromatography (HPLC) paired with UV-vis detection method to de- termine ascorbic acid and its oxidation product, dehydroascorbic acid, in human plasma was devel- oped. Ascorbic acid in human plasma was extracted and stabilized using 10% metaphosphoric acid, and was analyzed by a Symmetry C18 column with 5 mM Hexadecyltrimethylammonium bromide and 50 mM KH2PO4 solution as the mobile phase (1.0 mL/min flow rate). Isoascorbic acid served as the internal standard and ultraviolet detector wavelength was 254 nm and 265 nm. Dehydroascor- bic acid concentration was calculated from the differences in ascorbic acid concentration before and after reduction by dithiothreitol reagent. Quantification for ascorbic acid in human plasma was linear from 1–100 μg/mL. The inter- and intra-day precisions and accuracy were determined and the results were found to be within ±15%. This method was successfully applied to a human phar- macokinetic study of ascorbic acid as well as dehydroascorbic acid after oral administration of 4,000 mg vitamin C tablets to healthy Korean volunteers.
Introduction
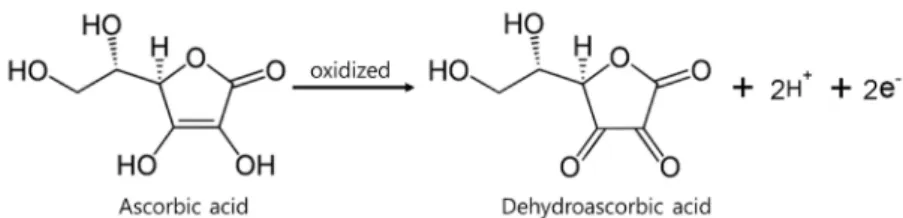
Vitamin C, a naturally occurring compound, plays an essential role in the human body and possesses a variety of biological, pharmaceutical, and dermatological functions. Vitamin C is present in human blood at an average concentration of 50–100 μM, and at least 95% of that is typically in the reduced ascorbic acid (AA) form while the remaining 5% is in the oxidized dehy- droascorbic acid (DHAA) form (Fig. 1).[1]
AA is a small and water-soluble antioxidant found in human plasma and is of major importance for protection against dis- eases caused by oxidative stress.[2] DHAA is also a compound of interest for its role in normal cellular homeostasis.[3] Fur- thermore, DHAA is well known to exhibit an antiscorbutic ef- fect (as does AA).[4] DHAA concentrations in plasma are low, which is known to be related to rapid tissue uptake and the ac- tivity of DHAA reductase.[1] This enzyme activity in cells is de- pendent on both AA and glutathione, the dominant intracellu- lar reductant.[5] Low plasma AA concentrations could possibly
lead to the impaired transport of DHAA, impaired reduction of DHAA back to AA, or both.[6] Moreover, the ratio of DHAA to AA concentrations is known to be a marker of oxidative stress.
[7] The detection of AA and DHAA at low concentrations in human blood is very important for the determination of the vi- tamin’s biochemical functions. However, the accurate detection of AA is not easy because it is very unstable in the presence of air, moisture, light, heat, metal ions, oxygen, or basic media, and it easily decomposes into biologically inactive compounds, such as 2,3-diketo-L-gulonic acid, oxalic acid, L-threonic acid, and L- xylonic acid.
AA is typically detected using a reversed-phase high perfor- mance liquid chromatography and ultraviolet detector (HPLC- UV) system at the wavelengths of 265 nm or 240 nm. Although several indirect methods are available for the measurement of AA, they generally have low specificity. Although the direct measurement of DHAA has been demonstrated, the described, indirect methods use highly sensitive HPLC electrochemical detector (ECD) equipment.[8-11] The assessment of DHAA concentration is based upon the difference between AA and to- tal AA concentrations in human plasma.[12] For these reported methods,[8,10,11,13] total AA is estimated after the reduction of DHAA to AA, and DHAA is then calculated from the dif-
Copyright © 2016 Translational and Clinical Pharmacology
It is identical to the Creative Commons Attribution Non-Commercial License (http://creativecommons.org/licenses/by-nc/3.0/).
This paper meets the requirement of KS X ISO 9706, ISO 9706-1994 and ANSI/NISO Z.39.48-1992 (Permanence of Paper).
Received 3 Nov 2015 Revised 16 Dec 2015 Accepted 21 Jan 2016
Keywords
Ascorbic acid, Dehydroascorbic acid, Dithiothreitol, HPLC, Method validation pISSN: 2289-0882 eISSN: 2383-5427
ORIGINAL ARTICLE
TCP
Transl Clin PharmacolSimultaneous determination of ascorbic acid and dehydroascorbic acid
ference between total AA and free AA (reduced form) that was originally present in the sample.
Numerous analytical methods, including spectrophotome- try,[8] amperometry[10,13] and voltammetry[14] have been de- veloped for the determination of AA in foods, pharmaceuticals, and biological samples. AA is an electroactive species that has been easily detected using amperometric and coulometric sys- tems. However, DHAA is difficult to detect by electrochemistry because of its low electroactivity. Moreover, it has a weak absor- bance in the UV region. Therefore, electrochemical detection of DHAA is usually carried out by first reducing DHAA to AA with dithiothreitol (DTT), in order to calculate the difference of AA concentrations before and after the reduction of DHAA.
[12,15,16]
The aim of this study was to develop and validate an HPLC method for the simultaneous determinations of AA and DHAA in human plasma with rapid and simple sample preparation.
This method should be applicable to the determination of AA in human pharmacokinetic studies.
Methods
Chemicals and Reagents
L-ascorbic acid was purchased from Shinyo Pure Chemical Co. (Osaka, Japan). D-isoascorbic acid, metaphosphoric acid (HPO3), potassium dihydrogenphosphate (KH2PO4), hexadecyl trimethyl ammonium bromide (HTAB), and dithiothreitol reagent (DTT) were purchased from Sigma-Aldrich (St. Louis, MO, USA). Methanol and water were purchased at the highest grade available from Fisher Scientific (Fair Lawn, NJ, USA).
All other reagents were of analytical grade and were purchased from Sigma-Aldrich.
HPLC conditions
Chromatographic analysis was performed using an HPLC system (GILSON, Wisconsin, USA) with 254 nm and 265 nm wavelengths. Chromatographic separations were performed using a C18 (symmetry® 4.6 μm × 280 mm, particle size 5 μm) (Waters, Milford, MA, USA). The mobile phase consisted of 5 mM HTAB + 50 mM KH2PO4. The flow rate was kept constant at 1.2 mL/min.
Preparation of standard solution and determination of AA
Standard stock solutions of AA and D- isoascorbic acid were prepared as internal standards (IS) in 50% methanol at 1 mg/
mL each. The working solutions of AA were diluted with 50% methanol to pre- pare standards of 10, 20, 40, 100, 500, 800, and 1,000 μg/mL. Human plasma was depleted of AA by leaving it on the bench for 96 h as described in a study by Karlsen et al.[17] The plasma calibration curves were prepared at concentrations of 1, 2, 4, 10, 50, 80, and 100 μg/mL by spik- ing 400 μL of blank plasma (AA free status) with 50 μL of each working standard, and 50 μL of the IS (100 μg/mL) of each ana- lyte was added at the appropriate concentration. The stability of AA in blood is a very critical issue because it rapidly degrades to DHAA, thus metaphosphoric acid was employed as a very ef- ficient stabilizer and protein precipitator for the AA analysis.[18]
Five hundred microliter of 10% metaphosphoric acid (HPO3) was carefully added to each sample. Then, samples were vor- texed for 1 min and centrifuged at 12,000 rpm for 10 min at 4°C.
The supernatants were transferred to injection vials, and 10 μL were injected into an HPLC system for analysis.
Determination of total AA
The blank plasma (400 μL) was subjected to reduction with the additions of 50 μL of working standard solution (addition of 2 mM DTT at pH 7.8) and 50 μL of IS. The solution reacted for 20 min at room temperature in the dark. Five hundred microli- ter of 10% HPO3 was carefully added to each sample. Then, the samples were vortexed for 1 min and centrifuged at 12,000 rpm for 10 min at 4°C. The supernatants were transferred to injec- tion vials, and 10 μL was used for chromatographic analysis.
The concentration of DHAA was determined by subtracting the concentration of AA from the total AA concentration.
Method Validation
The method for the determination of AA in human plasma was validated by using spiked solutions of AA in AA-depleted human heparin plasma. The method validation parameters studied were specificity, limit of detection (LOD), limit of quan- tification (LOQ), linearity, precision, accuracy, and recovery.
The specificity of the method was investigated by comparing chromatograms of extracted blank plasma obtained from six different human plasma samples spiked with AA and IS to ensure that they were free of interference around the retention time of AA. The LOD was determined by diluting solutions of known concentration until the response was three times the noise (S/N 3), and the LOQ was defined as the lowest concen- tration that can be calculated on the basis of minimal accepted value of S/N 10. Linearity of the method was determined with a calibration curve constructed using seven concentration points.
Figure 1. Chemical structure of ascorbic acid and dehydroascorbic acid as depicted through a redox reaction
TCP
Transl Clin Pharmacol
Calibration curves were constructed by plotting the response ra- tios (ratios of peak areas of analytes to IS) versus concentration of each analyte using a linear least squares regression. The preci- sion study was carried out based on injection repeatability and analysis repeatability of spiked plasma samples. Injection repeat- ability was determined by repeated injections of plasma samples spiked with standard mixtures equivalent to each analyte into the HPLC system. The accuracy of the method was defined by replicate analysis of samples containing known amounts of the analyte. The deviation of the mean from the true value serves as the measure of accuracy. The recovery of the method was deter- mined as the ratio of the peak area of extracted samples after a full assay to that of a direct injection of equivalent concentration (in 50% methanol). The intra-day precision and accuracy were determined within one day by analyzing five replicate samples.
The inter-day precision and accuracy were determined on five separate days at identical concentrations.
Applications in pharmacokinetic studies
The pharmacokinetic study followed the principles of the Dec- laration of Helsinki, and was authorized by the Institution Eth- ics Committee of Chonbuk National University Hospital (IRB No. 2014-09-022). Healthy male volunteers aged ≥19 and ≤55 years at screening were included in the study. Normal haema- tology, blood chemistry, and urinalysis results were required at screening. Subjects with evidence of drug abuse, alcoholism, or any cardiac condition or illness putting the subject at risk were not allowed to be enrolled. The bioanalytical method was ap- plied to study the pharmacokinetics of AA and DHAA in three healthy subjects after administration of 4000 mg of vitamin C tablet. Blood samples (4 mL) were collected into heparinized tubes at pre-dose (0 h) and at 0.5, 1, 1.5, 2, 2.5, 3, 3.5, 4, 5, 6, 7, and 8 h post-dosing. Then plasma was immediately separated by centrifuging at 3,000 rpm for 10 min. The obtained plasma was stored frozen at -80°C until analysis.
Results
Sample preparation
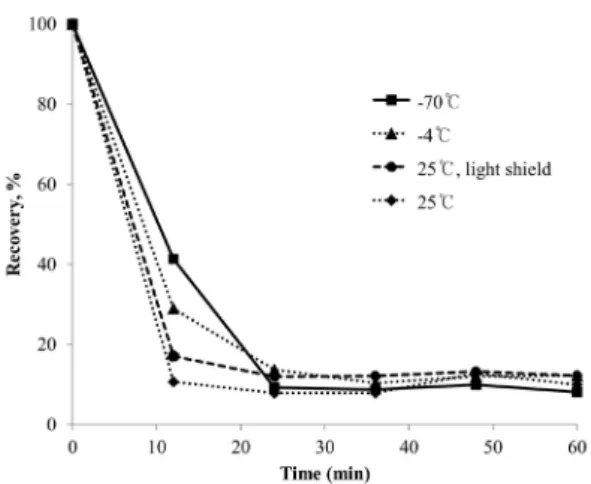
AA stability tests were conducted for the use of human plasma.
Plasma samples were stored at -70°C, -4°C, 25°C, and 25°C while masked from light masked during 60 min periods. The results showed that at -70°C, the highest relative recovery was achieved after around 10 min (Fig. 2). However, all trends in- dicated the instability of AA in plasma with heat and light over time; therefore, we attempted the sample preparation of AA in plasma after removing from storage at -70°C in each case.
To prevent oxidation of AA in plasma samples, the addition of a stabilizer like HPO3 is crucial, and it should be added immedi- ately after blood sampling (especially for clinical studies).
Several concentrations of DTT (reduction agent) have been employed: 2 mM, 4 mM, and 8 mM. Since similar total AA concentrations were determined for each DTT concentration,
Figure 2. Recovered ascorbic acid contents in standard solutions stored at -70°C (■), -4°C (▲), 25°C (◆) and light shielded at 25°C (●)
Figure 3. Chromatogram of ascorbic acid and internal standards in human plasma. HPLC conditions: mobile phase, 5 mM HTAB + 50 mM KH2PO4; col- umn, C18 column (symmetry® 4.6 μm × 280 mm, 5 μm particle size, Waters, USA); flow rate, 1.2 mL/min; UV detection wavelength, 254 and 265 nm.
Yunjeong Kim and Min-Gul Kim
TCP
Transl Clin Pharmacol2 mM of DTT was used for all analyses. The amount of DHAA was calculated from the following difference: Total AA minus reduced AA.
Chromatographic separation
A representative HPLC chromatogram obtained from a hu- man plasma sample is shown in Figure 3. The identification of the corresponding peaks was performed by comparing the retention times in the samples with those of the separately run pure standards under the same analytical conditions.
System suitability
The lowest limit of quantification for each validated batch (1 μg/mL, LLOQ) of the samples was measured at least three times, and the system suitability was established as being less than 20% for the measured concentration deviation to average concentration ratio (coefficient variance, CV).
Linearity
The calibration curve of the blank, zero-blank (internal stan- dard added), and seven standards ranging with 1-100 μg/mL of concentration had a correlation coefficient (r2) of 0.999, which indicated excellent linearity (Fig. 4).
Specificity
The retention times (RT) of AA and IS were about 9 min and 12 min, respectively. Blank plasma samples of different origins (six different blank samples, one zero-blank sample, and a LLOQ sample) were analyzed, and no interference was intro- duced by human plasma around the retention time of AA and IS.
Carryover
We investigated the possibility of carryover (order effects) be- tween evaluations of the LLOQ, blank, and upper limit of quan- tification (ULOQ = 100 μg/mL) samples. No carryover effects
were observed.
Accuracy, precision, and limit of quantification for concentration
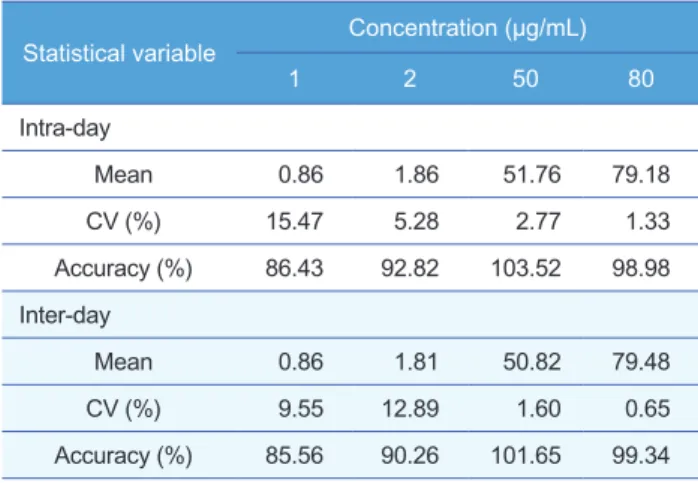
Accuracy and precision were determined using four concen- trations (1, 2, 50, 80 μg/mL) of the quality control (QC) samples for the intra-day and inter-day; measurements were performed five times for each. The accuracy (average % and its CV) was defined as the average and CV of the ratios of measured con- centrations (calculated using the calibration curve) divided by the nominal concentrations. Precisions within ±15% and accuracies within 85–115% were established as qualifying con- ditions.[19] At the limit of quantification concentration (1 μg/
mL), a separate set of qualifying conditions were established: a precision within ±20% and accuracy within 80–120%. The ac- curacy and precision of intra-day measurements of the analyti- cal method were 86.43–103.52% and 1.33–15.47%, respectively.
The accuracy and precision of inter-day measurements were 85.86–101.65% and 0.65–12.89%, respectively (Table 1).
Recovery
AA recovery tests were performed for three QC concentra- tions, and the absolute recovery of IS (absolute recovery) was
Figure 4. Standard calibration curve of ascorbic acid in human plasma
Table 1. Intra- and inter-day precision and accuracy (n=5) of ascorbic acid QC samples in human plasma
Statistical variable Concentration (μg/mL)
1 2 50 80
Intra-day
Mean 0.86 1.86 51.76 79.18
CV (%) 15.47 5.28 2.77 1.33
Accuracy (%) 86.43 92.82 103.52 98.98 Inter-day
Mean 0.86 1.81 50.82 79.48
CV (%) 9.55 12.89 1.60 0.65
Accuracy (%) 85.56 90.26 101.65 99.34
Table 2. Intra- and inter-day recovery of ascorbic acid in human blank plasma QC samples (n=5)
Concentration (μg/mL)
Recovery (%, Mean±S.D) Intra-day Inter-day
1 106.00±3.20 98.98±6.52
2 108.30±4.39 110.05±12.84
50 118.41±3.44 109.41±8.93
80 100.89±2.69 104.01±2.72
Simultaneous determination of ascorbic acid and dehydroascorbic acid
TCP
Transl Clin Pharmacol
also carried out. The recovery of AA and internal standard were 98.98-118.41% and 99.99%, respec- tively (Table 2).
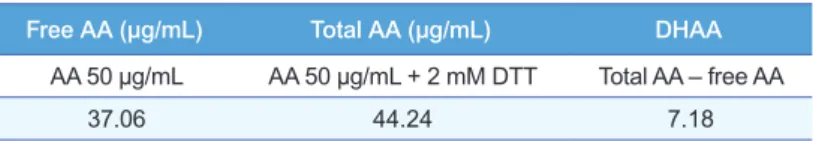
DHAA concentration
The concentration of DHAA was calculated by subtracting the initial AA concentration from the total AA concentration after reductive treatment of 50 μg/mL of AA (Table 3). These results demonstrate that it is possible to utilize the described HPLC-UV method to accurately determine the amount of AA and DHAA in plasma samples, which contradicts assertions made by Li and Franke that HPLC-UV is not suitable for AA determination in plasma.[10]
Since the total time required for the analysis of one sample (including the sample preparation) was less than 15 minutes, further improvement in the analyti- cal reliability is expected in an AA assay.
Pharmacokinetic study
The validated HPLC method has been success- fully applied to a pharmacokinetic study of AA and DHAA after oral administration of 4,000 mg AA tablet to three healthy Korean volunteers with age of (27.67±8.96) years, weight of (61.17±16.86) kg, height of (164.00±12.88) cm, and BMI of (22.37±2.45) kg/m2. The mean plasma concentration-time pro- files of AA and DHAA are shown in Figure 5 and the related pharmacokinetic parameters calculated using Phoenix WinNonlin 6.3 software (Pharsight Corporation, Mountain View, CA, USA) are listed in Table 4. As a results, Tmax (2.67±0.58 h) of the AA was consistent with those reported before (Tmax: 3 h).[20]
Unlike previous reports on the assays of DHAA us- ing HPLC-UV or HPLC-ECD,[13,21,22] the HPLC- UV method in this report was applied for the human pharmacokinetic study of AA and DHAA.
Discussion
A validated and rapid isocratic HPLC-UV method was successfully developed for the simultaneous determination of AA and DHAA levels in human plasma. The method offers good precision, accuracy, and reproducibility for the determination of AA within a 10 min window and is well suited to rou- tine measurements and/or high-throughput clinical analysis. The LOQ for AA was 1 μg/mL. The use of a standard reversed-phase column enabled good per- formance for the elution and separation of AA. The method involves a simple and cheap preparation step.
The validated method was successfully applied to the pharmacokinetic study of AA and DHAA in healthy subjects after administration of 4,000 mg of vitamin C.
Free AA (μg/mL) Total AA (μg/mL) DHAA
AA 50 μg/mL AA 50 μg/mL + 2 mM DTT Total AA – free AA
37.06 44.24 7.18
Table 3. Dehydroascorbic acid concentrations
Parameters AA DHAA
Cmax (ng/mL) 49.57±23.93 20.49±8.32
Tmax (h) 2.67±0.58 3.83±1.04
T1/2 (h) 7.12±3.79 4.65±1.27
AUClast (h*ng/mL) 270.02±159.71 115.11±61.42 AUCinf (h*ng/mL) 575.18±527.74 187.57±99.99 Table 4. Pharmacokinetic parameters for ascorbic acid and dehydroascorbic acid in human plasma (mean±SD) obtained after administration of vitamin C 4,000 mg
Figure 5. Mean plasma concentration-time profiles of ascorbic acid (A) and dehy- droascorbic acid (B)
Yunjeong Kim and Min-Gul Kim
TCP
Transl Clin PharmacolAcknowledgements
This paper was supported by funding from the Global Center of Excellence in Early Clinical Trials of Chonbuk National Uni- versity Hospital.
Conflict of interest
The authors have no conflicts of interest to disclose.
References
1. Rose RC. Transport of ascorbic acid and other water-soluble vitamins.
Biochim Biophys Acta 1988;947:335-366.
2. Torres P, Galleguillos P, Lissi E, López-Alarcón C. Antioxidant capacity of human blood plasma and human urine: simultaneous evaluation of the ORAC index and ascorbic acid concentration employing pyrogallol red as probe. Bioorg Med Chem 2008;16:9171-9175. doi: 10.1016/j.bmc.2008.09.
024.
3. Deutsch JC. Dehydroascorbic acid. J Chromatogr A 2000;881:299-307.
4. Fox FW, Levy LF. Experiments confirming the antiscorbutic activity of de- hydroascorbic acid and a study of its storage and that of ascorbic acid by the guinea-pig at different levels of intake. Biochem J 1936;30:211-217.
5. Wang Y, Kashiba M, Kasahara E, Tsuchiya M, Sato EF, Utsumi K, et al.
Metabolic cooperation of ascorbic acid and glutathione in normal and vita- min C-deficient ODS rats. Physiol Chem Phys Med NMR 2001;33:29-39.
6. Lykkesfeldt J, Loft S, Nielsen JB, Poulsen HE. Ascorbic acid and dehydro- ascorbic acid as biomarkers of oxidative stress caused by smoking. Am J Clin Nutr 1997;65:959-963.
7. Lykkesfeldt J, Loft S. Poulsen HE. Determination of ascorbic acid and de- hydroascorbic acid in plasma by high-performance liquid chromatography with coulometric detection-are they reliable biomarkers of oxidative stress?
Anal Biochem 1995;229:329-335.
8. Iriyama K, Yoshiura M, Iwamoto T, Ozaki Y. Simultaneous determination of uric and ascorbic acids in human serum by reversed-phase high-perfor- mance liquid chromatography with electrochemical detection. Anal Bio- chem 1984;141:238-243.
9. Khan A, Khan MI, Iqbal Z, Shah Y, Ahmad L, Nazir S, et al. A new HPLC method for the simultaneous determination of ascorbic acid and aminothi- ols in human plasma and erythrocytes using electrochemical detection.
Talanta 2011;84:789-801. doi: 10.1016/j.talanta.2011.02.019.
10. Li X, Franke AA. Fast HPLC-ECD analysis of ascorbic acid, dehydro-
ascorbic acid and uric acid. J Chromatogr B Analyt Technol Biomed Life Sci 2009;877:853-856. doi: 10.1016/j.jchromb.2009.02.008.
11. Watson DG, Iqbal Z, Midgley JM, Pryce-Jones H, Morrison L, Dutton GN, et al. Measurement of ascorbic acid in human aqueous humour and plas- ma and bovine aqueous humour by high-performance liquid chromatogra- phy with electrochemical detection. J Pharm Biomed Anal 1993;11:389- 392.
12. Schell DA, Bode AM. Measurement of ascorbic acid and dehydroascorbic acid in mammalian tissue utilizing HPLC and electrochemical detection.
Biomed Chromatogr 1993;7:267-272.
13. Umegaki K, Inoue K, Takeuchi N, Higuchi M. Improved method for the analysis of ascorbic acid in plasma by high-performance liquid chromatog- raphy with electrochemical detection. J Nutr Sci Vitaminol (Tokyo) 1994;
40:73-79.
14. Margolis SA, Davis TP. Stabilization of ascorbic acid in human plasma, and its liquid-chromatographic measurement. Clin Chem 1988;34:2217- 2223.
15. Mannino S, Cosio MS. Determination of ascorbic acid in foodstuffs by microdialysis sampling and liquid chromatography with electrochemical detection. Analyst 1997;122:1153-1154.
16. Nagy E, Degrell I. Determination of ascorbic acid and dehydroascorbic acid in plasma and cerebrospinal fluid by liquid chromatography with elec- trochemical detection. J Chromatogr 1989;497:276-281.
17. Karlsen A, Blomhoff R, Gundersen TE. High-throughput analysis of vita- min C in human plasma with the use of HPLC with monolithic column and UV-detection. J Chromatogr B Analyt Technol Biomed Life Sci 2005;824:
132-138.
18. Burini G. Development of a quantitative method for the analysis of total L-ascorbic acid in foods by high-performance liquid chromatography. J Chromatogr A 2007;1154:97-102.
19. Guidance for industry: bioanalytical method validation. In. Edited by U.S.
Department of Health and Human Services FaDA, Center for Drug Evalu- ation and Research (CDER): Center for Biologics Evaluation and Re- search (CBER); May 2001.
20. Melethil S, Mason WD, Chang CJ. Dose-dependent absorption and ex- cretion of vitamin C in humans. Int J Pharm 1986;31:83-89.
21. Dhariwal KR, Washko PW, Levine M. Determination of dehydroascorbic acid using high-performance liquid chromatography with coulometric elec- trochemical detection. Anal Biochem 1990;189:18-23.
22. Kim YJ, Ha N, Kim MG. Simultaneous determination of L-ascorbic acid and dehydroascorbic acid in human plasma. Analytical Methods 2015;7:
9206-9210.
Simultaneous determination of ascorbic acid and dehydroascorbic acid