Transl Clin Pharmacol
TCP
http://dx.doi.org/10.12793/tcp.2015.23.2.592015;23(2):59-65
Validation of a method for the determination of thiocyanate in human plasma by UV/VIS spectrophotometry and application
to a Phase I clinical trial of GDC-0425
Young G. Shin
1,*, Henri Meijering
2,*, Fred H. van Heuveln
2, Jaap Wieling
2, Jason Halladay
1, Srikumar Sahasranaman
1and Cornelis E.C.A. Hop
11Genentech Inc., 1 DNA way, South San Francisco, CA 94080, USA, 2QPS Netherlands B.V., Petrus Campersingel 123, 9713 AG Gron- ingen, The Netherlands. *Y.G. Shin and H. Meijering contributed equally to this paper.
*Correspondence: Y. G. Shin; Tel: +82-42-821-5931, Fax: +82-42-821-5566, E-mail: [email protected] Current address: College of Pharmacy, Chungnam National University, Daejeon 35015, Republic of Korea
The development and validation of a method for the determination of concentrations of thiocya- nate in human plasma are described here. A modified colorimetric method of Bowler was used with the following alteration in Monica Manual, Part III. In order to obtain the same sensitivity in low amounts of clinical samples, quartz SUPRASIL® micro cuvettes have been used. The quantitation range was between 25–500 µM. Accuracy and precision of the quality control samples, linearity of the calibration curve, dilution, spike recovery and stability under various conditions were evaluated in the validation of the method and all demonstrated acceptable results. All validation results met good laboratory practice acceptance and FDA requirements to be acceptable for application in clini- cal trials. The validated method has been used for a Phase I clinical study in cancer patients orally administered with either 60 mg or 80 mg of GDC-0425 containing a cyanide (CN-) group. The thio- cyanate levels from patients before and after drug administration showed no clinically significant differences.
Introduction
Thiocyanate, SCN-, is a normal physiological constituent of serum/plasma and a main metabolite of cyanide (CN-). It is also found in vegetables, seeds, and various other food products.[1]
The formation of thiocyanate is through enzymatic conversion of CN- by rhodanase and this constitutes an efficient detoxifica- tion pathway. Physiologic thiocyanate concentrations range from 50 to 500 μmol/L in humans depending on smoking status and food consumption.[2,3] It is well documented that exposure to tobacco smoking increases the endogenous levels of thiocya- nate because tobacco has a measurable amount of CN-.[4] Data from population studies showed that the majority of human subjects have endogenous thiocyanate levels that are below 150
μmol/L.[2] Under pharmacological conditions, such as sodium nitroprusside infusion, plasma thiocyanate can increase to a toxic level. Plasma thiocyanate levels of 1,000 μmol/L have been associated with mild neurological toxicity and levels between 3,000 μmol/L to 4,000 μmol/L are considered life-threatening.[4]
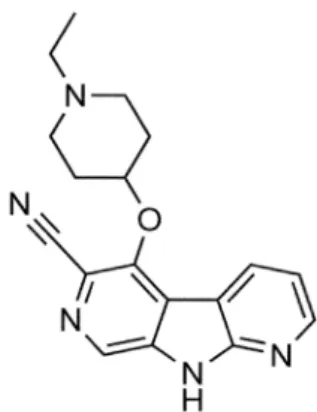
GDC-0425 (Fig. 1) is an orally bioavailable checkpoint kinase 1 (Chk1) inhibitor tested in a Phase I oncology study in combina- tion with gemcitabine. GDC-0425 enhances the efficacy of che- motherapeutic agents such as gemcitabine and AraC in a broad range of tumor xenograft models, including colon, pancreatic, breast, and acute myeloid leukemia. In vitro and in vivo studies were performed to investigate the metabolism of GDC-0425 in relevant species. In vivo pharmacokinetic (PK) studies were completed in mice, rats, dogs, and cynomolgus monkeys (Maca- ca fascicularis). Toxicokinetic (TK) evaluations were performed in association with toxicology studies in rats and cynomolgus monkeys (data not shown). These studies provided information to select rat and monkey as appropriate species for toxicology
Copyright © 2015 Translational and Clinical Pharmacology
It is identical to the Creative Commons Attribution Non-Commercial License (http://creativecommons.org/licenses/by-nc/3.0/).
This paper meets the requirement of KS X ISO 9706, ISO 9706-1994 and ANSI/NISO Z.39.48-1992 (Permanence of Paper).
Received 10 Aug 2015 Revised 21 Sep 2015 Accepted 5 Oct 2015
Keywords
Thiocyanate analysis, human plasma, GDC-0425,
checkpoint kinase 1 inhibitor pISSN: 2289-0882 eISSN: 2383-5427
ORIGINAL ARTICLE
TCP
Transl Clin PharmacolAnalysis of thiocyanate from GDC-0425 in Phase I trial
testing and to enable selection of an appropriate starting dose and regimen for clinical trials.
In a single dose rat mass balance study with radiolabeled GDC-0425, one of the drug-related metabolites identified in rat plasma was thiocyanate (S14CN-, thiocyanate), a metabo- lite of cyanide resulting from the cleavage of the N14C-C bond in the molecule. However, the overall contribution of drug- derived (radiolabeled) thiocyanate to the endogenous (cold) thiocyanate concentrations in rats was negligible. Compared to control rats, there was no increase in plasma thiocyanate levels in drug-treated rats or monkeys in the repeat-dose toxicology studies. Therefore, the metabolism to thiocyanate in humans is predicted to be minor and the amount of thiocyanate formed is predicted to be negligible compared with endogenous levels. As part of the pharmacokinetic and safety assessments, the concen- trations of thiocyanate were monitored before and after dosing in a clinical study of GDC-0425.
To evaluate the relationship between GDC-0425 and thiocya- nate levels, a bioanalytical method validated according to the FDA guidance[5] was considered. Several methods have been developed for the quantitation of thiocyanate or its signature metabolites using colorimetry (Monica Manual 1990), colorim- etry followed by ion-exchange chromatography on Amberlyst A21 resin,[6,7] gas chromatography-mass spectrometry[8] and ion chromatography.[9] Previous studies have reported the pros and cons of the colorimetric method which requires a signifi- cant amount of sample volume (0.5-2 mL) and time-consuming ion-exchange chromatography. The gas chromatography-mass spectrometric method can provide high sensitivity with a rela- tively small amount of sample volume. However, it was devel- oped for the indirect measurement of cyanide as a surrogate metabolite, 2-amonithiazoline-4-carboxylic acid. A specific and sensitive high-performance liquid chromatographic method was developed based on ion chromatography with ultraviolet detection.
Here we describe a rapid and robust method to determine the level of thiocyanate in 50 µL human plasma colorimetrically using a ferric-cyanate complex. Data are also presented illustrat-
ing the validation of the method for preclinical and clinical use for GDC-0425. Importantly, since thiocyanate is an endogenous compound, the calibration standards and quality control sam- ples were prepared in phosphate-albumin buffered saline (pH 7.2) (artificial plasma) that contained no detectable amounts of thiocyanate. Clinical application of this method to quantify thiocyanate levels in human plasma before and after adminis- tration of GDC-0425 is also presented here.
Methods
Chemicals and reagents
Sodium thiocyanate (ACS reagent grade, RM-1866, batch number: MKBD8928V, purity: 99.6%), used as certified refer- ence material, bovine serum albumin, ferric nitrate, sodium perchlorate, trichloroacetic acid, disodium phosphate, nitric acid, phosphoric acid, sodium chloride and sodium hydroxide were purchased from Sigma-Aldrich (Zwijndrecht, The Nether- lands). Ultrapure water from ELIX 10, Milli-Q advantage (A10) system was supplied by Millipore B.V. (Amsterdam, The Nether- lands). Human K2-EDTA plasma for the preparation of addition- al quality control samples was obtained from healthy volunteers.
All volunteers had good physical health as determined by history taking, physical examination and routine clinical tests. A distinc- tion was made between smokers and non-smokers. Phosphate- albumin buffered saline (pH 7.2) or ‘artificial plasma’ was used for the preparation of calibration samples and quality control samples. Artificial plasma was prepared by dissolving specified amounts of disodium phosphate, sodium chloride and bovine serum albumin in water and the pH was adjusted with diluted phosphoric acid or sodium hydroxide (0.1 mol/L) to pH = 7.4.
Instrumentation
The spectrophotometer used for this study was a Cecil CE 2041 UV/VIS spectrophotometer. An optimum wavelength of 459.4 nm was used for the determination of thiocyanate-ferric com- plex. A quartz SUPRASIL® micro cuvette (45x12.5x12.5 mm, Ø 2.5 mm) was used. Reference materials were weighed using a Mettler Toledo AT261 DeltaRange analytical balance and for the execution of the assay an Eppendorf 5810-R or 5417-C centrifuge and a Branson 2510 DTH ultrasonic bath (Rochester, USA) were used.
Preparation of calibration standards and quality control samples
A stock solution of SCN- (10.0 mmol/L) was prepared in water and used to prepare the calibration curve standards. A second stock solution was prepared from an independent weighing of the same master batch by a second analyst and was used to pre- pare the QC samples. Aliquots of the stock solutions were fur- ther diluted with water to obtain working standard solutions for the preparation of the calibration standards and quality control samples, respectively. One zero and eight non-zero calibration
Figure 1. Structure of GDC-0425.
TCP
Transl Clin Pharmacol
standards were prepared in the range of 25.0–500 µmol/L which is sufficient to cover the concentration range of SCN- in human.
Quality control samples were prepared at four concentration levels [LLOQ (25.0 µmol/L), QC Low (75.0 µmol/L), QC Med (250 µmol/L) and QC High (400 µmol/L)]. Since thiocyanate is an endogenous compound, the calibration standards and quality control samples were prepared in artificial plasma that contained no measureable amount of thiocyanate. Quality con- trol samples in plasma were prepared by adding thiocyanate working solutions to human K2-EDTA plasma at four levels (75.0; 250; 400 and 750 µmol/L). Plasma from non-smokers was used to minimize endogenous thiocyanate for the preparation of these plasma quality control samples.
Sample preparation
Human artificial and K2-EDTA plasma samples (50 µL) were processed by protein precipitation using 25 µL sodium per- chlorate (0.1 mol/L) and 25 µL trichloroacetic acid (20%). After sonication (5 minutes) the mixture was left on the bench for 15 minutes. Thereafter, the sample was centrifuged for 10 minutes at 14,000 rpm at ambient temperature using the 5417-C cen- trifuge. Subsequently, 50 µL of the supernatant was mixed with 25 µL of ferric nitrate solution (20.0 mg/mL) to form the ferric- cyanate complex. The absorption of the complex mixture was measured at 459.6 nm.
Calibration curve and linearity
For each validation run, a set of eight calibration standards in singlet was prepared freshly. From the first precision and accu- racy run, the relationship between the concentration and detec- tor response was established using absorption as response. The calibration curve was processed using linear regression (y = ax + b, with y being the absorbance and x the concentration) using a weighing factor of 1/concentration2. Each run included a blank artificial sample (zero sample), but this sample was not used to calculate the calibration curve parameters. For each calibration curve, the back-calculated concentrations (%bias) had to be within ± 20.0% for the lowest calibration standard and within
± 15.0% for other concentrations. In addition, the following acceptance criterion was used: at least 75% of the non-zero calibration standards with a minimum of six had to fulfill the criterion, including the lowest and highest calibration standard.
Sensitivity and limits of quantitation
The lower limit of quantitation (LLOQ) is the lowest amount of thiocyanate in a sample that can be quantified reliably with an acceptable precision and accuracy. The LLOQ was determined from the precision and accuracy experiments with the artificial plasma quality control samples. Thiocyanate concentrations are identifiable, discrete, and reproducible when a precision of 20.0% and accuracy of 80.0–120.0% of the nominal concentra- tion was obtained. The upper limit of quantitation (ULOQ) was determined from the calibration curve results. The highest ac-
cepted calibration standard was accepted as the higher limit of quantitation. Together with the LLOQ, the ULOQ determines the validated range.
Precision and accuracy
Precision and accuracy was demonstrated for the LLOQ, QC Low, QC Med and QC High quality control samples in artificial plasma, within a single run (repeatability or within-run preci- sion and accuracy) and between different runs (reproducibility or between-run precision and accuracy). For the (QC Low, QC Med and QC High) quality control samples in human K2- EDTA plasma, the endogenous level of thiocyanate in blank human K2-EDTA plasma was measured in advance to evaluate the accuracy and precision of these QC samples. Due to this reason, the LLOQ in the blank human K2-EDTA plasma was not evaluated. For the repeatability experiments, six aliquots of each quality control sample were analyzed in one single run.
The reproducibility of the method was determined at the indi- vidual quality control levels by six-fold analysis in three separate runs (including the run used for within-run precision and accu- racy). The results of the within-run experiments were reported separately from the results of the between-run experiments.
Both within-run and between-run precision were expressed as the coefficient of variation (CV%) and both within-run and between-run accuracy were reported as percent of the nominal value (%bias). Precision and accuracy of quality control samples had to be within |20.0|% at LLOQ level and within |15.0|% at all other levels.
Dilution Integrity
To justify the dilution of samples with concentrations higher than ULOQ, dilution experiments were performed with human K2-EDTA plasma samples (750 µmol/L) spiked 10 times the QC Low concentration. Six aliquots were diluted 10 times with artificial plasma and analyzed in one analytical run. After one analytical run the accuracy was reported as the percentage of the nominal value (%bias). The %bias was not allowed to exceed
|15.0|%. The within-run precision was expressed as the coeffi- cient of variation and was not allowed to exceed 15.0%.
Spike recovery
Spike recovery was used as a measure of selectivity. Since thiocyanate is an endogenous compound the method was con- fronted with the phenomenon of real-life samples not having a representative blank (analyte-free) sample. The spike recovery of thiocyanate in K2-EDTA human plasma was determined at three concentration levels (QC Low, QC Med and QC High) by six-fold in three analytical runs (n = 18 values). The spike recov- eries (SR) were calculated using:
SR(%) = 100 X Xblack+[X0] —Xblack X0
Young G. Shin, et al.
TCP
Transl Clin PharmacolAnalysis of thiocyanate from GDC-0425 in Phase I trial
where Xblack+[X0] represents the mean concentration of the blank samples with the known spiked concentration, Xblack represents the mean concentration of the blank samples, and X0 represents the added ‘theoretical’ concentration. The spike recovery was not allowed to exceed 85.0% and 115.0%.
Stability of study samples
The stability of the thiocyanate in human K2-EDTA plasma after repeated freezing (at least 16 hours at -15 – -25⁰C or -65 – -75⁰C) and thawing (unassisted at room temperature for at least two hours), the short-term room temperature stability (at least 24 hours), and the long-term stability (at least six months) were determined at two concentration levels and evaluated on the basis of accuracy (|15.0|%).
The stability of processed samples was assessed by measuring a processed sample after at least one day. The processed samples (until the ferric solution was added for coloring) were stored in the refrigerator (2–8⁰C) for at least one day. To enable evalu- ation of any trends over time within one run, quality control samples were assessed with a size equivalent to a prospective analytical run (± 4 hours). Quality control samples in artificial plasma and human K2-EDTA plasma were used for this evalua- tion.
Freshly processed quality control samples were analyzed to- gether with a freshly prepared calibration curve in a single run at room temperature (dark and day light). The processed sam- ples and the trend over time were determined at two concen- trations and evaluated on the basis of accuracy (|15.0|%). Also the stability of thiocyanate in the stock and working solutions stored at room temperature and 2–8⁰C were evaluated. Stock and working solutions were considered stable when the change in percentage was ± 15.0%.
Clinical application
This non-clinically validated method was used to determine the potential increase in thiocyanate levels in phase 1 cancer patients in a clinical trial (study number: DPM4957g) who were administered GDC-0425 (clinicaltrials.gov identifier no.
NCT01359696). This phase 1, open-label, dose-escalation study was carried out following Institutional Review Board approval of the protocol. In this study, patients with refractory solid tu-
mors or lymphoma were administered either 60 mg or 80 mg of GDC-0425 orally, with and without gemcitabine. Serial blood samples for assessing plasma concentrations of thiocyanate were collected prior to the first dose (baseline sample) and for up to 48 hours after dosing.
Results and Discussion
Linearity
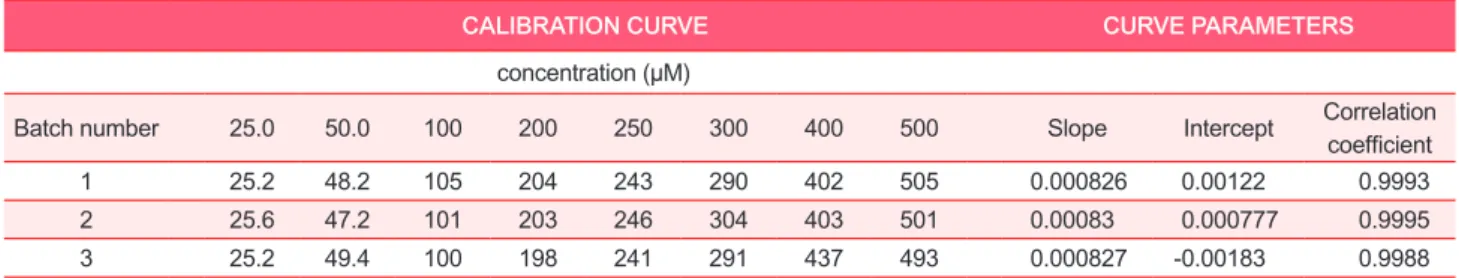
Absorption obtained from thiocyanate calibration standards in artificial plasma fit to a straight line in the range of 25.0 – 500 µmol/L. Due to the concentration range, the model is not homoscedastic as the standard deviation increases when the concentration increases (heteroscedastic). For that reason a weighing factor of 1/concentration2 was used. Back-calculated concentrations were used to evaluate the curve fit, whereas the correlation coefficient (expressed as ‘r’) of all curves (n = 3) was > 0.9988 (Table 1). The accuracy of the back-calculated values was between -3.5% and 3.5%. Precision was in the range of 0.9% to 4.8%. Summary statistics covering all data of all ac- cepted calibration curves show that the precision and accuracy of the calibration standards were in compliance with generally accepted requirements during the period in which the samples were analyzed.
Sensitivity and limits of quantitation
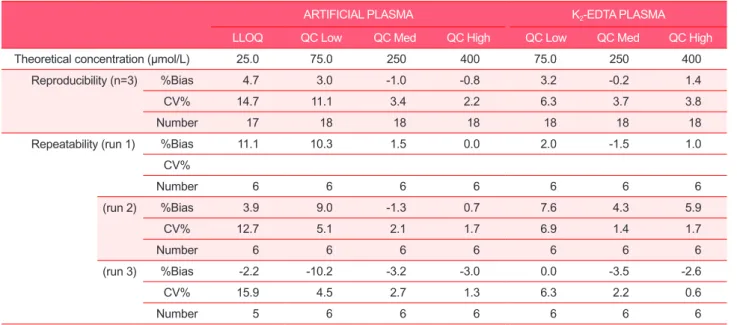
As shown in Table 2, the between-run accuracy values for the 25.0 μmol/L artificial plasma QC sample ranged between -2.2%
and 11.1%. Inter-run accuracy was 4.7%. Between-run precision was between 12.7% and 15.9% and the inter-run precision was 14.7%. Based on these results the LLOQ for thiocyanate in arti- ficial plasma was established as 25.0 µmol/L. From the calibra- tion curve results the ULOQ for thiocyanate in artificial plasma was established as 500 µmol/L. The between-run precision and accuracy were -0.1% and 1.2% for the overall data, respectively.
Precision and accuracy
The within-run precision and accuracy data for all methods are summarized in Table 2. The within-run precision of QC Low, QC Med and QC High samples was found to be lower than 15.0%, whereas the within-run precision of LLOQ was
Table 1. Calibration curve parameters for SCN-
CALIBRATION CURVE CURVE PARAMETERS
concentration (µM)
Batch number 25.0 50.0 100 200 250 300 400 500 Slope Intercept Correlation
coefficient
1 25.2 48.2 105 204 243 290 402 505 0.000826 0.00122 0.9993
2 25.6 47.2 101 203 246 304 403 501 0.00083 0.000777 0.9995
3 25.2 49.4 100 198 241 291 437 493 0.000827 -0.00183 0.9988
TCP
Transl Clin Pharmacol
found to be lower than 20.0%. Since the acceptance criteria for thiocyanate were fulfilled, the within-run precision was judged as acceptable. The within-run accuracy of the QC Low, QC Med and QC High samples was found to be between (and including the limits) -15.0% and 15.0%, whereas the within-run accuracy of LLOQ was found to be between (and including the limits) -20.0% and 20.0%.
The between-run precision and accuracy data for all methods are summarized in Table 2. The between-run precision of the QC Low, QC Med and QC High samples was found to be lower
than 15.0%, whereas the between-run precision of the LLOQ was found to be lower than 20.0%. The between-run accuracy of the QC Low, QC Med and QC High samples was found to be between (and including the limits) -15.0% and 15.0%, whereas the within-run accuracy of LLOQ was found to be between (and including the limits) -20.0% and 20.0%.
Dilution Integrity
Dilution QC samples (750 µmol/L) in human K2-EDTA plasma were diluted 10-fold with blank artificial plasma. As the
Stability item Matrix Notes Mean Accuracy (%bias)
LLOQ QC Low QC Med QC High
Freeze-thaw –20oC K2-EDTA plasma 4 cycles - -3.5 - -4.8
–70oC K2-EDTA plasma 4 cycles - -7.7 - -4.2
Short-term room temperature K2-EDTA plasma 24 hours - 16.9 - 3.4
2–8oC$ K2-EDTA plasma 1 day - -15.1 - -3.7
Artificial plasma 3 days 16.0 8.1 -3.7 -5.4
Long-term –20oC K2-EDTA plasma 31 days - 11.1 - 4.8
–70oC K2-EDTA plasma 190 days - 6.2 - 2.7
2–8oC Artificial plasma 4 days - 4.4 - 1.1
Process stability# dark K2-EDTA plasma 4 hours - -12.6 - -0.6
Artificial plasma 4 hours - 8.1 - -0.5
Process stability# day light K2-EDTA plasma 2.5 hours - -3.9 - 0.8
Artificial plasma 4 hours - -7.9 - -4.5
Table 3. Stability tests of thiocyanate in artificial and K2-EDTA plasma and processed samples (n=3)
%bias with respect to nominal values; - = Not determined; $before storage at 2-8oC sample were precipitated; #results based on single injections at room temperature.
Table 2. Reproducibility and repeatability (accuracy (%bias) and precision (CV%)) of QC samples
ARTIFICIAL PLASMA K2-EDTA PLASMA
LLOQ QC Low QC Med QC High QC Low QC Med QC High
Theoretical concentration (µmol/L) 25.0 75.0 250 400 75.0 250 400
Reproducibility (n=3) %Bias 4.7 3.0 -1.0 -0.8 3.2 -0.2 1.4
CV% 14.7 11.1 3.4 2.2 6.3 3.7 3.8
Number 17 18 18 18 18 18 18
Repeatability (run 1) %Bias 11.1 10.3 1.5 0.0 2.0 -1.5 1.0
CV%
Number 6 6 6 6 6 6 6
(run 2) %Bias 3.9 9.0 -1.3 0.7 7.6 4.3 5.9
CV% 12.7 5.1 2.1 1.7 6.9 1.4 1.7
Number 6 6 6 6 6 6 6
(run 3) %Bias -2.2 -10.2 -3.2 -3.0 0.0 -3.5 -2.6
CV% 15.9 4.5 2.7 1.3 6.3 2.2 0.6
Number 5 6 6 6 6 6 6
Young G. Shin, et al.
TCP
Transl Clin PharmacolAnalysis of thiocyanate from GDC-0425 in Phase I trial
accuracy of the dilution QC samples was between (and includ- ing limits) 85% and 115.0% and the coefficient of variation was lower than or equal to 15.0%, dilution of study samples up to 10-fold with artificial plasma was proven to be feasible.
Spiked recovery
For thiocyanate in human K2-EDTA plasma the spiked recov- eries were 103.2% for QC Low, 99.8% for QC Med and 101.4%
for QC High. The spiked recovery was considered consistent over the entire concentration range studied and the assay will be selective for the determination of thiocyanate in K2-EDTA plasma samples.
Stability of study samples
The results of the stability testing in human K2-EDTA plasma are presented in Table 3. The mean results of four freeze/thaw cycles at -15 – -25⁰C and -65 – -75⁰C did not differ more than 15.0% as compared to the nominal value. The results show that repeated freezing and thawing does not affect the concentration of thiocyanate in human K2-EDTA plasma. The data in Table 3 show that, for short-term stability, the mean results of the QC samples that were initially placed at room temperature for at least 24 hours were between (and including limits) –15.0%
and 15.0% of the nominal value with the exception of QC Low, where the bias was 16.9%. Thus, to ensure the quality of assay, study samples were kept at room temperature for less than 24 hours.
The long-term stability results of the stored QC samples (cal- culated by using a freshly prepared calibration curve) do not de- viate more than ± 15.0% from the nominal value. Thus, thiocya- nate in human K2-EDTA plasma samples stored up to 31 days at -15 – -25⁰C and up to 190 days -65 – -75⁰C can be considered as stable. Artificial plasma samples stored up to 4 days at 2–8⁰C can be considered as stable. For the assessment of stability in processed samples, the results of the processed samples do not differ more than ± 15.0% from the nominal value. As can be seen in Table 3, artificial and human K2-EDTA plasma samples can be measured up to 4 hours in the dark and up to 2.5 hours (human K2-EDTA plasma) and up to 4 hours (artificial plasma) in daylight.
After protein precipitation the assessment of stability in hu- man K2-EDTA plasma was determined. The mean results of the precipitated samples do not differ more than ± 15.0% from the nominal value, with the exception of the processed QC Low sample for human K2-EDTA plasma. For the QC Low, the mean results deviates –15.1 %. Therefore, it is recommended to process the samples until analysis within 4 hours (in darkness) or within 2.5 hours (in daylight). Finally, stock solutions can be considered to be sufficiently stable during the storage for a period of 1 day (diluted stock) and 22 days at room tempera- ture (main stock) and 31 days in the refrigerator (2–8⁰C, main stock).
Clinical Study data
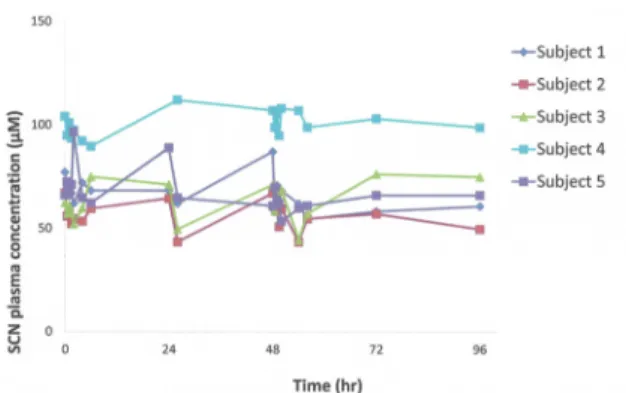
The validated method was used to quantify thiocyanate levels before and after administration of 60 mg GDC-0425 in cancer patients in an ongoing clinical study. Representative data from five patients (Fig. 2) show that post-dose thiocyanate levels were comparable to baseline (pre-dose) levels and therefore, decom- position/metabolism of GDC-0425 did not cause clinically sig- nificant increases in endogenous thiocyanate levels. Addition- ally, there was no correlation of GDC-0425 dose or exposure to changes in thiocyanate levels in this study. Thiocyanate levels after GDC-0425 administration were in the range (below 150 μmol/L) seen in a majority of human subjects[2] and signifi- cantly below the levels associated with clinical toxicity (above 1000 μmol/L).[4] Additional clinical safety and PK data from this study will be presented in a separate manuscript.
Conclusion
A rapid and sensitive method for the determination of thiocya- nate in human K2-EDTA plasma was developed and validated using a minimum amount of sample, by complexation with fer- ric nitrate and subsequent determination of absorption at 459.4 nm. The calibration curve was acceptable over the concentra- tion range from 25–500 µmol/L for the evaluation of thiocya- nate level by GDC-0425 in human plasma. Overall, this method is sensitive, selective, accurate and reproducible for the rapid determination of thiocyanate concentrations in human plasma after oral GDC-0425 administration and has been applied suc- cessfully to the evaluation of thiocyanate in a clinical trial with cancer patients.
Acknowledgements
We thank the patients and investigators who participated in this clinical trial to advance science (clinicaltrials.gov identifier no. NCT01359696). We also thank all Chk1 project team mem- bers at Genentech for their support on this project.
Figure 2. Data from patients treated with GDC-0425 show that post- dose thiocyanate levels were comparable to baseline (pre-dose) lev- els*.
TCP
Transl Clin Pharmacol
References
1. Olea F, Parras P. Determination of serum levels of dietary thiocyanate. J Anal Toxicol 1992;16:258-260.
2. Foss OP, Lund-Larsen PG. Serum thiocyanate and smoking: interpretation of serum thiocyanate levels observed in a large health study. Scand J Clin Lab Invest 1986;46:245-251.
3. Zil R, Rahman MA. Serum thiocyanate levels in smokers, passive smokers and never smokers. J Pak Med Assoc 2006;56:323-326.
4. Scherer G. Carboxyhemoglobin and thiocyanate as biomarkers of expo- sure to carbon monoxide and hydrogen cyanide in tobacco smoke. Exp Toxicol Pathol 2006;58:101-124.
5. Viswanathan CT, Bansal S, Booth, B, DeStefano A J, Rose M J, Sailstad J, et al. Quantitative bioanalytical methods validation and implementation:
best practices for chromatographic and ligand binding assays. Pharm Res 2007;24:1962-1973.
6. Lundquist P, Martensson J, Sorbo B, Ohman S. Method for determining thiocyanate in serum and urine. Clin Chem 1979;25:678-681.
7. Lundquist P, Kågedal B, Nilsson L. An improved method for determination of thiocyanate in plasma and urine. Eur J Clin Chem Clin Biochem 1995;33:343-349.
8. Logue BA, Kirschten NP, Petrikovics I, Moser MA, Rockwood GA, Baskin SI. Determination of the cyanide metabolite 2-aminothiazoline-4-carboxylic acid in urine and plasma by gas chromatography-mass spectrometry. J Chromatogr B Analyt Technol Biomed Life Sci 2005;819:237-244.
9. Saussereau E, Goulle JP, Lacroix C. Determination of thiocyanate in plas- ma by ion chromatography and ultraviolet detection. J Anal Toxicol 2007;
31:383-387.
Young G. Shin, et al.