Simultaneous Determination of Albiflorin,
Cinnamaldehyde, Cinnamic Acid, Daidzin, Glycyrrhizin, Liquiritin, Paeoniflorin and Puerarin in Galgeun-tang by
HPLC-PDA
Chang-Seob Seo, Jung-Hoon Kim, Hyeun-Kyoo Shin
Herbal Medicine EBM Research Center, Korea Institute of Oriental Medicine Jeonmin-dong 461-24, Yuseong-gu, Daejeon, 305-811, Korea
Original Article
⋅Received:17 August 2010 ⋅Revised:30 October 2010 ⋅Accepted:1 November 2010
⋅Correspondence to:Hyeun-Kyoo Shin
Herbal Medicine EBM Research Center, Korea Institute of Oriental Medicine Jeonmin-dong 461-24, Yuseong-gu, Daejeon, Korea
Tel:+82-42-868-9464, Fax:+82-42-864-2120, E-mail:[email protected]
Objectives: We investigated to develop and validate HPLC-PDA methods for simultaneous determination of eight constituents in Galgeun-tang (GGT).
Methods: Reverse-phase chromatography using a Gemini C18 column operating at 40°C, and photodiode array (PDA) detection at 230 nm, 254 nm, and 280 nm, were used for quantification of the eight marker components of GGT.
The mobile phase using a gradient flow consisted of two solvent systems. Solvent A was 1.0% (v/v) aqueous acetic acid and solvent B was acetonitrile with 1.0% (v/v) acetic acid.
Results: Calibration curves were acquired with r2 > 0.9999, and the relative standard deviation (RSD) values (%) for intra- and inter-day precision were less than 3.0%. The recovery rate of each component was in the range of 87.33-101.38%, with an RSD less than 7.0%. The contents of the eight components in GGT were 1.98-12.17 mg/g.
Conclusions: The established method will be applied for the quantification of marker components in GGT.
Key Words : HPLC-PAD; Galgeun-tang (GGT); simultaneous determination; herbal formula
Introduction
Many kinds of traditional oriental medicines have been attracting increasing attention for their therapeutic effects complementary to western medicines with few or no side effects1,2). However, although many traditional herbal medicines have been proven effective by modern pharmacological studies and clinical trials, their bioactive constituents and remedial mechanisms are still not well understood.
Thus, traditional herbal medicines remain of considerable interest3-5).
Galgeun-tang (GGT), a traditional herbal medicine, is widely used in China, Korea and South East Asia for treating cold and flu6-8). In addition, it is used as antidiarrhetic, antiemetic, antispasmodic, and antimicrobic remedy9,10). Pharmacological studies of GGT have reported antioxidative and free radical scavenging activity11,12). A composite traditional Korean medicine, GGT consist of seven herbs including Pueraria lobata, Cinnamomum cassia, Ephedra sinica, Paeonia lactiflora, Glycyrrhiza uralensis, Zingiber officinale, and Zizyphus jujuba (Table 1). Among these materials, albiflorin and
Scientific name Amount (g) Company of purchase Source
Pueraria lobata 9.0 Omniherb Jecheon, Korea
Cinnamomum cassia 6.0 HMAX China
Ephedra sinica 6.0 HMAX China
Paeonia lactiflora 6.0 Omniherb Hwasun, Korea
Glycyrrhiza uralensis 6.0 HMAX China
Zingiber officinale 6.0 Omniherb Yeongcheon, Korea
Zizyphus jujuba 5.0 Omniherb Yeongcheon, Korea
Total amount 44.0
Table 1. Composition of Galgeun-tang
Puerarin Daidzin
Paeoniflorin Albiflorin Cinnamaldehyde
Cinnamic acid
Glycyrrhizin
Liquiritin
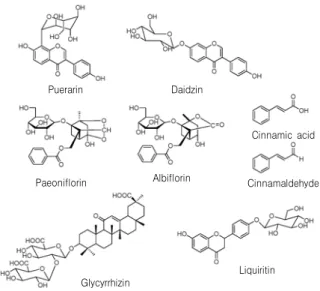
Fig. 1. Chemical structures of eight constituents in Galgeun-tang.
paeoniflorin, cinnamaldehyde and cinnamic acid, glycyrrhizin and liquiritin are marker components of Paeonia lactiflora, Cinnamomum cassia, and Glycyrrhiza uralensis, respectively. Pueraria lobata, containing puerarin and daidzin, is the main constituent of GGT. It is necessary to analyze the contents of the marker components in a decoction in order to evaluate Korean medicine.
High performance liquid chromatography (HPLC), coupled with other techniques, particularly photodiode array (PDA) detection, is a convenient, widely used, and powerful approach for rapid identification of constituents in botanical extracts and
plants important in traditional Chinese medicine13). Therefore, we focused on quantitative determination of the main components of GGT, and used HPLC-PDA-coupled methods for simultaneous detection of eight components, albiflorin, cinnamaldehyde, cinnamic acid, daidzin, glycyrrhizin, liquiritin, paeoniflorin and puerarin (Fig. 1).
Materials and Methods 1. Chromatographic system
All separations were performed using a Shimadzu
LC-20A HPLC system (Shimadzu Co., Kyoto, Japan), consisting of a solvent delivery unit, an on-line degasser, a column oven, an autosampler, and a PDA detector. The data processor used LC solution software (Version 1.24, Shimadzu Co.). The analytical column was a Gemini C18 (250×4.6 mm;
particle size 5 μm; Phenomenex, Torrance, CA). The mobile phases were solvent A (1.0%, v/v, aqueous acetic acid) and solvent B (1.0%, v/v, acetic acid in acetonitrile). The gradient flow was as follows:
(A)/(B)=95/5 (0 min) (A)/(B)=30/70 (40 min) (A)/(B)= 0/100 (45 min; hold for 5 min) (A)/(B)=
95/5 (55 min; hold for 15 min). The temperature of the column was maintained at 40°C. Analysis was carried out at a flow rate of 1.0 mL/min with PDA detection at 230 nm (for albiflorin and paeoniflorin), 254 nm (daidzin, glycyrrhizin, and puerarin), and 280 nm (for cinnamaldehyde, cinnamic acid, and liquiritin). The injection volume was 10 μL.
2. Reagents and materials
The reference standards of albiflorin, cinnamaldehyde, cinnamic acid, daidzin, glycyrrhizin, liquiritin, paeoniflorin and puerarin were purchased from Wako (Osaka, Japan). The purity of all reference standards was above 98.0%. The HPLC-grade reagents methanol, acetonitrile, and water were obtained from J. T. Baker (Phillipsburg, NJ, USA). Glacial acetic acid was of analytical reagent grade, procured from Junsei (Tokyo, Japan). The materials forming GGT were purchased from Omniherb (Yeongcheon, Korea) and HMAX (Chungbuk, Korea). All GGT components were taxonomically confirmed by Professor Je-Hyun Lee, Dongguk University, Korea. A voucher specimen (2008-KE02-1 ~ 2008-KE02-7) has been deposited at the Herbal Medicine EBM Research Center, Korea Institute of Oriental Medicine.
3. Preparation of standard solutions and calibration curves
A methanol standard stock solution containing components albiflorin, cinnamic acid, daidzin, glycyrrhizin, liquiritin, paeoniflorin, puerarin (all 1,000 μg/mL), and cinnamaldehyde (1,050 μg/mL) was prepared and stored below 4°C. Working standard solutions were prepared by serial dilution of stock solutions with methanol. All calibration curves were obtained from assessment of peak areas of standard solutions in the concentration ranges: puerarin, 2.34-300.00 μg/mL; albiflorin, 0.78-50.00 μg/mL;
daidzin, 0.78-50.00 μg/mL; paeoniflorin, 0.78-100.00 μg/mL; liquiritin, 1.56-200.00 μg/mL; cinnamic acid, 2.34-300.00 μg/mL; cinnamaldehyde, 1.64-105.00 μg/
mL; and glycyrrhizin, 2.34-300.00 μg/mL.
4. Preparation of sample solutions
A GGT was prepared in our laboratory from a mixture of chopped crude herbs purchased from Omniherb (Yeongcheon, Korea) and HMAX (Chungbuk, Korea). GGT was prepared as described in Table 1 and extracted in distilled water at 100°C for 2 h. The extract was evaporated to dryness and freeze-dried (yield; 12.6%). Lyophilized GGT extract (200 mg) was dissolved in distilled water up to 20 mL, and then the mixture was filtered using a 0.2 μ m syringe filter. Injection volume for HPLC analysis was 10 μL.
5. Limits of detection (LODs) and quantification (LOQs)
Stock solutions of reference components were further diluted with methanol to assess LOD and LOQ values. The LOD and LOQ data obtained under the chromatographic conditions used in this report were determined using signal-to-noise (S/N) ratios of 3 and 10, respectively.
6. Precision and accuracy
Repeatability was assessed by analysis of seven independently prepared standard solutions. The
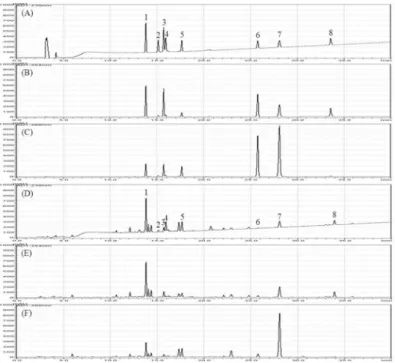
Fig. 2. HPLC chromatogram of the standard mixture of eight components with detection at 230 nm (A), 254 nm (B), and 280 nm (C), Galgeun-tang sample at 230 nm (D), 254 nm (E), and 280 nm (D). Puerarin (1), albiflorin (2), daidzin (3), paeoniflorin (4), liquiritin (5), cinnamic acid (6), cinnamaldehyde (7), and glycyrrhizin (8).
relative standard deviation (RSD) of peak areas of analytes, and peak retention times for each standard, were calculated.
Intra- and inter-day precision was determined using a standard addition method to prepare spiked samples, employing both standards and controls.
Recovery tests were performed by adding known amounts of reference standards to GGT samples before extraction. An average recovery was calculated using the formula: Recovery (%) = (Amountdetermined— Amountoriginal)/Amountspiked × 100.
Results and Discussion
1. Optimization of chromatographic conditions The result of chromatographic conditions showed satisfactory separation using mobile phases consisting of (A) 1.0% (v/v) aqueous acetic acid and (B) 1.0%
(v/v) acetic acid in acetonitrile, with a gradient flow of (A)/(B)=95/5 (0 min) → (A)/(B)=30/70 (40 min)
→ (A)/(B)=0/100 (45 min; hold for 5 min) → (A)/(B)=95/5 (55 min; hold for 15 min). Quanti- fication was achieved by PDA detection from 190-400 nm, based on peak area. The selectivity of the HPLC protocol is illustrated in Fig. 2, where good separation of marker components from other components of the extract can be noted. Using optimized chromatography conditions, all analytes were eluted before 40 min, showing a resolution better than 0.4, and good specificity in sample analysis. Representative HPLC chromatograms of standards and extract are shown in Fig. 2.
2. Recovery
A recovery test was performed by addition of known amounts of albiflorin, cinnamaldehyde, cinnamic acid, daidzin, glycyrrhizin, liquiritin,
Component Original mean (ug/mL)
Spiked (ug/mL)
Detected mean (ug/mL)
Recovery
mean (%) SD RSD (%)
Puerarin 103.42 20.00 122.88 97.31 0.91 0.94
50.00 151.97 97.11 0.52 0.53
Albiflorin 25.47 4.00 29.04 89.25 5.40 6.05
10.00 34.21 87.33 1.68 1.92
Daidzin 20.67
4.00 24.64 99.16 2.96 2.99
10.00 30.18 95.05 1.49 1.57
Paeoniflorin 34.82 2.00 36.80 99.22 3.09 3.11
5.00 39.41 91.86 2.34 2.55
Liquiritin 70.87 10.00 80.51 96.33 2.96 3.07
25.00 94.25 93.51 1.05 1.12
Cinnamic acid 19.55 12.00 31.69 101.09 1.35 1.33
30.00 49.97 101.38 0.19 0.18
Cinnamaldehyde 74.04 12.00 85.42 94.83 1.26 1.33
30.00 101.35 91.05 1.41 1.54
Glycyrrhizin 124.64 20.00 143.82 95.88 1.75 1.82
50.00 172.80 96.32 1.00 1.03
Table 2. Recovery of Eight Marker Components (n=3)
Component Linear range
(ug/mL) Slope Intercept Correlation
coefficient (R2)
LOD (ug/mL)
LOQ (ug/mL)
Puerarin 2.34-300.00 39814.06 35976.26 1.0000 0.044 0.148
Albiflorin 0.78-100.00 9654.89 1062.43 0.9999 0.156 0.520
Daidzin 0.78-100.00 37941.39 16409.73 0.9999 0.020 0.068
Paeoniflorin 0.78-100.00 38738.30 -15273.19 0.9999 0.045 0.149
Liquiritin 1.56-200.00 18495.04 12062.72 1.0000 0.032 0.106
Cinnamic acid 2.34-300.00 27338.38 31461.88 1.0000 0.018 0.062
Cinnamaldehyde 1.64-105.00 122000.31 62587.19 1.0000 0.008 0.028
Glycyrrhizin 2.34-300.00 8266.43 5843.51 1.0000 0.364 1.213
Table 3. Regression Data, Linear Ranges, LODs and LOQs for Marker Components paeoniflorin and puerarin. Standard components, at
each of two different levels, were mixed with sample powder, and extracted. The recovery of each standard ranged from 87.33-101.38%, and the RSD range was 0.18-6.05% (Table 2).
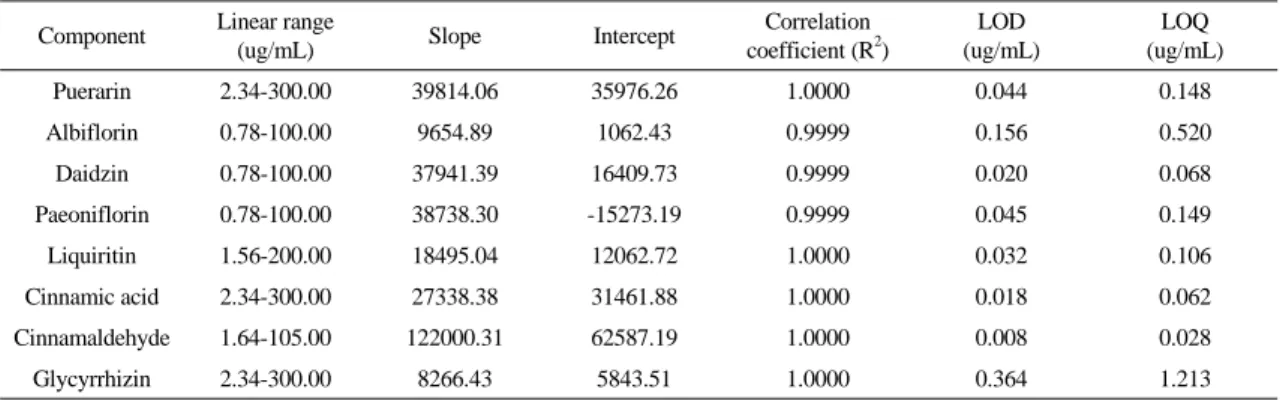
3. Linearity, range, LOD, and LOQ
Calibration curves were obtained using standard solutions containing 2.34-300.00 μg/mL of puerarin,
0.78-50.00 μg/mL of albiflorin, 0.78-100.00 μg/mL of daidzin, 0.78-100.00 μg/mL of paeoniflorin, 1.56-200.00 μg/mL of liquiritin, 2.34-300.00 μg/mL of cinnamic acid, 1.64-105.00 μg/mL of cinnamaldehyde, and 2.34-300.00 μg/mL of glycyrrhizin as marker components. Line equations representing calibration curves and correlation coefficients thereof are summarized in Table 3.
The ranges of LODs and LOQs were 0.05-0.23 μ
Component Spiked Conc.
(ug/mL)
Intra-day Inter-day
Observed Conc.
(ug/mL)
Precision (RSD %)
Accuracy (%)
Observed Conc.
(ug/mL)
Precision (RSD %)
Accuracy (%)
Puerarin 20.00 20.18 1.47 100.88 20.25 1.13 101.23
50.00 49.93 0.24 99.86 49.90 0.18 99.80
Albiflorin 4.00 4.07 1.70 101.66 4.05 1.50 101.18
10.00 9.97 0.28 99.74 9.98 0.24 99.81
Daidzin 4.00 4.17 1.96 104.32 4.15 2.10 103.77
10.00 9.93 0.33 99.31 9.94 0.35 99.40
Paeoniflorin 2.00 2.00 2.82 99.88 2.06 2.83 103.14
5.00 5.00 0.45 100.02 4.97 0.47 99.50
Liquiritin 10.00 9.89 1.99 98.93 10.15 1.37 101.49
25.00 25.04 0.31 100.17 24.94 0.22 99.76
Cinnamic acid 12.00 11.64 2.75 96.96 11.77 0.32 98.08
30.00 30.15 0.42 100.49 30.09 0.05 100.31
Cinnamaldehyde 12.00 12.22 0.77 101.84 12.33 0.43 102.72
30.00 29.91 0.13 99.71 29.87 0.07 99.56
Glycyrrhizin 20.00 20.04 0.40 100.22 20.08 0.20 100.41
50.00 49.98 0.06 99.96 49.97 0.05 99.95
Table 4. Precision and Accuracy of Analytical Results (n=3) g/mL and 0.15-0.78 μg/mL, respectively. These data are shown in Table 3.
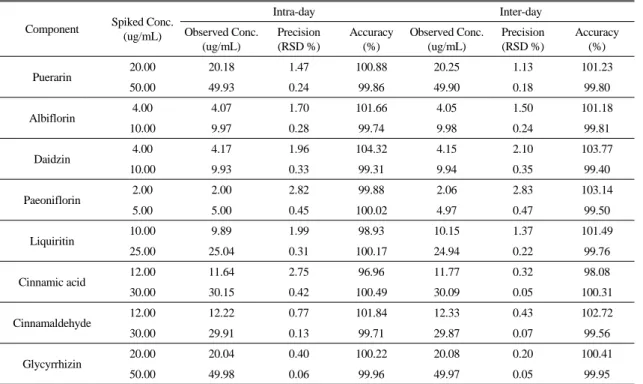
4. Accuracy and precision
Repeatability or intra-assay precision was assessed by repeatedly measuring retention times and peak areas for three independently prepared samples of analytes. Measurement precision was less than RSD 2.5% for peak responses and less than RSD 0.3% for retention times, with all analytes. Thus, the HPLC assay offered good reproducibility under optimized conditions.
To test the accuracy and precision of our analytical method, intra- and inter-day variations for measurement of eight marker components were determined, and are summarized in Table 4. The precision of the method in simultaneous determination of the eight marker components was acceptable because the RSD did not exceed 3.0% at any concentration. The intra-day accuracy ranged
from 96.96-104.32%, and the inter-day accuracy from 98.08-103.77%.
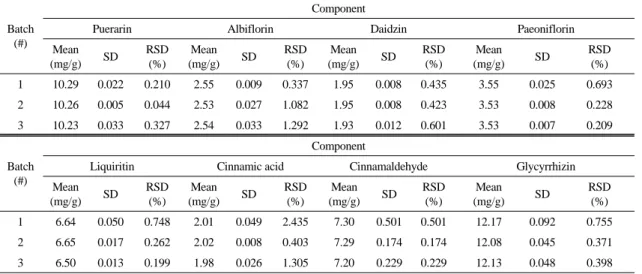
5. Determination of the main constituents of GGT
Our assay was subsequently applied to the simultaneous determination of eight components, puerarin, albiflorin, daidzin, paeoniflorin, liquiritin, cinnamic acid, cinnamaldehyde, and glycyrrhizin, in GGT. Fig. 2 show chromatograms of reference components and that of a water extract of GGT, with detection of eluents at 230 nm, 254 nm, and 280 nm. The analytical results for each component identified are summarized in Table 5.
Conclusion
A HPLC method was developed for simultaneous determination of puerarin, albiflorin, daidzin, paeoniflorin, liquiritin, cinnamic acid, cinnamaldehyde,
Batch (#)
Component
Puerarin Albiflorin Daidzin Paeoniflorin
Mean
(mg/g) SD RSD
(%)
Mean
(mg/g) SD RSD
(%)
Mean
(mg/g) SD RSD
(%)
Mean
(mg/g) SD RSD
(%)
1 10.29 0.022 0.210 2.55 0.009 0.337 1.95 0.008 0.435 3.55 0.025 0.693
2 10.26 0.005 0.044 2.53 0.027 1.082 1.95 0.008 0.423 3.53 0.008 0.228
3 10.23 0.033 0.327 2.54 0.033 1.292 1.93 0.012 0.601 3.53 0.007 0.209
Batch (#)
Component
Liquiritin Cinnamic acid Cinnamaldehyde Glycyrrhizin
Mean
(mg/g) SD RSD
(%)
Mean
(mg/g) SD RSD
(%)
Mean
(mg/g) SD RSD
(%)
Mean
(mg/g) SD RSD
(%)
1 6.64 0.050 0.748 2.01 0.049 2.435 7.30 0.501 0.501 12.17 0.092 0.755
2 6.65 0.017 0.262 2.02 0.008 0.403 7.29 0.174 0.174 12.08 0.045 0.371
3 6.50 0.013 0.199 1.98 0.026 1.305 7.20 0.229 0.229 12.13 0.048 0.398
Table 5. Analytical Results for Marker Components in Galgeun-tang
and glycyrrhizin, to evaluate the quality of GGT. In the present work, simultaneous determination of the eight marker components in GGT was validated with respect to linearity, precision, and accuracy. This method will help to improve quality control of GGT.
Acknowledgements
This research was supported by a grant (no.
K10030) from the Korea Institute of Oriental Medicine.
References
1. Xue TH, Roy R. Studying traditional Chinese medicine. Science. 2003; 300:740-1.
2. Normile D. Asian medicine: The new face of traditional Chinese medicine. Science. 2003;
299:188-90.
3. Jiang WY. Therapeutic wisdom in traditional Chinese medicine: a perspective from modern science. Trends Pharmacol Sci. 2005; 26:558-63.
4. Liu S, Yi LZ, Liang YZ. Traditional Chinese medicine and separation science. J Sep Sci. 2008;
31:2113-37.
5. Won JB, Ma JY, Ma CJ. Simultaneous determination of four marker components in yukmijihwang-tang by high performance liquid chromatography/diode array detector. Arch Pharm Res. 2010; 33:619-23.
6. Hur J. Dong-eui-bo-gam. Seoul: Namsandang.
1994:390.
7. Chai IS. Sang Han Ron Yeok Jeong. Seoul:
Gomoonsa. 2000:329.
8. Park HJ. Kum Kue Yo Ryak. Seoul: Seowondang.
1978:83.
9. Tang W, Eisenbrand G. Chinese drugs of plant origin-chemistry, pharmacology and use in traditional and modern medicine. New York:
Springer Berlin, Heidelberg. 1992:797-803.
10. Zhu YP. Chinese materia medica-chemistry, pharmacology and applications. Amsterdam:
Harwood Academic Publishers. 1998:92-6.
11. Kim DR, Kwak GS, Jeong SM, Lee SC, Ha JU.
Comparison of the antioxidative abilities of commercial Galgeuntang. J Korean Soc Food Sci Nutr. 2003; 32:728-32.
12. Shin JM, Kim YO, Baek SH. Free radical
scavenging activity and kinetic behavior of the galgeuntang water extract. Ori Pharm Exp Med.
2008; 8:32-8.
13. Zhang H, Shen P, Cheng Y. Identification and
determination of the major constituents in traditional Chinese medicine Si-Wu-Tang by HPLC coupled with DAD and ESI-MS. J Pharm Biomed Anal. 2004; 34:705-13.