Changes of the Cerebral Metabolite Patterns in Patients Undergoing Hemodialysis due to Chronic Renal Failure:
Evaluation with Proton Magnetic Resonance Spectroscopy
1Hye Won Baik, M.D., Hyeon Yu, M.D., Soo Jeong Yu, M.D.2, Gi Hyeon Kim, M.D.
Purpose: We wanted to evaluate the cerebral metabolites in patients with chronic re- nal failure (CRF) and who were undergoing hemodialysis by performing proton MR spectroscopy and we wanted to evaluate the correlation between the changes in the cerebral metabolite ratios and the duration after starting the initial hemodialysis.
Materials and Methods: Proton MR spectroscopy was performed in 15 patients with CRF and who were undergoing hemodialysis and in ten healthy volunteers. The changes in N-acetylaspartate (NAA), choline-containing compounds (Cho), myo-inosi- tol (Myo), glutamine/glutamate complex (Glx), and creatine (Cr) were analyzed. MR spectroscopy was performed before and after hemodialysis.
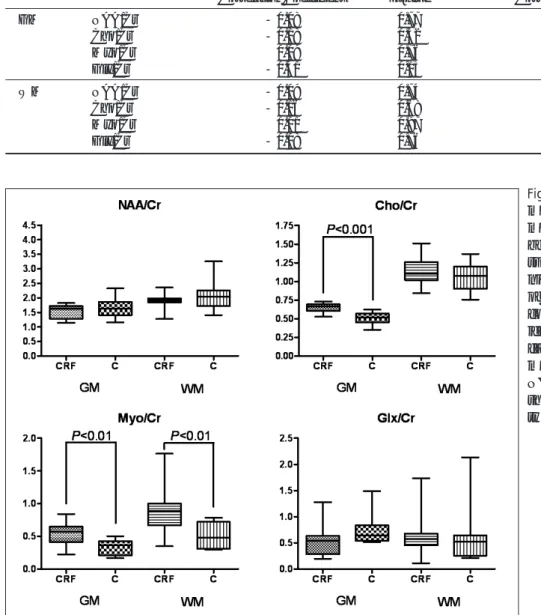
Results: For the patients with CRF before hemodialysis, the Cho/Cr ratio in the gray matter (p<0.001) and the Myo/Cr ratio in both the gray and white matter (p<0.01) were significantly elevated compared with those in the control subjects. For the pa- tients with CRF after hemodialysis, their Cho/Cr ratios were significantly reduced in both the gray and white matter compared with that before hemodialysis (p<0.05).
There was a significant positive correlation between the Cho/Cr ratio and serum Cr in the gray matter of CRF patients after hemodialysis (r=0.54, p<0.05). The cerebral metabolite ratios were not significantly correlated with the duration after starting the initial hemodialysis.
Conclusion: The cerebral metabolite patterns are significantly different between the patients with CRF and who are undergoing hemodialysis and the normal controls. The cerebral metabolite ratios are not significantly correlated with the duration after start- ing the initial hemodialysis.
Index words :Brain, metabolism Kidney failure, Chronic Dialysis
Magnetic resonance spectroscopy
Hemodialysis and continuous ambulatory peritoneal dialysis are life-saving procedures for patients suffering from CRF. However, hemodialysis itself is associated with neurological syndromes, including dialysis disequi- librium syndrome and dialysis encephalopathy (1).
Although severe dialysis encephalopathy has rarely been observed these days after elimination of the alu- minum from the dialysate and also due to performing close monitoring of the serum aluminum levels in dialy- sis patients who receive oral antacids, dialysis patients still have some minor neuropsychiatric symptoms that include mental changes, seizures and tremor (2).
Although the pathophysiology of these neuropsychiatric symptoms in patients with CRF and who are undergo- ing chronic dialysis is not completely understood, it is believed that these symptoms may be caused by bio- chemical changes in the brain (3). These biochemical changes in the brain may occur even before developing obvious neuropsychiatric symptoms (4).
Previous animal studies have demonstrated that some metabolites such as Myo, Cho, Cr and Glx play an im- portant role as osmolytes under situations that involve osmotic stress (5, 6). These metabolites in the human brain can be quantified with proton MR spectroscopy.
Proton MR spectroscopy is a non-invasive technique that allows evaluating cerebral metabolites in humans and repeated measurements are possible in a normal clinical setting.
Previous studies with MR spectroscopy have reported that cerebral metabolites are correlated with renal dys- function, and the cerebral metabolite ratios before he- modialysis are significantly different from those after
hemodialysis in patients with CRF (4, 7). It has been re- ported that elevated Cho/Cr ratios were reduced about 18 months after starting hemodialysis, even though it was not statistically significant (4). However, to the best of our knowledge, there has been no comprehensive study that has reported on the relationship between the changes in the cerebral metabolite ratios and the dura- tion after starting hemodialysis for patients with CRF.
The purpose of our study was to evaluate the cerebral metabolite patterns in patients with CRF and who are undergoing hemodialysis with using proton MR spec- troscopy and to see if there was a significant correlation between changes in the cerebral metabolite ratios and the duration after starting the initial hemodialysis.
Materials and Methods
Thirty MR imagings with proton MR spectroscopy were performed for 15 patients with CRF (6 men and 9 women, mean age±SD: 58.1±15.5 years, age range:
32-83 years) several hours before and then one day af- ter hemodialysis. The mean (±SD) duration after start- ing hemodialysis in these CRF patients was 30.4±33.0 months (range: 3-103 months). The following laborato- ry data was measured from the patients with CRF be- fore and after hemodialysis: blood urea nitrogen (BUN), serum creatinine (Cr) and the serum osmolality (Osm).
The Kt/Vurea is calculated from the BUN value.
Patients with diabetes mellitus or any known neurologic disorders were excluded from this study. Ten healthy volunteers (5 men and 5 women, mean age±SD: 51.9±
11.2 years, age range: 31-63 years) who underwent the
A B
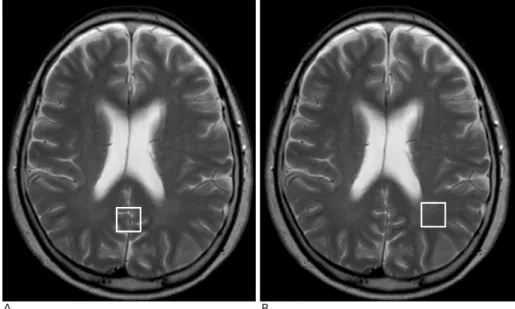
Fig. 1. Axial T2-weighted MR images of a 63-year-old male with CRF. Boxes indicate standardized voxels of inter- est. The voxels of interest were located in the parietal gray matter (A) and the white matter (B).
same examination served as the control subjects. The control subjects had no neurological or biochemical ab- normalities. Written informed consent for the study was obtained from all the patients and the control subjects.
Proton MR spectroscopy and MR imaging were per- formed on a 3.0-T whole-body MR system (Achieva, Philips Medical Systems, Best, The Netherlands) by us- ing an 8-element phased array sensitivity-encoding (SENSE) head coil. The MR system was equipped with gradients that could achieve a maximum slew rate of 200 mT/m/ms and a maximum strength of 80 mT/m.
The single voxel MR spectroscopic data was acquired by using a point-resolved spatially localized spectroscopic (PRESS) pulse sequence (repetition time: 2000 ms, echo time: 32 ms, spectral width: 2000 Hz, data points: 1024, acquisitions: 128). For the repeated examinations, the exact reproducibility of the spectral localization was of special importance. This was achieved by acquiring three orthogonal T2-weighted turbo spin-echo images for the three-dimensional positioning of the volume of interest. Two voxels of interest were located in the gray and white matter. The first voxel of interest (2.0×2.0×
2.0 cm) for the gray matter was positioned symmetrical- ly around the midline, and this mainly included the
parietal cortex and the posterior cingulated gyrus. The second voxel of interest (2.0×2.0×2.0 cm) for the white matter was positioned adjacent to the posterior horn of the left lateral ventricle (Fig. 1).
The cerebral metabolites we examined included NAA, Cr, Cho, Myo and Glx. The metabolite ratios, with using Cr as the reference, were calculated for NAA, Cho, Myo and Glx. All the proton MR spectroscopic data was fit- ted by using jMRUI software (version 96.3, A. van den Boogaart, Katholieke Universiteit Leuven, Leuven, Belgium) for analysis of the time domain directly on the free-induction decays. The spectra were filtered for re- moval of residual water by using the Hankel-Lanczos single-variable decomposition method and then they were apodized with a 1.25-Hz Gaussian function. The metabolite signals were analyzed by using the Advanced Magnetic Resonance (AMARES) fitting algorithm within the jMRUI software.
Prior to MR examination, a blood sample was collect- ed from all the patients with CRF in order to measure the BUN, serum Cr and serum Osm. The laboratory da- ta were measured before and after hemodialysis. The plasma osmolality was measured using an Osmette 5004 Automatic Osmometer (Precision Systems Inc., U.S.A.).
An unpaired Student’s t-test was used to compare the cerebral metabolite ratios between the patients with CRF before hemodialysis and the control subjects. A paired Student’s t-test was used to compare the metabo- lite ratios before and after hemodialysis in the CRF pa- tients. Pearson’s correlation coefficient was used to ex- amine the correlations between each of the metabolite ratios and the laboratory data before and after hemodial- ysis. A p value < .05 was considered statistically signifi- cant. All data analyses were performed using the SPSS software package (SPSS, Inc., Chicago, IL, U.S.A.).
Results
For the patients with CRF before hemodialysis, their
Cho/Cr ratios were significantly reduced in both the gray and white matter compared with those before he-
modialysis. The other cerebral metabolite ratios did not demonstrate any significant changes in both the gray and white matter after hemodialysis compared with the data before hemodialysis (Table 1).
There was a significant positive correlation between the Myo/Cr ratio and the BUN level in the white matter of the CRF patients after hemodialysis (r=0.66, p<0.01). In the gray matter of the CRF patients after he- modialysis, there was a significant positive correlation between the Cho/Cr ratio and the serum Cr (r=0.54, p<0.05). For the gray and white matter of CRF patients before hemodialysis, there were no significant correla- tions between each cerebral metabolite ratio of the gray and white matter, respectively, and the laboratory data (Fig. 4).
Fig. 3. Comparison of the cerebral metabolite ratios in the gray and white matter between the patients with CRF before hemodialysis and the control subjects (C). The Cho/Cr ratio was sig- nificantly elevated in the gray matter of CRF patients before hemodialysis as compared with that of the control sub- jects. The Myo/Cr ratio was signifi- cantly elevated in the gray and white matter of CRF patients, but the NAA/Cr and Glx/Cr ratios did not show any significant differences be- tween the two groups.
Table 1. Comparison of the Cerebral Metabolite Ratios Before and After Hemodialysis (values are means ± SDs)
Before After Hemodialysis Hemodialysis
GM NAA/Cr 1.55±0.22 1.55±0.17*
Cho/Cr 0.65±0.06 0.62±0.08*
Myo/Cr 0.55±0.15 0.59±0.30*
Glx/Cr 0.53±0.27 0.57±0.17*
WM NAA/Cr 1.93±0.26 1.80±0.25*
Cho/Cr 1.15±0.19 1.02±0.15*
Myo/Cr 0.92±0.40 0.80±0.33*
Glx/Cr 0.62±0.35 0.70±0.36*
*p < 0.05, paired t-test
Table 2. Correlation Between the Duration After Starting the Initial Hemodialysis and the Changes in the Cerebral Metabolite Ratios
Pre-Hemodialysis Post-Hemodialysis
Correlation Coefficient p-value Correlation Coefficient p-value
GM NAA/Cr - 0.08 0.77 - 0.35 0.19
Cho/Cr - 0.18 0.52 - 0.13 0.64
Myo/Cr -0.09 0.76 - 0.04 0.89
Glx/Cr - 0.41 0.13 - 0.44 0.10
WM NAA/Cr - 0.09 0.74 - 0.33 0.23
Cho/Cr - 0.16 0.68 - 0.20 0.47
Myo/Cr -0.01 0.97 -0.21 0.46
Glx/Cr - 0.08 0.76 - 0.21 0.45
The cerebral metabolite ratios in both the gray and white matter in the CRF patients were not significantly correlated with the duration after starting the initial he- modialysis (Table 2) (Fig. 5).
Discussion
In the present study that used proton MR spec- troscopy, we demonstrated significant changes in the cerebral metabolites of patients with CRF and who were undergoing hemodialysis compared with those of the control subjects. Cho and Myo were the main cerebral metabolites that showed significant differences in the CRF patients compared with the control subjects. We
found that the Cho/Cr ratio was significantly reduced in patients with CRF after hemodialysis compared with that before hemodialysis. However, the cerebral metabolite ratios in both the gray and white matter of the CFR patients were not significantly correlated with the duration after starting the initial hemodialysis. To the best of our knowledge, this is the first study that has examined the relationship between the duration after hemodialysis and the changes in the cerebral metabolite ratios of patients with CRF.
The brain generates intracellular osmolytes as a pro- tective mechanism (8). Osmolytes are organic solutes that are essential for cell-volume homeostasis and they may also function as general protectors for brain cells.
A B
Fig. 4. Correlation between the cerebral metabolite ratios and the laboratory data: (A) the Cho/Cr ratio in the gray matter and the serum Cr, (B) the Myo/Cr ratio in the white matter and the BUN.
They have unique biophysical and biochemical proper- ties that allow cells to accumulate high concentrations of them without any adverse effects on the cellular struc- ture and function. Organic osmolytes are believed to regulate the intracellular osmotic environment in re- sponse to osmotic stress. For patients with CRF who are in a continuous hyperosmolar state, organic osmolytes may play a key role in adapting to osmotic stress (9).
Previous animal studies have demonstrated that some metabolites such as Myo, Cho, Cr and Glx play impor- tant roles as major osmolytes (5, 6). These metabolites in the human brain can be quantified by performing pro- ton MR spectroscopy.
Cho is generally thought to be related to the synthesis of cellular membranes. An abnormal MR spectroscopy of Cho is usually a metabolic sign of membrane molecu- lar break-down or turnover. The peak of Cho (3.2 ppm) is actually a combination of several resonant peaks for molecules that contain choline, including glycerophos- phorylcholine and phosphorylcholine (10). The concen- tration of Cho is higher in the white matter than gray matter, and this difference increases with age (11).
Choline-containing compounds are also considered to be major osmolytes (12, 13). Sasaki et al. (4) found that the Cho/Cr ratios were significantly elevated in both the gray and white matter of patients with CRF compared to that of the control subjects. In their study, the Cho/Cr ratios in the gray matter showed significant positive cor- relations with the serum Cr and BUN, and the serum os- molality. The MR spectroscopic findings in our CRF pa- tients are similar to those of the previous study by Sasaki et al. The same as in that previous study, we found that the Cho/Cr ratio was significantly elevated in the gray matter of CRF patients as compared to that of the control subjects. The Cho/Cr ratio in the white mat- ter was also elevated in CRF patients, although this was not statistically significant. In the gray matter, the Cho/Cr ratios demonstrated significant positive correla- tions with the serum Cr and serum osmolality.
However, we did not find any correlation between the Cho/Cr ratio and the BUN level in our subjects. There may be several explanations about this discrepancy be- tween our study and the previous study results. First, the reference Cr concentration may change in both the gray and white matter. Second, the T2 relaxation time of the reference standard or that of the other metabolite resonances may change. Finally, the water compart- ment in which the metabolites are concentrated may be altered by the patient’s condition at the time of laborato-
ry or MR spectroscopic studies (7).
Myo (3.56 ppm) is a pentose sugar and it’s involved in the inositol triphosphate intracellular second messenger system (11). Myo is generally considered to be a glial marker. Elevated Myo reflects an increased population of glial cells, which are known to express higher levels of this metabolite than neurons (14). Myo is also consid- ered to be a major brain osmolyte (12, 13). This metabo- lite may be related to differences in the Myo/ Na+ co- transporter activity that appears to play a key role in as- trocyte osmoregulation. This would explain chronic dis- turbances of the Myo levels in transient hypo- and hy- per-osmolar states (15). Sasaki et al. (4) reported that there was no significant elevation in the Myo/Cr ratio of CRF patients. They suggested that an elevated Myo/Cr ratio could partially be the result of serum aluminum toxicity. In their study, the serum aluminum level was not elevated in CRF patients. However, Geissler et al.
(14) found elevated Myo/Cr ratios in the gray matter of patients with CRF. No significant correlations were found between the serum aluminum levels and the changes in the cerebral metabolite patterns in their study. They suggested that this was due to the fact that the cortical aluminum concentrations do not necessarily correlate with the serum concentrations, and the eleva- tion of the Myo/Cr ratio could also be induced by changes in the cortical glial cell metabolism that lead to glial proliferation or the production of higher amounts of Myo in the glial cells (14, 16, 17). In our study, the Myo/Cr ratios were significantly elevated in both the gray and white matter in the CRF patients compared to that of the control subjects. Although we did not check the serum concentrations of aluminum, our results may have been caused by the same mechanisms that Geissler et al. have proposed in their previous study.
NAA (2.02 ppm) is considered as a neuronal marker, and this metabolite is mostly found in neuronal cells (18). NAA is commonly decreased in patients with non- specific neuronal loss or dysfunction due to a range of insults, including ischemia, trauma, inflammation, in- fection, tumors, dementia and gliosis (11). Geissler et al.
(14) reported reductions of the NAA/Cr ratio in CRF pa- tients who undergo hemodialysis. They suggested two mechanisms for their results: (1) neuronal damage or dysfunction due to dialysis with the resultant gliosis and elevation of Myo; and (2) reduction of the NAA concen- tration to keep the osmotic balance. In their study, some of the CRF patients showed neuropsychiatric abnormal- ities or elevated serum aluminum concentrations.
Menon et al. (19) also reported that the NAA/Cr ratios were decreased more than 2 SDs below the control mean. However, Michaelis et al. (7) found no significant changes in the NAA/Cr ratios in patients with treated or untreated end stage renal disease. They also found no correlation between the NAA/Cr and either the BUN or serum Cr. Sasaki et al. (4) reported that no significant changes were found in the NAA/Cr ratios of CRF pa- tients. They suggested that the NAA/Cr ratio may not be reduced in the CRF patients who are without dementia, cognitive impairment or aluminum toxicity. In our study, the NAA/Cr ratios did not show any significant difference between the CRF patients and the control subjects. For our study subjects, none of the patients showed any neuropsychiatric abnormality or had any history of neurological or hepatic disorders. We also sug- gest that the decreased NAA/Cr ratios in CRF patients undergoing hemodialysis may represent neuronal in- jury, which can lead to some degree of neuropsychiatric symptoms or cognitive impairments. Although conven- tional MR imaging does not show abnormal signal inten- sities in the brain, if patients with CRF present with neuropsychiatric abnormalities, then performing proton MR spectroscopy would help us understand the changes in the cerebral metabolite patterns.
Hemodialysis has been widely used in patients with CRF as a life-saving procedure. For patients with CRF and who are undergoing chronic hemodialysis, the cere- bral metabolite patterns are repeatedly altered by inter- mittent dialysis treatment (14). Previous studies have ex- amined the transient metabolic changes after efficient hemodialysis in CRF patients (7, 14). Geissler et al. (14) found no significant differences in the cerebral metabol- ic ratios before and after hemodialysis. However, Michaelis et al. (7) reported that the Cho/Cr, Myo/Cr and NAA/Cr ratios were significantly decreased in the white matter after hemodialysis, and the Cho/Cr ratio in the grey matter was significantly decreased after he- modialysis. In the present study, the Cho/Cr ratio was significantly reduced in both the gray and white matter
A previous study found that the cerebral adaptation to the change of the osmotic environment did not occur rapidly (4). Sasaki et al. (4) reported that the Cho/Cr ra- tios were not changed at about 2 weeks after initiating hemodialysis, but they were significantly decreased in the gray matter and they tended to decrease in the white matter after 18 months of hemodialysis. In our study, the cerebral metabolite ratios in the patients with CRF were not significantly correlated with the duration of the period after starting the initial hemodialysis. The dif- ference between the findings of the two studies might be due to the fact that we did not perform initial MR spectroscopy in CRF patients for obtaining the baseline data before initiating hemodialysis. We simply correlat- ed each metabolite ratio in all the subjects suffering with CRF with the duration of hemodialysis. Although we don’t know how the cerebral metabolite ratios change in each individual according to the duration of hemodialy- sis, our results may indicate that once the cerebral metabolites recover via hemodialysis, then the brain may be protected from osmotic stress and the duration of hemodialysis doesn’t affect the metabolite patterns as long as the CRF patients undergo efficient hemodialysis.
Evaluating the cerebral organic osmolytes via proton MR spectroscopy may be valuable for planning the opti- mal management of patients with CRF before and after hemodialysis (4, 13). Although most CRF patients do not demonstrate abnormal signal intensities in the brain on conventional MR imaging and they do not display neu- ropsychiatric abnormalities, proton MR spectroscopy may be helpful to identify early changes in the cerebral metabolite patterns that occur prior to the onset of clini- cal symptoms.
There are some limitations of our study. First, the number of patients with CRF was relatively small. The statistical power for the analysis of the cerebral metabo- lite ratios was limited because of the small sample size.
Second, longitudinal follow-up MR spectroscopy was not performed for each patient with CRF. For this rea- son, the serial changes of the cerebral metabolites could
taining compounds are the major osmolytes that play key roles in regulating cerebral metabolism in response to osmotic stress, like the hyperosmolality seen in CRF patients. The cerebral metabolite patterns of the brain are not affected by the duration after the start of he- modialysis. Proton MR spectroscopy may be a valuable tool to evaluate the changes in the cerebral metabolism before the onset of clinical symptoms in CRF patients.
References
1. Silver SM, DeSimone JA, Jr., Smith DA, Sterns RH. Dialysis dise- quilibrium syndrome (DDS) in the rat: role of the “reverse urea ef- fect”. Kidney Int 1992;42:161-166
2. Lockwood AH. Neurologic complications of renal disease. Neurol Clin 1989;7:617-627
3. Alfrey AC. Dialysis encephalopathy. Clin Nephrol 1985;24 Suppl 1:S15-19
4. Sasaki O, Hattori N, Nakahama H, Inoue N, Nakamura S, Inenaga T, et al. Positive correlations between cerebral choline and renal dysfunction in chronic renal failure. Neuroradiology 2006;48:300- 306
5. Gullans SR, Verbalis JG. Control of brain volume during hyperos- molar and hypoosmolar conditions. Annu Rev Med 1993;44:289- 301
6. Lien YH, Shapiro JI, Chan L. Effects of hypernatremia on organic brain osmoles. J Clin Invest 1990;85:1427-1435
7. Michaelis T, Videen JS, Linsey MS, Ross BD. Dialysis and trans- plantation affect cerebral abnormalities of end-stage renal disease.
J Magn Reson Imaging 1996;6:341-347
8. Arieff AI, Kleeman CR. Studies on mechanisms of cerebral edema
in diabetic comas. Effects of hyperglycemia and rapid lowering of plasma glucose in normal rabbits. J Clin Invest 1973;52:571-583 9. McManus ML, Churchwell KB, Strange K. Regulation of cell vol-
ume in health and disease. N Engl J Med 1995;333:1260-1266 10. Barker PB, Breiter SN, Soher BJ, Chatham JC, Forder JR,
Samphilipo MA, et al. Quantitative proton spectroscopy of canine brain: in vivo and in vitro correlations. Magn Reson Med 1994;32:
157-163
11. Gillard JH, Waldman AD, Barker PB. Clinical MR Neuroimaging Diffusion, Perfusion and Spectroscopy. Port Melbourn: Cambridge University Press, 2005:9-13
12. Videen JS, Michaelis T, Pinto P, Ross BD. Human cerebral os- molytes during chronic hyponatremia. A proton magnetic reso- nance spectroscopy study. J Clin Invest 1995;95:788-793
13. Lee JH, Arcinue E, Ross BD. Brief report: organic osmolytes in the brain of an infant with hypernatremia. N Engl J Med 1994;331:439- 442
14. Geissler A, Frund R, Kohler S, Eichhorn HM, Kramer BK, Feuerbach S. Cerebral metabolite patterns in dialysis patients:
evaluation with H-1 MR spectroscopy. Radiology 1995;194:693-697 15. Paredes A, McManus M, Kwon HM, Strange K. Osmoregulation of Na(+)-inositol cotransporter activity and mRNA levels in brain glial cells. Am J Physiol 1992;263:C1282-1288
16. Yokel RA, Lidums V, Ungerstedt U. Aluminum mobilization by desferrioxamine assessed by microdialysis of the blood, liver and brain. Toxicology 1991;66:313-324
17. Alfrey AC, Hegg A, Craswell P. Metabolism and toxicity of alu- minum in renal failure. Am J Clin Nutr 1980;33:1509-1516 18. Moffett JR, Namboodiri MA, Cangro CB, Neale JH.
Immunohistochemical localization of N-acetylaspartate in rat brain. Neuroreport 1991;2:131-134
19. Menon DK, Sandford RN, Cassidy MJ, Bell JD, Baudouin CJ, Sargentoni J. Proton magnetic resonance spectroscopy in chronic renal failure. Lancet 1991;337:244-245
대한영상의학회지 2007;57:111-119
혈액투석중인 만성신부전 환자의 뇌내 대사물질의 변화:
수소자기공명분광 소견
11중앙대학교 의과대학 중앙대학교병원 영상의학과
2중앙대학교 의과대학 중앙대학교병원 신장내과
백혜원・유 현・유수정2・김기현
목적: 수소 자기공명분광검사를 이용하여 혈액투석을 받는 만성신부전 환자의 뇌내 대사물질들의 변화를 알아보고 혈액투석을 처음 시작한 이후부터 시간이 지남에 따라 뇌내 대사물질들도 의미 있게 변하는지 알아보고자 하였다.
대상과 방법: 15명의 혈액투석중인 만성신부전 환자와 10명의 정상인을 대상으로 자기공명분광검사를 실시하였다.
자기공명분광검사는 화적소를 마루엽의 회색질과 백색질에 위치시키고 실시했으며 NAA, Cho, Myo, Glx, 및 Cr을 측정하였다. 자기공명분광검사는 혈액투석 전과 후에 각각 시행하였다.
결과: 혈액투석 이전의 만성신부전 환자의 회색질에서는 Cho/Cr 비가(p < 0.001), 백색질과 회색질에서는 Myo/Cr 비가(p < 0.01) 각각 정상 대조군 보다 유의하게 높게 관찰되었다. 혈액투석 후의 만성신부전환자에서는 혈액투석 전과 비교하여 Cho/Cr 비가 회색질과 백색질 모두에서 유의하게 감소하였다(p < 0.05). 혈액투석 후의 만성신부전 환자의 회색질에서 얻은 Cho/Cr비는 혈청 Cr 수치와 유의한 상관관계를 보였다(r=0.54, p < 0.05). 뇌내 대사물 질들의 비는 첫 혈액투석을 시작한 이후부터 검사 시점까지의 경과 시간과는 유의한 상관관계가 없었다.
결론: 만성신부전 환자의 뇌내 대사물질들은 정상 대조군과 비교하여 유의한 차이를 보였다. 혈액투석을 처음 받기 시작한 이후부터 지나간 시간과 뇌내 대사물질들의 변화 사이에는 유의한 상관관계가 없었다.