INTRODUCTION
Many factors, i.e., era, ethnic origin, and socioeconomic sta- tus, can affect characteristics of growth. Therefore, the devel- opment of a standard growth curve is essentially required on a basis of country for the more accurate assessment of existing growth abnormality, the prediction of future growth and for calculating any residual discrepancy of limb-length at skeletal maturity. Some authors in the oriental region have reported growth-related data by focusing on different characteristics of skeletal growth from those used in the West (1, 2). Through nationwide survey by cross-sectional study, a Korean specific bone age standard based on the Tanner-Whitehouse 2 method (3) was established by the Korean Radiological Society in 1997 (4). The present study was undertaken in order to develop a standard growth chart of the lower extremity in Korean chil- dren from 3 to 16 yr of age. For this purpose, the lengths of the normal femur and tibia were measured and standardized by bone age, which was determined by using the Korean bone age standard (4).
METHODS AND MATERIALS
For the nationwide cross-sectional study conducted to deter- mine and measure the bone age and the lengths of femurs and tibias, six centers were selected. The six centers selected were evenly distributed around the country. In order to investigate the distribution of femur and tibia lengths according to bone age, Korean boys and girls, ranging from two to eighteen years old, were enrolled in the study from 1999 to 2002. The lengths of a total of 2087 normal long bone segments (582 femurs and 645 tibias in boys, and 417 femurs and 443 tibias in girls) were measured. This population contained unilaterally involved patients, e.g. those having post-traumatic and post-infectious diseases, and congenital diseases such as anisomelia, develop- mental dysplasia of the hip, Legg-Perthes disease. Patients hav- ing systemically involved metabolic or genetic diseases, or neu- romuscular diseases were excluded. We used the atlas of the Korean specific bone age standard on the TW2-20 method published in 1999 (5). A total of 965 anteroposterior radio- graphs (553 boys, 412 girls) of the left hand were evaluated for determination of bone ages. When an image of the left hand
Jeong Hyun Ha, In Ho Choi, Chin Youb Chung, Tae-Joon Cho, Sung Taek Jung*, Ho-Seung Lee�, Soo-Sung Park�, Han Yong Lee�, Chang-Wug Oh�, In One Kim‖
Department of Orthopaedic Surgery, Seoul National University Hospital, Seoul; *Department of Orthopaedic Surgery, Chonnam National University Hospital, Gwangju; �Department of Orthopaedic Surgery, Asan Medical Center, Seoul; �Department of Orthopaedic Surgery, St. Vincent’s Hospital, The Catholic University, Suwon; �Department of Orthopaedic Surgery, Kyungpook National University Hospital, Daegu; ‖Department of Radiology, Seoul National University Hospital, Seoul, Korea
Address for correspondence In Ho Choi, M.D.
Department of Orthopedic Surgery, Seoul National University Hospital, 28 Yongon-dong, Chongno-gu, Seoul 110-744, Korea
Tel : +82.2-760-3640, Fax : +82.2-764-2718 E-mail : [email protected]
715
Distribution of Lengths of the Normal Femur and Tibia in Korean Children from Three to Sixteen Years of Age
To develop a standard growth curve of the lower extremity in Korean children from 3 to 16 yr of age, the lengths from a total of 2087 normal long bone segments (582 femurs and 645 tibias in boys, and 417 femurs and 443 tibias in girls) were measured.
Children were grouped by years of bone age, which was determined by using the Korean specific bone age standard; TW2-20 method. The growth spurt occurred in girls from eight to eleven years by bone age, and in boys from eleven to thirteen years.
The mean tibial length relative to the mean femoral length was 0.78 in boys and 0.79 in girls. The overall growth pattern was similar to that observed in American children in the 1960s. Korean children and adolescents appear to have a different tempo of skeletal maturation during pubertal growth from that of English and American children and adolescents. The Korean standard growth curve and the Korean bone age chart allow determination of the presence of any existent growth abnormalities and predic- tion of future remaining growth in lower extremities. These normative growth stan- dards can be used for leg-length equalization purposes in children with anisomelia.
Key Words : Bone age Measurement; Age Determination by Skeleton; Growth; Children; Korea
Received : 10 March 2003 Accepted : 17 June 2003
in the atlas was identical to the actual radiograph of a given child, the corresponding standard bone age set equal to the real bone age. But, when the actual image was not identical to that in the atlas, two consecutive images of standard bone ages, which best fitted the actual image, were selected to deter- mine the bone age, which was calculated from the ratio of the TW-2 maturity scores of the two corresponding standard bone ages. The reliability in determining the bone age was tested by using Kappa statistics on 25 randomly selected radiographs.
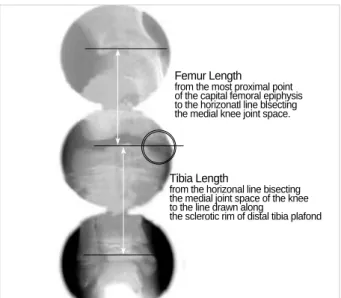
The lengths of femurs and tibias were measured on an ortho- scannogram of the lower extremity (Fig. 1). Femur length was defined as the distance between the horizontal lines pass- ing the most proximal point of the capital femoral epiphysis to the horizontal line bisecting the medial joint space of the knee. The length of the tibia was defined as the distance be- tween the horizontal line bisecting the medial joint space of the knee and the line drawn along the sclerotic rim of distal
tibial plafond. Children were grouped by bone age years. The Fig. 1. A diagram showing how to measure the lengths of the femur and tibia on an orthoscannogram.
Femur Length
from the most proximal point of the capital femoral epiphysis to the horizonatl line blsecting the medial knee joint space.
Tibia Length
from the horizonal line bisecting the medial joint space of the knee to the line drawn along
the sclerotic rim of distal tibia plafond
Number of
cases Age Mean SD*
Femur
SE� Median Distribution
+2SD +1SD -1SD -2SD
23 3 (30-42 mo) 22.31 1.455 0.303 22.50 25.22 23.77 20.86 19.40
33 4 (43-54 mo) 24.62 1.431 0.249 24.70 27.48 26.05 23.19 21.76
53 5 (55-66 mo) 27.91 1.744 0.240 28.10 31.40 29.65 26.17 24.42
42 6 (67-78 mo) 30.09 1.750 0.270 29.70 33.59 31.84 28.34 26.59
52 7 (79-90 mo) 31.66 1.926 0.267 31.55 35.51 33.59 29.73 27.81
91 8 (91-102 mo) 33.24 1.944 0.204 33.20 37.13 35.18 31.30 29.35
39 9 (103-114 mo) 35.25 1.809 0.290 35.00 38.87 37.06 33.44 31.63
32 10 (115-126 mo) 36.77 1.721 0.304 36.10 40.21 38.49 35.05 33.33
39 11 (127-138 mo) 38.19 1.656 0.265 38.00 41.50 39.85 36.53 34.88
32 12 (139-150 mo) 40.21 1.812 0.320 40.25 43.83 42.02 38.40 36.59
43 13 (151-162 mo) 42.80 1.663 0.254 42.50 46.13 44.46 41.14 39.47
31 14 (163-174 mo) 43.74 1.864 0.335 43.80 47.47 45.60 41.88 40.01
31 15 (175-186 mo) 44.65 1.763 0.317 44.90 48.18 46.41 42.89 41.12
41 16 (187-198 mo) 45.46 1.884 0.294 45.20 49.23 47.34 43.58 41.69
Number of
cases Age Mean SD*
Tibia
SE� Median Distribution
+2SD +1SD -1SD -2SD
23 3 (30-42 mo) 17.95 0.864 0.180 17.90 19.68 18.81 17.09 16.22
31 4 (43-54 mo) 19.90 1.236 0.222 19.80 22.37 21.14 18.66 17.43
63 5 (55-66 mo) 21.60 1.548 0.195 21.60 24.70 23.15 20.05 18.50
48 6 (67-78 mo) 23.35 1.541 0.222 23.40 26.43 24.89 21.81 20.27
48 7 (79-90 mo) 24.64 1.704 0.246 24.60 28.05 26.34 22.94 21.23
87 8 (91-102 mo) 26.02 1.723 0.185 26.00 29.47 27.74 24.30 22.57
44 9 (103-114 mo) 27.28 1.577 0.238 27.15 30.43 28.86 25.70 24.13
33 10 (115-126 mo) 28.77 1.737 0.302 28.70 32.24 30.51 27.03 25.30
47 11 (127-138 mo) 30.08 1.590 0.232 29.90 33.26 31.67 28.49 26.90
38 12 (139-150 mo) 31.45 1.655 0.269 31.15 34.76 33.11 29.80 28.14
52 13 (151-162 mo) 33.40 1.620 0.225 33.30 36.64 35.02 31.78 30.16
39 14 (163-174 mo) 33.89 1.667 0.267 34.00 37.22 35.56 32.22 30.56
41 15 (175-186 mo) 34.72 1.678 0.262 34.90 38.08 36.40 33.04 31.36
51 16 (187-198 mo) 35.34 1.673 0.234 35.00 38.69 37.01 33.67 31.99
SD*: standard deviation, SE�: standard error.
Table 1.Length (cm) of the long bones according to Korean bone age in boys
mean, median, standard error, and standard deviation of the lengths of femurs and tibias at each bone age year were calcu- lated. The bone age initially determined in months was then converted to the age in years after rounding off to the nearest integer.
We evaluated the growth characteristics of the lower extrem- ities in Korean children aged from 3 to 16 yr by bone age. The disparity between the chronological age and the bone age, and the velocity of annual longitudinal growth (cm/year) of the femur and tibia in each gender was calculated. The growth velocity of each proximal and distal epiphyses of the femur was presumed based on the assumption that the proximal physis of the femur contributes a constant 29%, and the distal physis, a constant 71% to the total growth of the femur (6). The gro- wth rates of the proximal and distal tibia were calculated in a similar manner, assuring that the proximal physis of the tibia attributes 57%, and the distal physis attributes 43% to the total tibial growth (6). The relative length ratios of the femur and tibia were evaluated and compared with previously pub- lished Caucasian data (7). An example how to use the Korean
growth chart in limb length equalization is provided in the Appendix.
RESULTS
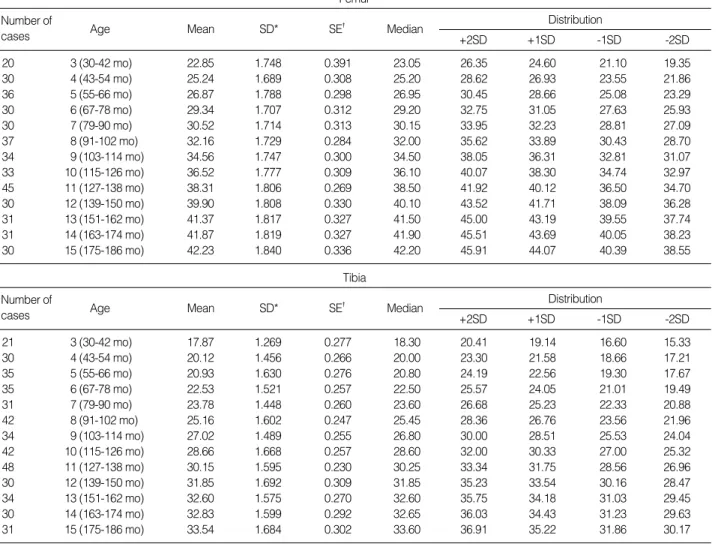
When the reliability in determining the bone age was ana- lyzed, the kappa score of inter-observer variation was found to be 0.66. The kappa scores of intra-observer variation were 0.83 for an experienced reader and 0.71 for a novice. Table 1 and 2 present the mean, median, standard error, and standard deviation, of normal femoral and tibial lengths by bone age for Korean boys and girls (Fig. 2, 3). The disparity between chronological age and bone age was within one year for all subjects. Two growth rate maxima occurred during the dif- ferent growing stages after a bone age of three years, namely early growing phase, before growth spurt, growth spurt, and after spurt phase (Table 3). The first growth rate peak, which occurred in early growing phase, was observed at bone ages of three to six years in both boys and girls. The second highest
Number of
cases Age Mean SD*
Femur
SE� Median Distribution
+2SD +1SD -1SD -2SD
20 3 (30-42 mo) 22.85 1.748 0.391 23.05 26.35 24.60 21.10 19.35
30 4 (43-54 mo) 25.24 1.689 0.308 25.20 28.62 26.93 23.55 21.86
36 5 (55-66 mo) 26.87 1.788 0.298 26.95 30.45 28.66 25.08 23.29
30 6 (67-78 mo) 29.34 1.707 0.312 29.20 32.75 31.05 27.63 25.93
30 7 (79-90 mo) 30.52 1.714 0.313 30.15 33.95 32.23 28.81 27.09
37 8 (91-102 mo) 32.16 1.729 0.284 32.00 35.62 33.89 30.43 28.70
34 9 (103-114 mo) 34.56 1.747 0.300 34.50 38.05 36.31 32.81 31.07
33 10 (115-126 mo) 36.52 1.777 0.309 36.10 40.07 38.30 34.74 32.97
45 11 (127-138 mo) 38.31 1.806 0.269 38.50 41.92 40.12 36.50 34.70
30 12 (139-150 mo) 39.90 1.808 0.330 40.10 43.52 41.71 38.09 36.28
31 13 (151-162 mo) 41.37 1.817 0.327 41.50 45.00 43.19 39.55 37.74
31 14 (163-174 mo) 41.87 1.819 0.327 41.90 45.51 43.69 40.05 38.23
30 15 (175-186 mo) 42.23 1.840 0.336 42.20 45.91 44.07 40.39 38.55
Number of
cases Age Mean SD*
Tibia
SE� Median Distribution
+2SD +1SD -1SD -2SD
21 3 (30-42 mo) 17.87 1.269 0.277 18.30 20.41 19.14 16.60 15.33
30 4 (43-54 mo) 20.12 1.456 0.266 20.00 23.30 21.58 18.66 17.21
35 5 (55-66 mo) 20.93 1.630 0.276 20.80 24.19 22.56 19.30 17.67
35 6 (67-78 mo) 22.53 1.521 0.257 22.50 25.57 24.05 21.01 19.49
31 7 (79-90 mo) 23.78 1.448 0.260 23.60 26.68 25.23 22.33 20.88
42 8 (91-102 mo) 25.16 1.602 0.247 25.45 28.36 26.76 23.56 21.96
34 9 (103-114 mo) 27.02 1.489 0.255 26.80 30.00 28.51 25.53 24.04
42 10 (115-126 mo) 28.66 1.668 0.257 28.60 32.00 30.33 27.00 25.32
48 11 (127-138 mo) 30.15 1.595 0.230 30.25 33.34 31.75 28.56 26.96
30 12 (139-150 mo) 31.85 1.692 0.309 31.85 35.23 33.54 30.16 28.47
34 13 (151-162 mo) 32.60 1.575 0.270 32.60 35.75 34.18 31.03 29.45
30 14 (163-174 mo) 32.83 1.599 0.292 32.65 36.03 34.43 31.23 29.63
31 15 (175-186 mo) 33.54 1.684 0.302 33.60 36.91 35.22 31.86 30.17
SD*: standard deviation, SE�: standard error.
Table 2.Length (cm) of the long bones according to Korean bone age in girls
peak occurred in puberty. In Korean boys, the second highest peak extended from eleven to thirteen years bone age. In con- trast, this peak occurred in Korean girls from eight to eleven years, i.e., it was more prolonged than observed in boys. The growth rates of the proximal and distal physes of the femur and tibia are shown in Table 4. The mean tibial length was 78% relative to the femur in boys and 79% in girls, shorter than that of Caucasian (7).
DISCUSSION
In the United States, Anderson et al. (6, 8) developed a gro-
wth curve, spanning one to 18-yr-olds. This curve is based upon longitudinal growth data of the normal femurs and tibias of American white children with polio in the 1950s and 1960s by using chronological age and bone age, as determined by the Greulich-Pyle atlas (9). These data have been used with some success to predict leg length discrepancy, although some mod- ifications were later made by Moseley (10), and Paley et al.
(11) to simplify its clinical use. Some authors have reported different results that contradict those of Anderson et al. (8), which were attributed to differences in ethnic origin, height, and socioeconomic status (12-14). Maresh (12) and Beumer et al. (13) produced results that differed from those of Ander- son et al. (8) within the same ethnic group of Caucasians. These
Femur Length (cm)
Bone Age in Years Bone Age in Years
Femur and Tibia Growth according to Bone Age in Boys
Error Bars show Mean+/-1, 2.0 SD Dot/Lines show Means
50.0
45.0
40.0
35.0
30.0
25.0
20.0
15.0 3 4 5 6 7 8 9 10 11 12 13 14 15 16
Fig. 2.A bone length chart for the normal femur and tibia in Korean boys from bone age three years through to sixteen years.
(Mean, +1SD, +2SD, -1SD, -2SD curves)
Tibia Length (cm)
45.0
40.0
35.0
30.0
25.0
20.0
15.0
10.0 3 4 5 6 7 8 9 10 11 12 13 14 15 16
Femur Length (cm)
Bone Age in Years Bone Age in Years
Femur and Tibia Growth according to Bone Age in Girls
Error Bars show Mean+/-1, 2.0 SD Dot/Lines show Means
50.0
45.0
40.0
35.0
30.0
25.0
20.0
15.0 3 4 5 6 7 8 9 10 11 12 13 14 15
Fig. 3.A bone length chart for the normal femur and tibia in Korean girls from bone age three years through to fifteen years.
(Mean, +1SD, +2SD, -1SD, -2SD curves)
Tibia Length (cm)
45.0
40.0
35.0
30.0
25.0
20.0
15.0
10.0 3 4 5 6 7 8 9 10 11 12 13 14 15
findings imply that a standard growth curve should be pre- pared by each country in order to assess any existent growth abnormality and to predict future growth at skeletal maturity, and that these be revised on a regular basis.
Assessment of bone age also depends upon the standards used, e.g., the TW-2 method, the TW-1 method, the Greulich and Pyle atlas, and the Roche-Wainer-Thissen (knee) method (15-18). In the present study, bone age was assessed by the mod- ified TW-2 method (4). Though disparities between chrono- logical age and bone age are known to occur, it is reported that they do not exceed 2 yr (19). In the current study, the dispar- ity of average values between chronological age and bone age were within a year.
Through the current study on the distribution of femur and tibia lengths, the use of the atlas of Korean specific bone age determination may allow a more accurate assessment of growth abnormalities and growth predictions. However, there are some weaknesses in this kind of cross-sectional study as compared to longitudinal studies, because the growth characteristics de- picted in the authors’growth chart may only approximate to real growth versus bone age. However, on considering the fact that when the more increase in the sample size, the less error of measurement occurs in a cross-sectional study; the growth curve developed during this cross-sectional study is believed to match those produced by substituting the longitudinal methods. Moreover, other authors have used cross-sectional study to determine bone age (4, 20).
The growth spurt may occur at different times depending on ethnicity, socio-economic status, environmental status (e.g., familial distress condition), and individual characteristics (1, 2, 14, 19, 21, 22). The annual growth rates and growth spurt can be deduced from the data in Tables 1 and 2. Growth spurts in Korean children occurred from bone age 8 to 11 yr in girls and from 11 to 13 yr in boys. These results suggest that in Koreans growth spurt occurs one year earlier in boys, and two years earlier in girls, than in comparative Caucasian children in the 1960s (6). These findings are in agreement to previous reports that Asian children may have a different growth tempo and a relatively earlier growth start than Caucasian children
(1, 2, 23). The reason for the relatively earlier skeletal maturi- ty of Korean children is unclear. The slightly higher growth rate and the longer growth spurt today seem to be attributed to the improved Korean socio-economic state.
The annual growth rates during growth spurt, as determined by the present study, were 1.55 cm/year in the distal femur and 0.95 cm/year in the proximal tibia, which were slightly higher than those in Caucasians (14), but the lengths of femurs and tibias at skeletal maturity were lower in Korean than in Caucasian boys and girls. The average heights of Korean boys and girls in the late 1990s at the ages of maturity were approx- imately 161 cm and 173 cm, respectively, which are similar to those observed in Caucasians in the 1960s. The average lengths of the femurs and tibias in Caucasian boys and girls in the 1960s at the ages of maturity were 45.6 cm and 43.3 cm, respectively, which are similar to those of the current study, i.e., 45.46 cm for the femur and 42.23 cm for the tibia.
The lengths of the low extremity in Caucasian of the 1990s have been reported to have steadily increased, and now are relatively longer than in the 1960s, though this difference has not been found to be significant (6, 8, 12, 13). One of the rea- sons for this change in growth may be related to an increase in the average stature at maturity (14). A report, in the times from the 1940s to 1960s, for Irish ancestry with polio in Bo- ston, indicated that the average statures at maturity in girls and boys were 162 cm and 175 cm, respectively (6). Another report for Northwest European descent in the 1990s indicat- ed that the average statures at maturity in girls and boys had increased to approximately 167 cm and 179 cm, respectively (14). Pirchett (14), therefore, recommended that these changes in characteristics of growth should be kept in mind when pre- dicting growth of the lower extremities.
In summary, Korean children appear to have relatively ear- lier growth spurt and relatively a shorter tibial length relative to the femur versus Caucasian children. It is believed that stan- dard Korean growth curves of the normal femur and tibia, in conjunction with an atlas of Korean specific bone age, would be helpful to determine growth characteristics and to predict growth for leg length equalization purposes.
*early growth: from three to six years by bone age.
pre-spurt: in girls, from six to eight years by bone age.
in boys, from six to eleven years by bone age.
growth spurt: in girls, from eight to eleven years by bone age.
in boys, from eleven to thirteen years by bone age.
post-spurt: in girls, after eleven years until maturity by bone age.
in boys, after thirteen years until maturity by bone age.
Early growth Pre-spurt Growth spurt Post-spurt
Boys Femur 2.59 1.62 2.31 0.89
Tibia 1.80 1.35 1.66 0.65
Girls Femur 2.16 1.41 2.05 0.78
Tibia 1.55 1.32 1.66 0.56
Table 3.The differences of growth rates (cm/year) at the grow- ing stage
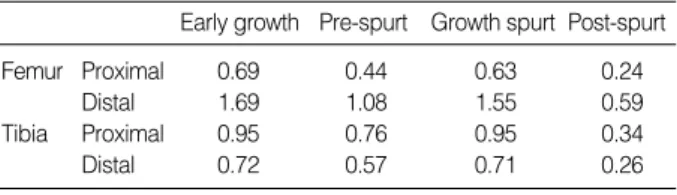
*early growth: from three to six years by bone age.
pre-spurt: in girls, from six to eight years by bone age.
in boys, from six to eleven years by bone age.
growth spurt: in girls, from eight to eleven years by bone age.
in boys, from eleven to thirteen years by bone age.
post-spurt: in girls, after eleven years until maturity by bone age.
in boys, after thirteen years until maturity by bone age.
Early growth Pre-spurt Growth spurt Post-spurt
Femur Proximal 0.69 0.44 0.63 0.24
Distal 1.69 1.08 1.55 0.59
Tibia Proximal 0.95 0.76 0.95 0.34
Distal 0.72 0.57 0.71 0.26
Table 4.The growth rates (cm/year) of the proximal and distal physes of the femur and tibia at different growing stages
REFERENCE
1. Zhen OY, Baolin L. Skeletal maturity of the hand and wrist in Chinese school children in Harbin assessed by the TW2 method. Ann Hum Biol 1986; 13: 183-7.
2. Murata M. Characteristics of pubertal growth in Japanese children from the standpoint of skeletal growth. Acta Paediatr Jpn 1992; 34:
236-40: discussion 240-2.
3. Tanner JM, Whitehouse RH, Cameron N, Marshall WA, Healy MJR, Goldstein H. Assessment of skeletal maturity and prediction of adult height (TW2 Method). London: Academic Press 1983.
4. Yeon KM. Korean Society of Pediatric Radiology. Standard bone-age of infants and children in Korea. J Korean Med Sci 1997; 12: 9-16.
5. Yeon KM, Kim IO. Normal Standard Bone Age in Korean Children.
Seoul: SungMunGak Press 1999.
6. Anderson M, Green WT, Messner MB. Growth and Predictions of growth in the lower extremities. J Bone Joint Surg 1963; 45-A: 1-14.
7. Maresh MM. Linear Growth of long bones of the extremities from infan- cy through adolescence; continuing studies. Am J Dis Child 1955; 89:
725-42.
8. Anderson M, Messener MB, Green WT. Distribution of lengths of the normal femur and tibia in children from one to eighteen years of age.
J Bone Joint Surg 1964; 46-A: 1197-202.
9. Greulich WW, Pyle SI. Radiographic atlas of skeletal development of the hand and wrist. (Ed. 1, 1950.) Ed. 2 Stanford, Stanford University Press 1959.
10. Mosely CF. A straight line graph for leg-length discrepancies. J Bone Joint Surg 1977; 59-A: 174-9.
11. Paley D, Bhave A, Herzenberg JE, Bowen JR. Multiplier method for predicting limb-length discrepancy. J Bone Joint Surg 2000; 82- A: 1432-46.
12. Maresh MM. Measurements from roentgenograms. In Human Growth and Development, edited by R. W. McCammon. Springfield, Illinois, Charles C Thomas 1970; 157-81.
13. Beumer A, Lampe HI, Swierstra BA, Diepstraten AF, Mulder PG. The straight line graph in limb length inequality. A new design based on 182 Dutch children. Acta Orthop Scand 1997; 68: 355-60.
14. Pirtchett JW. Longitudinal growth and growth-plate activity in the lower extremity. Clin Orthop 1992; 275: 274-9.
15. Bull RK, Edward PD, Kemp PM, Fry S, Hughes IA. Bone age assess- ment: a large scale comparison of the Greulich and Pyle, and Tanner and Whitehouse (TW2) methods. Arch Dis Child 1999; 81: 172-3.
16. Sarria A, Moreno L, Bueno M. Analysis of the Greulich-Pyle atlas using the TW2 and TW2-A method. An Esp Pediatr 1986; 24: 105- 10.
17. Vignolo M, Milani S, DiBattista E, Naselli A, Moster M, Aicardi G.
Modified Greulich-Pyle, Tanner-Whitehouse, and Roche-Wainer- Thissen (Knee) methods for skeletal age assessment in a group of Italian children and adolescents. Eur J Pediatr 1990; 149: 314-7.
18. Beunen G, Ostyn M, Renson R, Simon J, VanGerven D. Patterns of TW-1 and TW-2 skeletal age differences in 12-19-year-old Belgian boys. Ann Hum Biol 1983; 10: 479-82.
19. Alcardi G, Vignolo M, Milani S, Naselli A, Magliano P, Garzia P.
Assessment of skeletal maturity of the hand-wrist and knee: A com-
parison among methods. Am J Hum Biol 2000; 12: 610-5.
20. Murata M. Japanese specific bone age standard on the TW2. Clin Pedi- atr Endocrinol 1993; 3: 35-41.
21. Shapiro E. Developmental patterns in lower-extremity length discrep- ancies. J Bone Joint Surg 1982; 64-A: 639-51.
22. Hulanicka B, Gronkiewicz L, Koniarek J. Effect of familial distress on growth and maturation of girls: a longitudinal study. Am J Hum Biol 2001; 13: 771-6.
23. Melsen B, Wenzel A, Miletic T, Andreasen J, Vagn-Hansen PL, Terp S. Dental and skeletal maturity in adoptive children: assessments at arrival and after one year in the admitting country. Ann Hum Biol 1986;
13: 153-9.
APPENDIX
An example of a girl with congenital hemihypotrophy of the left lower extremity is given to predict future growth and final discrepancy using the growth remaining method (6). In order to determine the measurement error when using the American data to predict final discrepancy at skeletal matu- rity, the calculated data on the basis of Korean standards of the femur and tibia was compared with those calculated using the data of Anderson et al. (6).
Calculation using the length standards of the cur- rent study (Korean) (Table 2, Fig. 3)
A. Assessment of Past Growth
1. Growth of Long Leg
=(Femur
+
Tibia at last visit)-(Femur+
Tibia at first visit)=(37.8
+
30.6)-(34+
27.1)=68.4-61.1=7.3 cm2. Growth of Short Leg
=(Femur
+
Tibia at last visit)-(Femur+
Tibia at first visit)=(34.5
+
27.9)-(32.1+
26.0)=62.4-58.1=4.3 cm3. Present discrepancy=length of long leg-length of short length
=68.4-62.4=6 cm
4. Growth inhibition
=(growth of long leg-growth of short leg)/growth of long leg
Age (yr) Skeletal age (yr) Right femur length (cm)
Right tibia length (cm)
7+11 8+5 34.0 27.1
8+11 9+2 35.2 28.0
9+11 10+7 37.8 30.6
Age (yr) Skeletal age (yr) Left femur length (cm)
Left tibia length (cm)
7+11 8+5 32.1 26.0
8+11 9+2 33.2 26.9
9+11 10+7 34.5 27.9
=(7.3-4.3)/7.3=0.41
B. Prediction of Future Growth and Discrepancy
1. Growth percentage
=(length of long bone at last visit/length of mean popula- tion at last visit)×100
*The length of mean population can be achieved using the data in the Table 2 or Fig. 3.
=mean length of 10 yr
+
0.6 yr×(mean length of 11yr- mean length of 10 yr)={36.52
+
0.6×(38.31-36.52)}+
{28.66+
0.6×(30.15- 28.66)}=37.59
+
28.55=66.1Growth percentage=(68.4/66.1)×100=103.5%
2. Predicted value of long leg length at maturity
=(growth percentage×length of mean population at maturity)/100
={103.5×(femur length+tibia length at maturity)}/100
={103.5×(42.23
+
33.54)}/100=78.43. Future growth of long leg=mature length-present length
=78.4-68.4=10 cm
4. Future increase in discrepancy
=future growth of long leg x growth inhibition
=10×0.41=4.1 cm
5. Predicted discrepancy at maturity
=present discrepancy
+
future increase=6
+
4.1=10.1 cmCalculation using the length standards of Anderson et al. (6) (American)
A. Assessment of Past Growth
1. Growth of Long Leg
=(Femur
+
Tibia at last visit)-(Femur+
Tibia at first visit)=(37.8
+
30.6)-(34+
27.1)=68.4-61.1=7.3 cm2. Growth of Short Leg
=(Femur
+
Tibia at last visit)-(Femur+
Tibia at first visit)=(34.5
+
27.9)-(32.1+
26.0)=62.4-58.1=4.3 cm3. Present discrepancy=length of long leg-length of short length
=68.4-62.4=6 cm
4. Growth inhibition
=(growth of long leg-growth of short leg)/growth of long leg
=(7.3-4.3)/7.3=0.41
B. Prediction of Future Growth and Discrepancy
1. Growth percentage
=(length of long bone at last visit/length of mean popula- tion at last visit)×100
*The length of mean population can be achieved using the data of Anderson et al. (6)
=mean length of 9.9 yr
+
0.7yr×(mean length of 11.1 yr- mean length of 9.9 yr)/1.2=(37
+
29.8)+
0.7×{(39.2+
31.6)-(37+
29.8)}/1.2=68.2 Growth percentage=(68.4/68.2)×100=100.3%2. Predicted value of long leg length at maturity (15 yr)
=(growth percentage x length of mean population at maturity)/100
={100.3×(43.1
+
34.5)}/100=77.8 cm3. Future growth of long leg=mature length-present length
=77.8-68.4=9.4 cm
4. Future increase in discrepancy
=future growth of long leg x growth inhibition
=9.4×0.41=3.8 cm
5. Predicted discrepancy at maturity=present discrepancy+
future increase
=6
+
3.8=9.8 cmAge (yr) Femur (mean)
*Anderson’s data (6) of a complete longitudinal series of 50 girls Tibia (mean) Skeletal Age (yr)
8 33.1 26.3 7.6
9 35.0 28.0 8.7
10 37.0 29.8 9.9
11 39.2 31.6 11.1
12 41.1 33.2 12.5
13 42.4 34.2 13.8
14 43.1 34.5 14.8
15 43.2 34.6 15.8
16 43.3 34.6 16.4
Length of mean population is determined by calculating the relative ratio between the two mean values