Vol. 24, No. 3, pp. 339-345, May 31, 2018, ISSN 1229-3431(Print) / ISSN 2287-3341(Online) https://doi.org/10.7837/kosomes.2018.24.3.339
1
1. Introduction
The risk of accidents along coastal seas is gradually getting higher due to the increase of export-import traffic volume in domestic ports and marine leisure activities, and marine accidents have not decreased despite the implementation of various measures for deducing accidents. It is important that the characteristics of marine accidents should be identified by statistical analysis and that a variety of ex post measures for preventing accidents should be prepared.
Kim (2008) statistically analyzed marine accidents in South Korean waters. There were differences of monthly marine accidents in the West and the East Seas for fishing vessels. Park and Ahn (2007) also analyzed the accident rate by time zones using marine accidents data.
Many previous studies have set daytime and nighttime on a monotonous criterion for convenience. Seo and Bae (2002) classified daytime as from 0800h to 2000h, Kim and Kang (2011) from 0500h to 1900h, and Lee (2016) from 0600h to 1800h in their analyses of marine accidents. To analyze the traffic volume of ships, Kim and Gug (2006) classified it from 0600h to 1800h,
* First Author : [email protected], 061-550-2550
Park and Park (2016) from 0600h to 1800h for the research of the VTS officers’ proper controlling time, and Kim et al. (2017) from 0600h to 1800h for maritime traffic density analysis.
In the research of road traffic accidents, Seong et al. (2015) defined it from 0600h to 1800h. However, sunrise and sunset times differ depending to location and date. Previous research conveniently but monotonously applied the setup of day and night times.
Statistical analysis can be somewhat different depending on how daytime and nighttime standards are set, and the results of a study can be interpreted differently. With this standard, we classified the frequency of collision accidents by season, month, and time, and analyzed the differences between daytime and nighttime.
2. Materials and methods
2.1 Material of Research
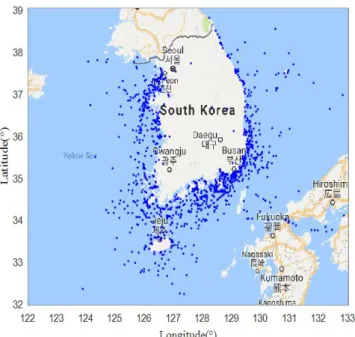
We collected 16 years (2001-2016) of ship collision accident reports from the Korean Maritime Safety Tribunal. We compiled the locations and dates of 1,309 cases of ship collision accidents into the database. Fig. 1 also illustrates the distribution of those collision accident locations. As can be seen, the collision accidents
Statistical Analysis of Ship Collision Accidents by Day and Night Times
Sang-Lok Yoo
*Cho-Young Jung
*** Wando Vessel Traffic Services, Korea Coast Guard, Wando 59126, Korea
** Division of Marine Industry - Transportation Science and Technology, Kunsan National University, Gunsan 54150, Korea
Abstract : Sunrise and sunset times differ depending on location and date. Previous studies conveniently but monotonously applied day and night times set up. This research defined the daytime and nighttime while considering the time of twilight according to the date and the location of ship collision accidents. Classifying the frequency of ship collision accidents with this standard, we conducted a chi-squared test for the difference between daytime and nighttime. The frequencies of ship collision accidents according to daytime and nighttime was compared by season, month, and time, and all of them showed statistically significant differences. The highest number of daytime ship collisions was 11.6 %, in June, and nighttime collisions peaked at 13.7 %, in December. The most frequent hour for daytime ship collisions was 0700h-0800h, at 10.2 %, and nighttime collisions peaked between 0400h-0500h, at 16.9 %. It is clear that the criteria used in previous studies cited was applied without any theoretical basis and likely only for the convenience of the researchers. It was found that results depend on what criteria are applied to the same research data. This study shows that statistical analyses of marine accidents, traffic volume, and congestion density should be carried out quantitatively while considering daytime and nighttime hours for each particular location and date.
Key Words : Twilight, Daytime, Nighttime, Ship collision accidents, Chi-squared test
most frequently occurred in the areas approaching the ports of Busan and Incheon.
Fig. 1. Distribution of ship collision accidents.
2.2 Method of Research
To separate the data of ship collision accidents into daytime and the nighttime, this research used the twilight time found on the website of the US Naval Observatory (USNO, 2018).
Normal twilight is when the center of the sun is located between the horizon and 6° below the horizon; it is the daybreak period from 30 minutes to the very minute before sunrise, and the vesperal time 30 minutes after sunset (Fig. 2).
Fig. 2 Concept of civil dawn and dusk.
This is a time when things can be distinguished by the naked eye and when daily outdoor activities are possible. Meanwhile, navigational twilight is when the height of the sun is 12~18°
below the horizon; the sky is dark and bright stars are starting to appear.
Astronomical twilight is the dark condition in which the height of the sun is 12~18° below the horizon. Fig. 3 shows the lux (lx) according to the height of the sun (Beier, 2006). The lux of astronomical twilight and navigational twilight is 0.001~5 lx, but that of normal twilight is 5~1,000 lx and ships can be distinguished by naked eyes at this time. Therefore, in this research, daytime and nighttime were defined by the standard of civil dawn and dusk.
Fig. 3. Illumination by altitude.
Fig. 4 and Fig. 5 show that the standard of daytime and nighttime can be changed because twilight time varies depending on location and date. Fig. 4 shows the normal twilight time during 2017 at 33° latitude, 124° longitude, and Fig. 5 at latitude 38° and longitude 131° respectively. In the case of January 1, 2017, then, civil dawn at 33° latitude and 124° longitude was 0718h and the civil dusk is 1814h. Each of them were at 33° latitude and 124°
longitude at 0701h and 1735h, respectively. The time at latitude 33° and longitude 124° was 17 minutes later than civil dawn and 39 minutes later than civil dusk than that of latitude 38°, longitude 131°. Therefore, it was confirmed that the standard of daytime and nighttime can be changed because twilight time is
different depending on the location and the date of ship collision accidents. With a total of 1,309 cases, chi-squared test was conducted to analyze the difference between days and nights by season, month, and time. A statistical significance test was conducted on both sides at a significant level of 5 % (p 0.05).
Fig. 4. Time of civil dawn and dusk by day at latitude 33°, longitude 124°.
Fig. 5. Time of civil dawn and dusk by day at latitude 38°, longitude 131°.
3. Statistical Analysis
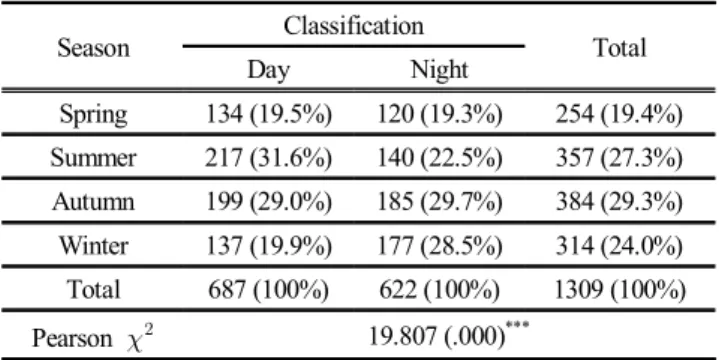
3.1 Analysis of Ship Collision Accidents by Season Table 1 represents a chi-squared test of the frequency of seasonal collision accidents according to daytime and nighttime.
The results of the classification of ship collision accidents by day and night showed that daytime accounted for 687 cases (52.5 %) and nighttime accounted for 622 cases (47.5 %).
Season Classification
Total
Day Night
Spring 134 (19.5%) 120 (19.3%) 254 (19.4%) Summer 217 (31.6%) 140 (22.5%) 357 (27.3%) Autumn 199 (29.0%) 185 (29.7%) 384 (29.3%) Winter 137 (19.9%) 177 (28.5%) 314 (24.0%) Total 687 (100%) 622 (100%) 1309 (100%)
Pearson 19.807 (.000)***
***p<.001
Table 1. Chi-squared test of the frequency of seasonal collision accidents according to daytime and nighttime
It was found that there was a statistically significant difference in seasonal collision accidents according to day and night (p=0.000). The results of ship collision accidents were classified by season, accounting for 384 cases (29.3 %) in autumn (September-November), which was the highest percentage, 357 cases (27.3 %) in summer (July-August), and 314 cases (24.0 %) in winter (December-February). In detail, it is shown that the highest frequency of ship collision accidents during the day was summer at 217 cases (31.6 %), then at 199 cases (29.0 %) in autumn.
Accidents at night were the most frequent in autumn at 185 cases (29.7 %), and then at 177 cases (28.5 %) in winter.
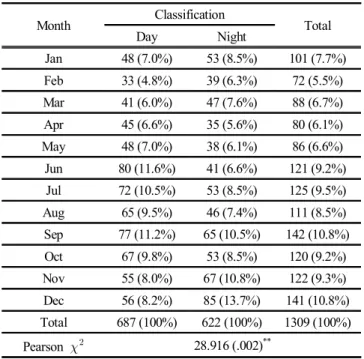
3.2 Analysis of Ship Collision Accidents by Month Table 2 represents a chi-squared test of the frequency of monthly collision accidents according to daytime and nighttime.
Monthly comparisons of ship collision accidents according to daytime and nighttime show a statistically meaningful difference (p=0.002). In the monthly analysis, accidents frequently occurred in September at 142 cases (10.8 %), followed by 141 cases (10.8
%) in December. In detail, the numbers of ship collision
most frequent month, and 77 (11.2 %) in September. There were 85 at night (13.7 %) in December and 67 (10.8 %) in November.
In the frequency analysis, daytime accidents were found to be relatively high from April to October, and nighttime accidents from November to March (Table 2).
Month Classification
Total
Day Night
Jan 48 (7.0%) 53 (8.5%) 101 (7.7%)
Feb 33 (4.8%) 39 (6.3%) 72 (5.5%)
Mar 41 (6.0%) 47 (7.6%) 88 (6.7%)
Apr 45 (6.6%) 35 (5.6%) 80 (6.1%)
May 48 (7.0%) 38 (6.1%) 86 (6.6%)
Jun 80 (11.6%) 41 (6.6%) 121 (9.2%)
Jul 72 (10.5%) 53 (8.5%) 125 (9.5%)
Aug 65 (9.5%) 46 (7.4%) 111 (8.5%)
Sep 77 (11.2%) 65 (10.5%) 142 (10.8%)
Oct 67 (9.8%) 53 (8.5%) 120 (9.2%)
Nov 55 (8.0%) 67 (10.8%) 122 (9.3%)
Dec 56 (8.2%) 85 (13.7%) 141 (10.8%)
Total 687 (100%) 622 (100%) 1309 (100%)
Pearson 28.916 (.002)**
**p<.01
Table 2. Chi-squared test of the frequency of monthly collision accidents according to daytime and nighttime
3.3 Analysis of Ship Collision Accidents by Time
Table 3 represents a chi-squared test of the frequency of hourly collision accidents according to daytime and nighttime.
An hourly comparison of ship collision accidents according to daytime and nighttime showed a statistically meaningful difference (p=0.000). The numbers of ship collision accidents by time were shown as 108 cases (8.3 %) at 0400h 0500h (the highest), 98 (7.5
%) at 0600h 0700h, and 89 (6.8 %) at 0500h 0600h. In detail, the numbers of ship collision accidents during daytime were 70 cases (10.2 %) at 0700h 0800h, 62 (9.0 %) at 0800h 0900h, and those of nighttime were 105 cases (16.9 %) at 0400h 0500h, 76 (12.2 %) at 0300h 0400h (Table 3).
The time frame during which daytime ship collisions occurred most frequently was 0700h 0900h. By contrast, nighttime collision accidents occurred most frequently between 0400h and 0500h in this study.
Hour Classification
Total
Day Night
00-01 0 (0.0%) 46 (7.4%) 46 (3.5%)
01-02 0 (0.0%) 37 (5.9%) 37 (2.8%)
02-03 0 (0.0%) 45 (7.2%) 45 (3.4%)
03-04 0 (0.0%) 76 (12.2%) 76 (5.8%)
04-05 3 (0.4%) 105 (16.9%) 108 (8.3%)
05-06 29 (4.2%) 60 (9.6%) 89 (6.8%)
06-07 59 (8.6%) 39 (6.3%) 98 (7.5%)
07-08 70 (10.2%) 2 (0.3%) 72 (5.5%)
08-09 62 (9.0%) 0 (0.0%) 62 (4.7%)
09-10 57 (8.3%) 0 (0.0%) 57 (4.4%)
10-11 60 (8.7%) 0 (0.0%) 60 (4.6%)
11-12 46 (6.7%) 0 (0.0%) 46 (3.5%)
12-13 48 (7.0%) 0 (0.0%) 48 (3.7%)
13-14 54 (7.9%) 0 (0.0%) 54 (4.1%)
14-15 55 (8.0%) 0 (0.0%) 55 (4.2%)
15-16 48 (7.0%) 0 (0.0%) 48 (3.7%)
16-17 42 (6.1%) 0 (0.0%) 42 (3.2%)
17-18 32 (4.7%) 3 (0.5%) 35 (2.7%)
18-19 17 (2.5%) 18 (2.9%) 35 (2.7%)
19-20 4 (0.6%) 35 (5.6%) 39 (3.0%)
20-21 1 (0.1%) 34 (5.5%) 35 (2.7%)
21-22 0 (0.0%) 40 (6.4%) 40 (3.1%)
22-23 0 (0.0%) 43 (6.9%) 43 (3.3%)
23-24 0 (0.0%) 39 (6.3%) 39 (3.0%)
Total 687 (100%) 622 (100%) 1309 (100%)
Pearson 1052.61 (.000)***
***p<.001
Table 3. Chi-squared test of the frequency of hourly collision accidents according to daytime and nighttime
4. Discussion
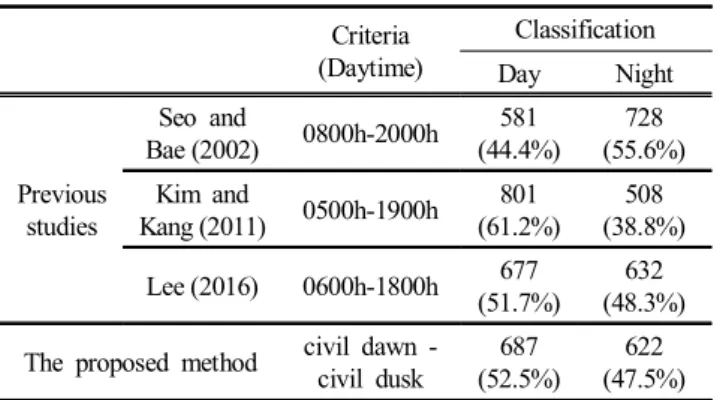
Table 4 shows the results of applying the proposed method and the results of the previous study methods to the designated collision data used in this study. A comparison of the results of this study and those applied by Kim and Kang (2011) showed an 8.7 % difference in daytime and nighttime collision counts, and an 8.1 % difference in the count using the method applied by Seo and Bae (2002). Furthermore, when the results of applying the methods of Seo and Bae (2002) and Kim and Kang (2011) were compared, there was a 16.8 % difference in daytime and nighttime
collision counts.
This illustrates that the interpretation of the results varies depending on which criteria are applied to the research data. When the Seo and Bae (2002) criteria are applied, it can erroneously appear that more collisions occur during nighttime than during daytime.
Criteria (Daytime)
Classification
Day Night
Previous studies
Seo and
Bae (2002) 0800h-2000h 581 (44.4%)
728 (55.6%) Kim and
Kang (2011) 0500h-1900h 801 (61.2%)
508 (38.8%) Lee (2016) 0600h-1800h 677
(51.7%)
632 (48.3%) The proposed method civil dawn -
civil dusk
687 (52.5%)
622 (47.5%) Table 4. Comparison of ship collision accidents according to
previous studies and the proposed method
Table 5 and Table 6 show the results of applying previous studies criteria to the monthly and hourly collision data used in this study.
Mon
Previous studies criteria
Seo and Bae(2002) Kim and Kang(2011) Lee (2016) Day
(0800h- 2000h)
Night (2000h-
0800h) Day (0500h-
1900h)
Night (1900h-
0500h) Day (0600h- 1800h)
Night (1800h-
0600h)
Jan 49 52 67 34 57 44
Feb 34 38 48 24 39 33
Mar 31 57 56 32 46 42
Apr 35 45 49 31 41 39
May 34 52 48 38 42 44
Jun 55 66 75 46 63 58
Jul 45 80 70 55 60 65
Aug 47 64 66 45 55 56
Sep 68 74 83 59 74 68
Oct 67 53 78 42 66 54
Nov 54 68 75 47 64 58
Dec 62 79 86 55 70 71
Total 581 728 801 508 677 632
Table 5. Comparison of monthly collision accidents according to previous studies criteria
Hour
Previous studies’ criteria
Seo and Bae (2002) Kim and Kang(2011) Lee (2016) Day
(0800h- 2000h)
Night (2000h- 0800h)
Day (0500h-
1900h) Night (1900h-
0500h) Day (0600h-
1800h) Night (1800h-
0600h)
00-01 - 46 - 46 - 46
01-02 - 37 - 37 - 37
02-03 - 45 - 45 - 45
03-04 - 76 - 76 - 76
04-05 - 108 - 108 - 108
05-06 - 89 89 - - 89
06-07 - 98 98 - 98 -
07-08 - 72 72 - 72 -
08-09 62 - 62 - 62 -
09-10 57 - 57 - 57 -
10-11 60 - 60 - 60 -
11-12 46 - 46 - 46 -
12-13 48 - 48 - 48 -
13-14 54 - 54 - 54 -
14-15 55 - 55 - 55 -
15-16 48 - 48 - 48 -
16-17 42 - 42 - 42 -
17-18 35 - 35 - 35 -
18-19 35 - 35 - - 35
19-20 39 - - 39 - 39
20-21 - 35 - 35 - 35
21-22 - 40 - 40 - 40
22-23 - 43 - 43 - 43
23-24 - 39 - 39 - 39
Total 581 728 801 508 677 632
Table 6. Comparison of hourly collision accidents according to previous studies’ criteria
When the results of applying the methods of this study and Seo and Bae (2002) were compared, there was a difference of 27 between daytime and nighttime collision counts in July, followed by 25 in June. There was a difference of 70 between daytime and nighttime collision counts between 0700h and 0800h, followed by 59 between 0600h and 0700h. As shown in Fig. 4 and Fig. 5, the time of civil dawn in South Korea from March to August is generally before 0600h, which results in classifying collisions occurring between 0600h and 0800h as occurring during nighttime.
When the results of applying the methods of this study and that of
between daytime and nighttime collision counts in December, followed by 20 in November. There was a difference of 60 between daytime and nighttime collision counts between 0500h and 0600h, followed by 39 between 0600h and 0700h. The time of civil dawn in South Korea from October to February is generally after 0600h, which results in classifying collisions between 0500h and 0700h as occurring during daytime.
When the results of applying the methods of this study and Lee (2016) were compared, there was a difference of 17 between daytime and nighttime collision counts in June, followed by 14 in December. There was a difference of 39 between daytime and nighttime collision counts between 0600h and 0700h, followed by 29 between 0500h and 0600h. This is the result of classifying data, as nighttime collisions occurred between 0500h and 0600h from March to August, and those classed as daytime collisions occurred between 0600h and 0700h from October to February.
5. Conclusion
This research considered daytime and nighttime as depending on the time of twilight according to the date and the location of ship collisions. It is clear that the criteria used in the previous studies cited were applied for the convenience of the researcher without any theoretical basis. It was found that results depend on what criteria are applied to the same research data. This study shows that statistical analysis of marine accidents should be carried out quantitatively while considering daytime and nighttime hours depending on the location and the date.
The results of this study can serve as basic data for the systematic identification of collision accident status and the establishment of safety management. In addition, these results can be used as basic data to find ways to prevent ship collision accidents.
This research is the limited in that the in-depth analysis and its implications cannot be derived due to the limitation of the data. In this study, considering only the number of collisions, there was no consideration of the degree of damage per accident, that is, the size of the accidents or their casualties. Therefore, it is necessary to comprehensively analyze the elements of the severity of these collisions. Future in-depth research should be carried out to develop and analyze models that can predict the characteristics of ship collision accidents as they are changed by time and space through the systematic data collection of ship collision accidents.
Acknowledgements
The author wishes to acknowledge the financial support of the Fisheries Science Institute of Kunsan National University made in the program year of 2018.
References
[1] Beier, P.(2006), Effects of artificial night lighting on terrestrial mammals, Ecological consequences of artificial night lighting, pp. 19-42.
[2] Kim, J. H.(2008), A Statistical Observation on the Monthly Number of Marine Accidents in Korean waters, Journal of Korean Navigation and Port Research, Vol. 32, No. 10, pp.
751-757.
[3] Kim, J. H. and S. G. Gug(2006), Safe Navigation Plan for Dredging Operations to build Sunken Tunnel for Access Road between Busan-Geoje, Journal of Korean Navigation and Port Research, Vol. 30, No. 10, pp. 825-831.
[4] Kim, S. K. and J. P. Kang(2011), A Study on the Relationships between the Casualties of Fishing Boats and Meteorological Factors, Journal of Fisheries and Marine Sciences Education, Vol. 23, No. 3, pp. 351-360.
[5] Kim, S. T., H. K. Lee and I. Y. Gong(2017), Improving Assessment of Maritime Traffic Congestion Based on Occupancy Area Density Analysis for Traffic Vessels, Journal of Korean Society of Marine Environment & Safety, Vol. 23, No. 2, pp. 153-160.
[6] Lee, K. H.(2016), A Study on the Actual Condition and the Countermeasure of Marine Accidents, Journal of Police Science, Vol. 18, No. 6, pp. 27-53.
[7] Park, B. S. and Y. S. Ahn(2007), Statistical Analysis of Marine Accidents by ANOBA, Journal of Korean Society of Marine Environment & Safety, Vol. 13, No. 3, pp. 191-198.
[8] Park, S. W. and Y. S. Park(2016), A Basic Study on Development of VTS Control Guideline based on Ship's Operator's Consciousness, Journal of Korean Navigation and Port Research, Vol. 40, No. 3, pp. 105-111.
[9] Seo, M. S. and S. J. Bae(2002), The Study on the Analysis of Marine Accidents and Preventive Measures, Journal of Fisheries and Marine Sciences Education, Vol. 14, No. 2, pp. 149-160.
[10] Seong, B. J., G. H. Bae and H. H. Yoo(2015), Analysis of Temporal and Spatial Distribution of Traffic Accidents in
Jinju, Journal of the Korean Society for Geospatial Information Science, Vol. 23, No. 2, pp. 3-9.
[11] USNO(2018), Complete Sun and Moon Data for One Day, Atronomical Application Department of the U.S, Naval Observatory, Retrieved from http://aa.usno.navy.mil.
Received : 2018. 05. 02.
Revised : 2018. 05. 23. (1st) : 2018. 05. 27. (2nd) Accepted : 2018. 05. 29.