1) International Water Resources Research Institute, Chungnam National University
Sediment Erosion and Transport Experiments in Laboratory using Artificial Rainfall Simulator
Ram Krishna Regmi
1)・ Kwansue Jung
2)・ Hajime Nakagawa
3)・ Jaewon Kang
1)・ Giha Lee
†Received: November 1
st, 2013; Revised: November 13
th, 2013; Accepted: February 18
th, 2014
ABSTRACT : Catchments soil erosion, one of the most serious problems in the mountainous environment of the world, consists of a complex phenomenon involving the detachment of individual soil particles from the soil mass and their transport, storage and overland flow of rainfall, and infiltration. Sediment size distribution during erosion processes appear to depend on many factors such as rainfall characteristics, vegetation cover, hydraulic flow, soil properties and slope. This study involved laboratory flume experiments carried out under simulated rainfall in a 3.0 m long × 0.8 m wide × 0.7 m deep flume, set at 17º slope. Five experimental cases, consisting of twelve experiments using three different sediments with two different rainfall conditions, are reported. The experiments consisted of detailed observations of particle size distribution of the out-flow sediment. Sediment water mixture out-flow hydrograph and sediment mass out-flow rate over time, moisture profiles at different points within the soil domain, and seepage outflow were also reported. Moisture profiles, seepage outflow, and movement of overland flow were clearly found to be controlled by water retention function and hydraulic function of the soil. The difference of grain size distribution of original soil bed and the out-flow sediment was found to be insignificant in the cases of uniform sediment used experiments. However, in the cases of non-uniform sediment used experiments the outflow sediment was found to be coarser than the original soil domain. The results indicated that the sediment transport mechanism is the combination of particle segregation, suspension/saltation and rolling along the travel distance.
Keywords : Flume experiment, Simulated rainfall, Water retention function, Soil erosion, Sediment transport, Particle segregation Journal of the Korean Geo-Environmental Society
15(4): 13~27. (April, 2014) http://www.kges.or.kr
ISSN 1598-0820 DOI http://dx.doi.org/10.14481/jkges.2014.15.4.13
1. Introduction
Catchments soil erosion, one of the most serious problems in the mountainous environment of the world, consists of a complex phenomenon involving the detachment of individual soil particles from the soil mass and their transport, storage and overland flow of rainfall, and infiltration. Changes in land use and climate can act as triggers for soil erosion and catchment sediment yield (Wick & Bathurst 1996). Soil erosion is closely related to rainfall partly through detaching power of raindrops hitting the soil surface and partly through contribution of rain to runoff (Morgan, 2005). This applies particularly to erosion by overland flow and rills, for which intensity is generally considered to be the most important rainfall charac- teristic.
Sediment transport comprises the movement of sediment particles due to the combination of the gravity force, that acting on the sediment, and the overland flow in which the sediment is entrained. When sufficient energy is no longer available
to transport, deposition takes place. In many studies (Rose, 1993; Haan et al., 1994), the sediment generation, transport and deposition process have been described well. Depletion of soil is caused by detachment and re-detachment by raindrops, and entrainment and re-entrainment by overland flow, accom- panied by transport in sheet and rill flow (Rose, 1993). Rill erosion occurs when water moving over the soil surface flows along preferential pathways forming an easily recognizable channels (Rose, 1993). Rill initiation is controlled by the cohesive strength of the soil and the shear forces exerted on the soil. Flow in rills acts as a transporting agent for the removal of sediment down-slope from rill and inter-rill sources, although if the shear stress in the rill is high enough the rill flow may also detach significant amounts of soil (Nearing et al., 1994).
In contrast to rill erosion, gully erosion describes channels
of concentrated flow that are too deep (Rose, 1993). The
raindrop impact in gully flow is not an important factor in
terms of flow resistance or in sediment particle detachment
as in that of sheet and rill flows (Bennett, 1974).
Once runoff starts over the surface areas and in the streams, the quantity and size of material transported increases with the velocity of the runoff. The slope may decrease at some point, resulting in a decreased velocity and hence a decreased transport capacity (Haan et al., 1994). The sediment is then deposited, starting with the large primary particles and aggre- gates. Smaller particles are transported further down-slope, resulting in the enrichment of fines. The basic relationship describing sediment transport by overland flow is the sediment continuity equation, which relates the change in sediment storage over time, and the change in sediment flow rate along the hillslope to effective sources and sinks (Haan et al., 1994). Increased slope length and steepness produces higher overland flow velocities and correspondingly higher erosion (Haan et al., 1994).
The amount of sediment transport can be quantified using numerous available methods, in which the required data can be collected through field and laboratory experimental studies.
Therefore, most of the scientific research has been conducted based on field and laboratory experiments.
Rainfall simulators have been extensively used in the laboratory and field experimental soil erosion and sediment transport researches. By using rainfall simulator, Kilinc &
Richardson (1973) evaluated the mechanism of soil erosion and concluded that slope and rainfall intensity had significant impact on soil erosion and sediment transport. Wischmeier
& Smith (1978) and Govers (1991) noted an exponential relationship between the soil loss and slope gradient. Berger et al. (2010) reported that increasing rainfall intensity had larger effect on sediment yield than increasing slope. Hansen et al. (1999); Kamphorst et al. (2000) and Planchon et al.
(2001) examined the impact of surface roughness on overland flow. It was determined that a higher degree of soil surface roughness enhances the infiltration rate of water through the soil surface and reduces overland flow, which in turn reduces the erosive capacity of runoff (Onstad, 1984; Huang &
Bradford, 1990; Hairsine et al., 1992). Poessen & Ingelmo- Sanchez (1992) observed that sediment yield increased with surface flow while performing experiments by using a labora- tory simulator spraying rainfall over different size of stones embedded into the soil.
Meyer et al. (1983) conducted a series of experiments to measure transport capacity of flow with combinations of different topographical slopes, flow rates, and sediment particle
sizes; and found that the flow rate also affected sediment transport, although not so greatly as gradient. Sediment transport was increased as particle size decreased, but there was minor effect of rainfall on sediment transport capacity. Govers (1990) carried out a series of experiments on different slopes and flow rates to examine sediment transport capacity of overland flow; and it has been shown the possibility to predict sediment transport capacity using simple empirical relationships, which show considerable variation with grain size, but not with flow regime. Nearing et al. (1997) conducted experiments to investigate rill erosion as a function of slope gradient and flow rate. Stream power was found to be a consistent and appropriate predictor in calculating unit sediment load. Besides, Ali et al. (2012) examined the influence of flow rate, mean flow velocity, flow depth, and bed slope on sediment transport capacity, and obtained strong relationships between sediment transport capacity and unit stream power and effective stream power.
Sediment size distributions appear to depend on many factors such as rainfall characteristics, vegetation cover, hydraulic flow, soil properties and slope. Most of the researchers agreed that sediment leaving an area is finer than that of the soil under surface erosion; and the sediment transport mechanism is the combination of suspension/saltation and rolling. However, in this regard, there are still some conflicting and unexplained results. Many studies in the past were lacking to incorporate the interactions among catchment position, surface and sub- surface hydrologic conditions, and erosion process. This paper presents the experiment results of laboratory flume based soil erosion due to rainfall carried out at two different rainfall intensities, using three different sediments. The experiments consisted of detailed observations of particle size distribution of the outflow sediment. Sediment water mixture outflow hydrograph and sediment mass outflow rate over time, moisture profiles at different points within the soil domain, and seepage outflow were also reported. This study investigated the soil erosion and sediment transport mechanisms based on direct observation during erosion and transport process, and the particle size distribution of the outflow sediment.
2. Experimental Method
This study involved laboratory flume experiments carried
Fig. 1. Experimental setup in Ujigawa Open Laboratory, DPRI, Kyoto University, Japan
out under simulated rainfall in a 3.0 m long × 0.8 m wide
× 0.7 m deep flume. The flume was set at 17º slope by the chain pulley arrangement that was provided to adjust its longitudinal inclination. A rainfall simulator was set up above the flume to provide artificial rainfall. At the downstream end, the soil was supported by a wooden plate. To drain-out subsurface flow, 2.0 cm opening space was provided between the plate and the flume end. A filter mat supported by the wooden plate was used to retain the soil against the opening space. The schematic diagram of the flume including instru- mentation and data acquisition system is shown in Fig. 1.
Three profile probes (PRs) were used to measure the temporal variation of moisture content at different locations inside the soil domain. The probe was profile probe type PR2 that consists of four sensors (SRs) in 10 cm spacing.
Load cell, model KYOWA LT-50KG, was used to measure outflow sediment load. Servo type water gauge (Detector, KENEK NST-10) was used to obtain outflow sediment-water mixture, by measuring the increase in water level of the downstream container. For the purpose of getting temporal change in grain size distribution of the eroded sediment, 0.40 m × 0.30 m × 0.08 m sized sampler boxes were used to collect the out-flow sediment. At the downstream end of the flume a measuring cylinder was used to collect the seepage outflow through a drain pan. Two digital video cameras (VCs) were used to capture the erosion-deposition activities and
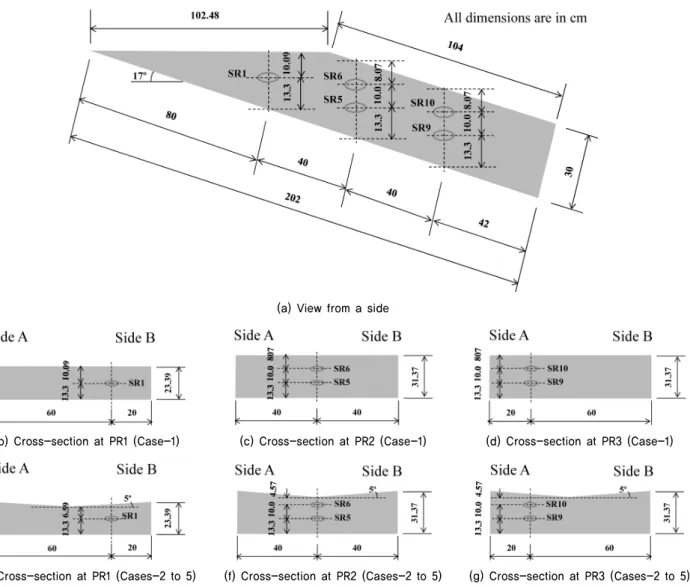
seepage outflow. The shape and size of the soil domain with the arrangement of SRs is shown in Fig. 2.
A space was allowed in the 1.0 m upstream reach of the
flume (Fig. 1) for providing runoff input essential for the
development of surface erosion. The soil surface at 1.04 m
downstream reach (sloping face of the soil domain) was made
parallel to the flume slope. To bury at least two sensors of
the profile probes in this reach, its upper limit thickness was
designed to 30 cm (Fig. 2). The remaining 0.98 m upstream
reach of the soil domain was longitudinally flat (horizontal
length = 102.48 cm). Twelve experiments were carried out
using different sediments with initially dry condition. The
experimental program is outlined in Table 1. The sediment
was placed on the rigid bed of the flume and compacted
uniformly in layers of approximately 5 cm thick with a steel
hand. The grain size distribution of the sediments is presented
in Fig. 3. Fig. 4 shows the water retention curve of these
sediments. Water retention data for the sediments used in the
experiments was obtained through DIK-3423 Multi-Fold pF
Meter. van Genuchten parameters (including residual moisture)
were estimated by non-linear regression analysis of water
retention data obtained by pF meter experiments. The saturated
hydraulic conductivity of the considered sediments was measured
through DIK-4012 Permeameter, 4 Fold Type, by the method
of constant head. Some parameter values of the sediments
used in the experiments are listed in Table 2.
(a) View from a side
(b) Cross-section at PR1 (Case-1) (c) Cross-section at PR2 (Case-1) (d) Cross-section at PR3 (Case-1)
(e) Cross-section at PR1 (Cases-2 to 5) (f) Cross-section at PR2 (Cases-2 to 5) (g) Cross-section at PR3 (Cases-2 to 5) Fig. 2. The shape and size of the soil domain with the arrangement of SRs
Table 1. Experimental program Exp.
Case Exp.
No. Sediment Initial condition
Pump supply
Avg. rainfall inside flume
Rainfall
duration Observation
1 1
S7 Dry 98 ltrs/min 93.06 mm/hr 39.50 min Erosion-deposition and water-sediment outflow
2 Moisture profile and seepage discharge
2 3
S7 Dry 98 ltrs/min 93.06 mm/hr 31.00 min Erosion-deposition and water-sediment outflow
4 Moisture profile and seepage discharge
3 5
Smix1-6 Dry 98 ltrs/min 93.06 mm/hr 55.00 min Erosion-deposition and water-sediment outflow
6 Moisture profile and seepage discharge
4 7
Smix4-7 Dry 98 ltrs/min 93.06 mm/hr 26.00 min
Erosion-deposition and water-sediment outflow
8 Moisture profile and seepage discharge
11 Temporal change in grain size distribution of out-flow sediment
5 9
Smix4-7 Dry 60 ltrs/min 67.47 mm/hr 26.25 min
Erosion-deposition and water-sediment out-flow
10 Moisture profile and seepage discharge
12 Temporal change in grain size distribution of out-flow sediment
S7 = Silica sand number 7, Smix1-6 = Silica sand number 1 to 6 are mixed in equal proportion by volume, Smix4-7 = Silica sand number 4 to 7 are mixed in equal proportion by volume.
In the experiments for case-1, the designed soil surface was horizontal in lateral direction. However, using initially dry sediment, it was practically difficult to make the soil
surface perfectly smooth as per the design. Hence surface
water flow path, initially from the head reach, was not observed
identical in both the experiments for this experimental case.
Fig. 3. Grain size distribution of the sediments considered
Fig. 4. Water retention curve for different sediments
Fig. 5. Arrangement of rainfall measuring beakers inside the flume
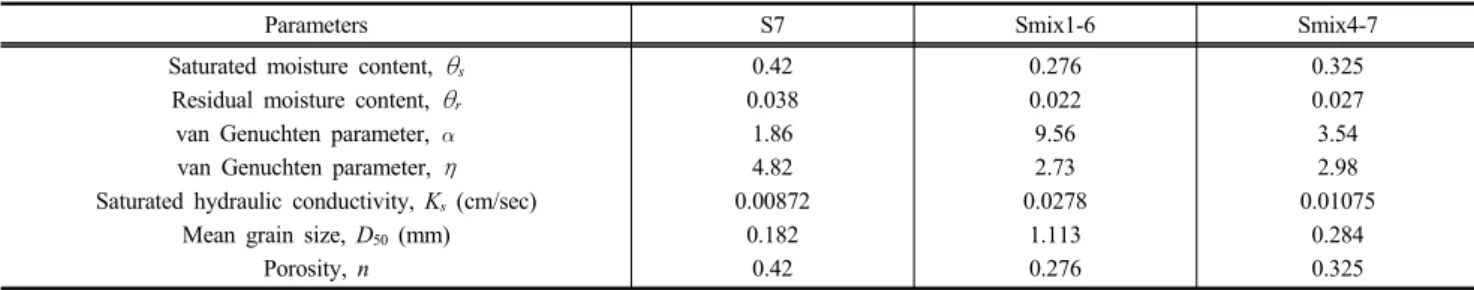
Table 2. Some parameter values of the sediments considered
Parameters S7 Smix1-6 Smix4-7
Saturated moisture content, θs
Residual moisture content, θr
van Genuchten parameter, van Genuchten parameter, η Saturated hydraulic conductivity, Ks (cm/sec)
Mean grain size, D50 (mm) Porosity, n
0.42 0.038
1.86 4.82 0.00872
0.182 0.42
0.276 0.022 9.56 2.73 0.0278
1.113 0.276
0.325 0.027 3.54 2.98 0.01075
0.284 0.325
Therefore, in other experimental cases it was designed to v-shape in lateral direction (Fig. 2) to achieve the identical surface water flow path through channelizing the flow towards v-notch initially from the head reach. The experiments were conducted using two rainfall conditions (98 and 60 liters/
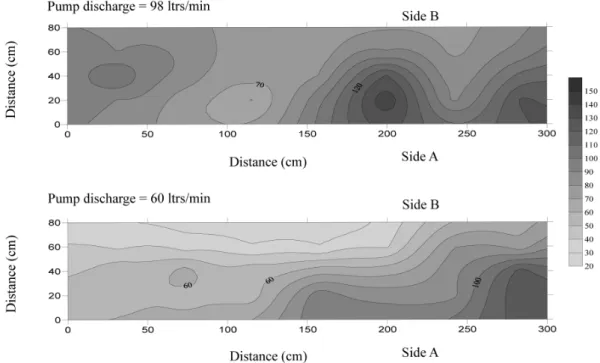
minute discharges from water supply pump). For these supply conditions, the rainfall intensity inside the flume was measured by using 21 bucks having opening diameter 20.75 cm. During these rainfall measurements, the flume was aligned perfectly horizontal. The measured average rainfall inside the flume was 93.06 mm/hr and 67.47 mm/hr in 98 and 60 liters per minute supply pump discharge, respectively. Figs. 5 and 6 show the arrangement of buckets inside the flume and a contour maps showing rainfall distribution over it for each rainfall condition, respectively.
Rainfall simulators are devices to duplicate the physical
characteristics of natural rainfall. The primary purpose of the
layout of nozzle of rainfall simulator and pumping system
is to simulate natural rainfall accurately and precisely. Desirable
characteristics for rainfall simulators used in erosion and
hydrological studies include the rainfall intensity, spatial rainfall
uniformity over the entire test plot, the drop size, its dis-
tribution and terminal velocity (Aksoy et al., 2012). Therefore,
the layout of nozzles of the rainfall simulator and pumping
Fig. 6. Distribution of rainfall intensity (mm/hr) over the flume
system should be carefully considered to get equal energy and amount of rainfall over the test bed, otherwise, the results are biased to specific area, where received more rainfall comparing to other part of the test bed. However, in this study, the distribution of rainfall is not uniform (Fig. 6). The experiments were conducted in the Ujigawa Open Laboratory, Kyoto University, Japan, where the rainfall generation system was already fixed permanently.
3. Results and Discussions
Beside the climatic factors, the soil factors such as soil water content and matric potential relationship ( θ -h), hydraulic conductivity and water content relationship (K- θ ), saturated hydraulic conductivity (Ks), and porosity (n); are the controlling factors of the soil water movements in the unsaturated zone.
The surface runoff and infiltration phenomena of a particular soil, due to a rainfall event, are directly connected to the physics of the soil water movement of that particular soil.
The water retention function and hydraulic conductivity function proposed by van Genuchten (1980) are respectively as follows.
S
e= ( θ - θ r)/( θ
s- θ
r) = [ 1 + ( |h|)
n]
-mfor h<0
= 1 for h ≥ 0 (1)
K = K
sS
e1/2[1 – (1 – S
e1/m)
m]
2(2)
where S
eis the effective saturation; and η are empirical parameters; θ
sand θ
rare saturated and residual moisture content, respectively ; and m = 1 - 1/η.
The value of n for the sediments Smix1-6 (case-3), Smix4-7 (case-4 and 5) and S7 (case-1 and 2) are 0.276, 0.325 and 0.42; respectively. Similarly, the value of K
sfor these sediments are 0.0278, 0.01075 and 0.00872 cm/sec; respectively. Higher the value of K
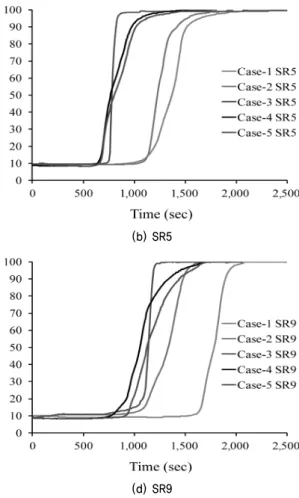
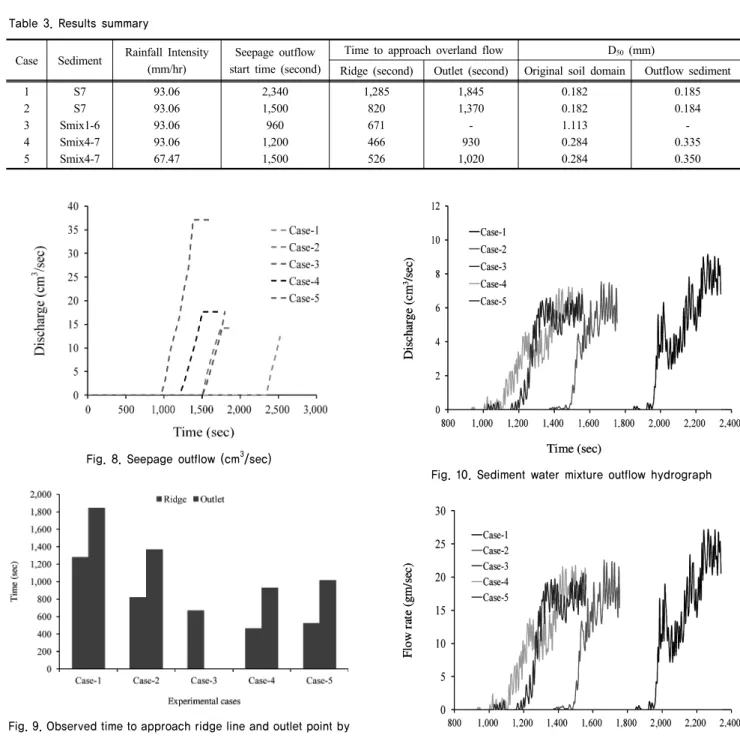
s, faster the soil water movement. Soil water movement was faster in coarser sediment soil domain and high rainfall condition (Table 1, and Figs. 3 and 7). This phenomenon was also directly reflected to the seepage out- flow (Fig. 8). In each sensor (SR) of PRs, moisture increase rate due to the wetting front contributed only by the rainfall intensity above it was comparatively slow before reaching the sharp wetting front through lateral inflow from upstream overland flow (Fig. 7). In case of sensors 1, 5 and 9 for all the experimental cases, sharp wetting front through lateral inflow reached prior to the wetting front through rainfall intensity above it so that sudden raise of moisture from its initial value was observed.
Even though, the seepage water flow in case-3 was faster
than case-4; and case-4 was faster than case-2 (these cases
have same geometry and rain fall intensity), the movement
of fore-front of the overland flow in case-2 was slower than
(a) SR1
(c) SR6
(e) SR10
Fig. 7. Moisture content profiles
(b) SR5
(d) SR9
others, before passing the ridge line (Table 3 and Fig. 9).
Even its movement is slower than case-4, after passing the ridge line. However, the movement of fore-front of the overland flow in case-4 was faster than case-3 (before and after passing the ridge line). Also being the same geometry in case-5, rainfall intensity was smaller than others. But, the movement of fore-front of the overland flow in case-2 was even delayed than case-5. The moisture retention capacity of S7 is higher than Smix1-6 and Smix4-7 (Fig. 4). Smix4-7 has also moisture retention capacity higher than Smix1-6, but
the difference is not so much in comparison to S7. Therefore, the movement of fore-front of the overland flow in case-2 was slower. The timing of seepage out-flow initiations for all the cases were delayed than the initiation of out-flow of the overland flow. In experimental case-3, the overland flow was totally ceased to infiltration before reaching the downstream end (Table 3 and Fig. 9).
The bed of the fore-front of the overland flow was unsatu-
rated in each experiment. Therefore, its movement was observed
intermittent nature in each. After the bed being saturated
(fulfilled the full retention capacity within the soil domain),
in these experimental cases, the movement of overland flow
in case-2 should be faster than other two cases. And, the
movement of overland flow in case-4 should be much faster
than case-3, even it was faster before reaching the full retention
capacity. The effect of the rate of movement of overland flow
was directly reflected to the SRs closer to the soil surface,
SR6 and SR10 (Figs. 7 (c) and 7 (e)). At these sensors, increase
in moisture was earlier in case-4 than case-3; and in case-2
it was comparatively closer to case-3. However, for SR1, SR5
and SR9, which are closer to the flume bottom, increase in
moisture was earlier in case-3 than other cases (Figs. 7 (a),
Table 3. Results summary
Case Sediment Rainfall Intensity (mm/hr)
Seepage outflow start time (second)
Time to approach overland flow D50 (mm)
Ridge (second) Outlet (second) Original soil domain Outflow sediment 1
2 3 4 5
S7 S7 Smix1-6 Smix4-7 Smix4-7
93.06 93.06 93.06 93.06 67.47
2,340 1,500 960 1,200 1,500
1,285 820 671 466 526
1,845 1,370 - 930 1,020
0.182 0.182 1.113 0.284 0.284
0.185 0.184 - 0.335 0.350
Fig. 8. Seepage outflow (cm3/sec)
Fig. 9. Observed time to approach ridge line and outlet point by the overland flow
Fig. 10. Sediment water mixture outflow hydrograph
Fig. 11. Sediment mass flow rate over time
7 (b) and 7 (d)).
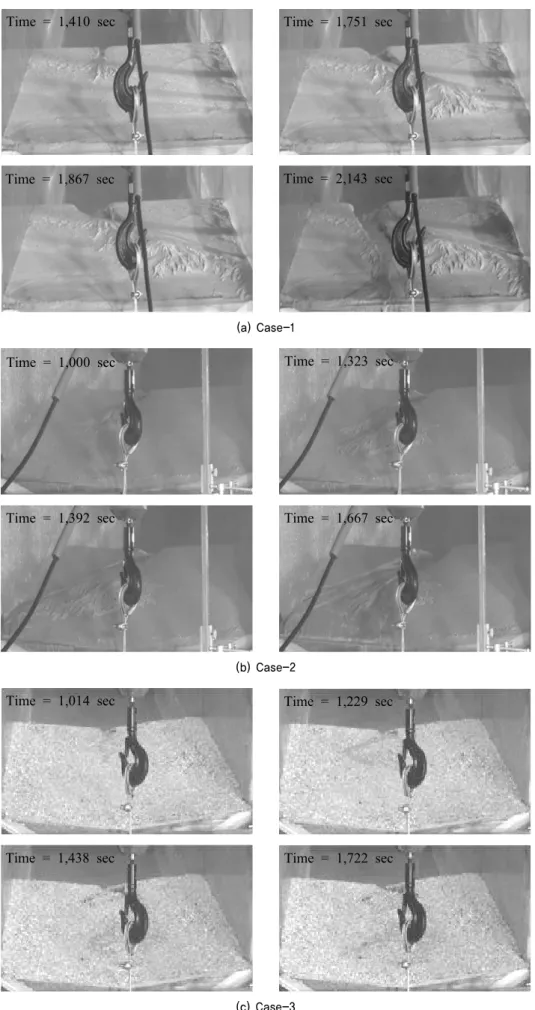
Water-sediment mixture out-flow hydrographs and sediment mass out-flow rates over time are presented in Figs. 10 and 11, respectively. Fig. 12 shows the soil domain sloping face pictures observed at different time during surface erosion/
deposition caused by overland flow. Pictures snapped towards upstream and downstream reach after the rainfall in experiment number 8 was shown in Fig. 13. Fig. 14 presents the pictures of soil domain after each experiment. Runoff contributed from upstream of the sloping face induced minor rills and a major gully was observed in the experiments (Fig. 14). Since the overland flow for case-3 was totally ceased to infiltration
before reaching the downstream end, no out-flow hydrograph
was observed in this experimental case (Fig. 10). So, there
was minor surface erosion and deposition in comparison to
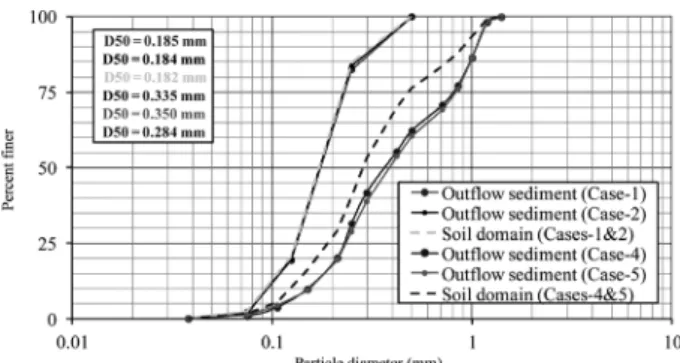
other cases (Figs. 12 (c) and 14 (c)). Fig. 15 compares the
grain size distribution of the out-flow sediment with the
original soil domain. In the experimental case-1 and case-2,
the difference of grain sizes of original soil bed and the out-
flow sediment was insignificant. But in the case of case-4
and case-5, the outflow sediment was observed coarser than
the original soil bed. To see the temporal change in grain
size distribution of the out-flow sediment, in case-4 and
Time = 1,410 sec Time = 1,751 sec
Time = 1,867 sec Time = 2,143 sec
(a) Case-1
Time = 1,000 sec Time = 1,323 sec
Time = 1,392 sec Time = 1,667 sec
(b) Case-2
Time = 1,014 sec Time = 1,229 sec
Time = 1,438 sec Time = 1,722 sec
(c) Case-3
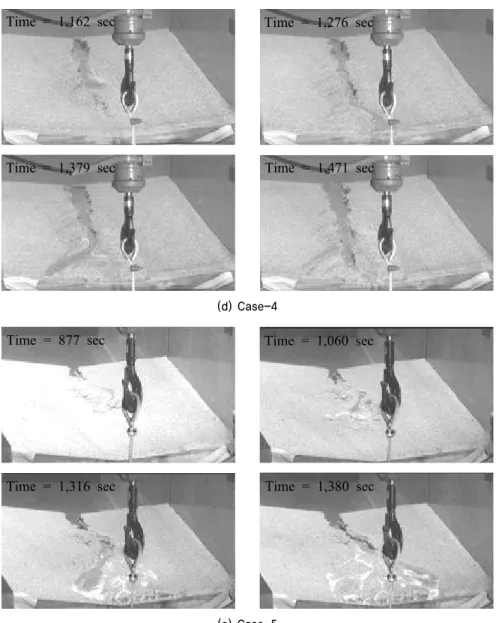
Fig. 12. Pictures showing soil domain sloping face observed at different time during surface erosion/deposition caused by overland flow (contd.)
Time = 1,162 sec Time = 1,276 sec
Time = 1,379 sec Time = 1,471 sec
(d) Case-4
Time = 877 sec Time = 1,060 sec
Time = 1,316 sec Time = 1,380 sec
(e) Case-5
Fig. 12. Pictures showing soil domain sloping face observed at different time during surface erosion/deposition caused by overland flow
(a) Towards upstream reach (b) Towards downstream reach
Fig. 13. Pictures snapped after the rainfall (experiment no. 8)
case-5, one more experiments were performed in each case (Table 1). The comparison of temporal change in grain size distribution of the out-flow sediment and the grain size
distribution of the original soil domain, for the experimental
cases 4 and 5, are presented in Fig. 16 and Fig. 17, respec-
tively.
View from top
View from upstream View from downstream
View from top
View from upstream View from downstream
(a) Case-1 (b) Case-2
View from top
View from upstream
View from downstream
View from top
View from upstream
View from downstream
(c) Case-3 (d) Case-4
View from top View from upstream
View from downstream
(e) Case-5
Fig. 14. Pictures showing soil domains observed after erosion/deposition
There is common view among most of the researchers that sediment leaving an area is finer than that of the soil under surface erosion; and the sediment transport mechanism is the
combination of suspension/saltation and rolling. However, in
this study the out-flow sediment was not finer than that of
the original soil domain, in the cases of non-uniform sediment
Fig. 15. Comparison of grain size distribution of outflow sediment and original soil domain
Fig. 16. Comparison of temporal grain size distribution of outflow sediment and the grain size distributions of original soil domain (Case-4)
Fig. 17. Comparison of temporal grain size distribution of outflow sediment and the grain size distributions of original soil domain (Case-5)
used experiments. For these cases in the intermittent nature of out-flow, the grain size distribution was much coarser, resulting from particle segregation along the travel distance.
Besides the intermittent nature of the out flow, the sediment transport mechanism was the combination of suspension/saltation and rolling.
In experimental case-4 and case-5, the outflow sediment was observed coarser than the original soil bed (Fig. 15). In the intermittent nature of out-flow, before 1,105sec in case-4 and before 1,155sec in case-5 (Fig. 10), the grain size distribution was observed much coarser (Figs. 16 and 17). In the case of
case-1 and case-2 (the sediment of the soil bed was uniform), the difference of grain sizes of original soil bed and the out-flow sediment was insignificant (Fig. 15). Takahashi (1980), in his study for the case of stony type of debris flow, emphasized the particle segregation concept. If the gradient of the bed is steeper (>15º), a bore of sediment-water mix flow is formed due to the sudden supply of water from the upstream. In the flowing layer of such a mixed flow, larger particles move upward. As the upper layer velocity is faster than lower layer, larger particles moved upward are also transported ahead, faster than the progressive velocity of the forefront. On reaching the fore-front these particles tumble down the bed and are buried in the following flow. But, soon after that, the buried particles are larger than the surrounding particles. It appears again on the top of the flow and moves ahead. Repeating such processes, result in particle segregation along the travel distance.
In the present study, the soil bed gradient downstream of ridge (i.e., sloping face) was also steeper (17º). While passing the overland flow from ridge to its downstream, there was sudden flow of water; and the experimental observations were also looked consistent to the particle segregation phenomena as explained by Takahashi (1980). Thus, the outflow sediment was observed coarser than the original soil bed (Case-4 and Case-5). Channel towards the downstream end, the deposited sediments in either banks and inside it were also observed coarser than the original soil bed (Fig. 13 (b)). Channel towards the upstream end (before ridge line), the observed deposited sediments were somehow finer than the original soil bed (Fig. 13 (a)). Larger the sediment particle in comparison to the mean particle size, the faster the upward velocity becomes (Takahashi, 1980). For the cases of uniform sediment particles soil bed (Case-1 and Case-2), the movement of the sediment particles was slow and the deposited sediments in the flow front obstructed the flow, thereby diversion of flow from its main course was observed through the head reach of the sloping face (Fig. 12). In other cases, the flow diversion was comparatively minor.
Depending on the source of eroded sediment, soil erosion
by water is commonly divided into rill and inter-rill components
(Meyer & Wischmeier, 1969; Laflen et al., 1991). Inter-rill
soil erosion results in selective removal of fine particles,
whereas rill erosion is less selective (or nonselective) after
a specific critical flow shear stress is exceeded (Gabriels &
Moldenhauer, 1978; Meyer et al., 1980; Mitchell et al., 1983;
Loch & Donnollan, 1983; Miller & Baharuddin, 1987; Proffitt
& Rose, 1991; Durnford & King, 1993; Sutherland et al., 1996;
Slattery & Burt, 1997; Wan & El-Swaify, 1998; Hairsine et al., 1999; Hogarth et al., 2004; Malam Issa et al., 2006; Asadi et al., 2007a; Asadi et al., 2007b; Romero et al., 2007). The general agreement is that eroded materials are enriched in clay and silt-sized particles relative to the original soil where the erosion event commenced. The eroded materials gradually become coarser over time, and its composition becomes very similar to that of the original soil at final steady state condition (Asadi et al., 2011). But in some cases, the observed transported sediment by inter-rill erosion was coarser than the original soil (Young & Onstad, 1978; Meyer et al., 1992). It has also been noted that in soil erosion due to rainfall there are dynamic changes in both the concentration and size distribution of sediment (Hairsine et al., 1999). Asadi et al. (2007b), found that the mass fraction of different sediment sizes is bimodal distribution resulted from two different transport mechanisms of suspension and saltation, and rolling. However, there are still some conflicting and unexplained results regarding sediment size distribution during erosion processes.
Shi et al. (2012) suggested that total soil loss is the sum of suspended, saltating and contact (rolling) loads. Suspension/
saltation, which affects fine particles, is the main erosion mechanism at work during inter-rill erosion processes. However, after rill development on the hillslope, suspension/saltation becomes less dominant, and bed-load transport by rolling of medium to large-sized sediment particles becomes an increa- singly important transport mechanism. Concentration of rolling size fractions often showed short-term fluctuations due to both the intermittent nature of some sediment inputs and the intermittent nature of the movement involved. The relative importance of these two types of sediment transport mechanisms was related to stream power. While the relative importance of suspension/saltation decreased with increasing stream power, rolling became more important at higher stream powers. Figs.
10, 13, 16 and 17 indicate that the sediment transport mechanism is the combination of particle segregation, suspension/saltation and rolling along the travel distance.
In the experiments for case-1, the soil surface was horizontal in lateral direction, but in other cases it was v-shape (Fig.
2). So that the overland flow was channelized towards v-notch, and also the average depth of soil domain was lesser in the
other cases. Hence, the experimental out-puts for case-1 were comparatively delayed than case-2, even other experimental conditions were same for the both. Similarly, the experimental outputs for case-5 were comparatively delayed than case-4.
In the case-5 experiments the rainfall was less than case-4, but the geometry of soil domain and type of sediment used to prepare it were same in both the cases.
In the case of a real watershed, several soil and land cover related factors affect erosion rates. However, this study does not take into account these factors. Therefore, the soil erosion and transport characteristic of the real watershed may different from this type of laboratory scale experimental results. Further studies based on numerical analyses and additional experiments compatible to actual watershed characteristics are necessary.
4. Conclusions
This study involved laboratory flume experiments carried out under simulated rainfall in a 3.0 m long × 0.8 m wide × 0.7 m deep flume, set at 17º slope. Five experimental cases, consisting of twelve experiments using three different sediments with two different rainfall conditions, are reported. Moisture profiles, seepage out-flow, and movement of overland flow was clearly found to be controlled by water retention function and hydraulic function of the sediment used in the experiments.
Runoff contributed from upstream of the sloping face induced minor rills and a major gully was observed in the experiments.
The results indicated that the sediment transport mechanism is the combination of particle segregation, suspension/saltation and rolling along the travel distance. The difference of grain size distribution of original soil bed and the out-flow sediment was found to be insignificant in the cases of uniform sediment used experiments. However, in the cases of non-uniform sediment used experiments the out-flow sediment was found to be coarser than the original soil domain. In the intermittent nature of out-flow, the grain size distribution was much coarser caused by particle segregation due to the sudden supply of water from the upstream.
For the uniform sediment particles soil bed, the movement
of the sediment particles was slow and the deposited sediments
in the flow front obstructed the flow, thereby diversion of
flow from its main course was observed through the head
reach of the sloping face. In contrast, for the non-uniform
sediment particles soil bed, the movement of the sediment particles was faster and the flow diversion was comparatively minor.
The soil erosion and transport characteristic of the real watershed may different from this type of laboratory scale experimental results. Further studies based on numerical analyses and more experiments (varying soil bed slope, soil types and rainfall conditions) compatible to actual watershed characteristics as well are necessary to verify this conclusion further more.
Acknowledgement
This research was supported by a grant (11-TI-C06) from the Advanced Water Management Research Program funded by the Ministry of Land, Infrastructure and Transport of the Korean government.
References
1. Aksoy, H., Unal, N. E., Cokgor, S., Gedikli, A., Yoon, J., Koca, K., Inci S. B. and Eris, E. (2012), A rainfall simulator for laboratory-scale assessment of rainfall-runoff-sediment transport processes over a two-dimensional flume, Catena, Vol. 98, Nov., pp. 63~72.
2. Ali, M., Sterk, G., Seeger, M., Boersema, M. and Peters, P.
(2012), Effect of hydraulic parameters on sediment transport in overland flow over erodible beds, Hydrology and Earth System Sciences, Vol. 16, pp. 591~601.
3. Asadi, H., Ghadiri, H., Rose, C. W. and Rouhipour, H. (2007a), Interrill soil erosion processes and their interaction on low slopes, Earth Surface Processes and Landforms, Vol. 32, No.
5, pp. 711~724.
4. Asadi, H., Ghadiri, H., Rose, C. W., Yu, B. and Hussein, J.
(2007b), An investigation of flow-driven soil erosion processes at low stream powers, Journal of Hydrology, Vol. 342, No. 1, pp. 134~142.
5. Asadi, H., Moussavi, A., Ghadiri, H. and Rose, C. W. (2011), Flow-driven soil erosion processes and the size selectivity of sediment, Journal of Hydrology, Vol. 406, No. 1, pp. 73~81.
6. Bennett, J. P. (1974), Concepts of mathematical modelling of sediment yield, Water Resources Research, Vol. 10, No. 3, pp.
485~492.
7. Berger, C., Schulze, M., Rieke-Zapp, D. and Schlunegger, F.
(2010), Rill development and soil erosion: a laboratory study of slope and rainfall intensity, Earth Surface Processes and Landforms, Vol. 35, No. 12, pp. 1456~1467.
8. Durnford, D. and King, P. (1993), Experimental study of processes and particle size distributions of eroded soil, Journal of Irrigation and Drainage Engineering, Vol. 119, No. 2, pp. 383~398.
9. Gabriels, D. and Moldenhauer, W. C. (1978), Size distribution
of eroded material from simulated rainfall: Effect over a range of texture, Soil Science Society of America Journal, Vol. 42, No. 6, pp. 954~958.
10. Govers, G. (1990), Empirical relationships for the transport capacity of overland flow, In: Erosion, Transport and Deposition Processes (Proceedings of the Jerusalem Workshop, March-April 1987) IAHS Publication No. 189, pp. 45~63.
11. Govers, G. (1991), A field study on topographical and topsoil effects on runoff generation, Catena, Vol. 18, No. 1, pp. 91~111.
12. Haan, C. T., Barfield, B. J. and Hayes, J. C. (1994), Design hydrology and sedimentology for small catchments, Academic Press, San Diego, pp. 204~310.
13. Hairsine, P. B., Moran, C. J. and Rose, C. W. (1992), Recent developments regarding the influence of soil surface charac- teristics on overland flow and erosion, Australian Journal of Soil Research, Vol. 30, No. 3, pp. 249~264.
14. Hairsine, P. B., Sander, G. C., Rose, C. W., Parlange, J. Y., Hogarth, W. L., Lisle, I. and Rouhipour, H. (1999), Unsteady soil erosion due to rainfall impact: A model of sediment sorting on the hillslope, Journal of Hydrology, Vol. 220, No. 3, pp.
115~128.
15. Hansen, B., Schønning, P. and Sibbesen, E. (1999), Roughness indices for estimation of depression storage capacity of tilled soil surfaces, Soil and Tillage Research, Vol. 52, No. 1, pp.
103~111.
16. Hogarth, W. L., Rose, C. W., Parlange, J. Y., Sander, G. C.
and Carey, G. (2004), Soil erosion due to rainfall impact with no inflow: a numerical solution with spatial and temporal effects of sediment settling velocity characteristics, Journal of Hydrology, Vol. 294, No. 4, pp. 229~240.
17. Huang, C. H. and Bradford, J. M. (1990), Depressional storage for Markov-Gaussian surfaces, Water Resourses Research, Vol.
26, No. 9, pp. 2235~2242.
18. Kamphorst, E. C., Jetenet, L., Guérif, J., Pitkänen, J., Iversen, B. V., Douglas, J. T. and Paz, A. (2000), Predicting depressional storage from soil surface roughness, Soil Science Society of America Journal, Vol. 64, No. 5, pp. 1749~1758.
19. Kilinc, M. and Richardson, E. V. (1973), Mechanics of soil erosion from overland flow generated by simulated rainfall, Hydrology Papers No. 63, Colorado State University, Fort Collins, Colorado, pp. 1~54.
20. Laflen, J. M., Lane, L. J. and Foster, G. R. (1991), WEPP: a new generation of erosion prediction technology, Journal of Soil Water Conservation, Vol. 46, No. 1, pp. 34~38.
21. Loch, R. J. and Donnollan, T. E. (1983), Field rainfall simulator studies on two clay soils of the Darling downs, Queensland. II.
aggregate breakdown, sediment properties and soil erodibility, Australian Journal of Soil Research, Vol. 21, No. 1, pp. 47~58.
22. Malam Issa, O., Bissonnais, Y. L., Planchon, O., Favis-Mortlock, D., Silvera, N. and Wainwright, J. (2006), Soil detachment and transport on field- and laboratory-scale interrill areas: erosion processes and the size-selectivity of eroded sediment, Earth Surface Processes and Landforms, Vol. 31, No. 8, pp. 929~939.
23. Meyer, L. D., Harmon, W. C. and McDowell, L. L. (1980), Sediment size eroded from crop row side slopes, Transactions of the American Society of Agricultural Engineers, Vol. 23, No. 4, pp. 891~898.
24. Meyer, L. D., Line, D. E. and Harmon, W. C. (1992), Size characteristics of sediment from agricultural soils, Journal of
Soil and Water Conservation, Vol. 47, No. 1, pp. 107~111.
25. Meyer, L. D. and Wischmeier, W. H. (1969), Mathematical simulation of the process of soil erosion by water, Transactions of the American Society of Agricultural Engineers, Vol. 12, No. 6, pp. 754~758.
26. Meyer, L. D., Zuhdi, B. A., Coleman, N. L. and Prasad S. N.
(1983), Transport of sand-sized sediment along crop-row furrows, Transactions of the American Society of Agricultural Engineers, Vol. 26, No. 1, pp. 106~111.
27. Miller, W. P. and Baharuddin, M. K. (1987), Particle size of inter-rill-eroded sediments from highly weathered soils, Soil Science Society of America Journal, Vol. 51, No. 6, pp. 1610~1615.
28. Mitchell, J. K., Mostaghimi, S. and Pound, M. C. (1983), Primary particle and aggregate size distribution of eroded soil from sequenced rainfall events, Transactions of the American Society of Agricultural and Biological Engineers, Vol. 26, No. 6, pp.
1771~1777.
29. Morgan, R. P. C. (2005), Soil erosion and conservation, Third Edition, National Soil Resources Institute, Cranfield University, Blackwell Publishing, UK, pp. 45~66.
30. Nearing, M. A., Lane, L. J. and Lopes, V. L. (1994), Modelling soil erosion, In: Lad, R. (Ed.), Soil Erosion Research Methods, pp. 127~156.
31. Nearing, M. A., Norton, L. D., Bulgakov, D. A., Larionov, G.
A., West, L. T. and Dontsova, K. M. (1997), Hydraulics and erosion in eroding rills, Water Resources Research, Vol. 33, No. 4, pp. 865~876.
32. Onstad, C. A. (1984), Depressional storage on tilled soil surfaces, Transactions of the American Society of Agricultural Engineers, Vol. 27, No. 3, pp. 729~732.
33. Planchon, O., Esteves, M., Silvera, N. and Lapetite, J. M. (2001), Microrelief induced by tillage: Measurement and modeling of surface storage capacity, Catena, Vol. 46, No. 2, pp. 141~157.
34. Poessen, J. and Ingelmo-Sanchez, F. (1992), Runoff and sediment yield from top soils with different porosity as affected by rock fragment cover and position, Catena, Vol. 19, No. 5, pp. 451~474.
35. Proffitt, A. P. B. and Rose, C. W. (1991), Soil erosion processes:
II. Settling velocity characteristics of eroded sediment, Australian Journal of Soil Research, Vol. 29, No. 5, pp. 685~695.
36. Romero, C. C., Stroosnijder, L. and Baigorria, G. A. (2007), Interrill and rill erodibility in the northern Andean highlands, Catena, Vol. 70, No. 2, pp. 105~113.
37. Rose, C. W. (1993), Erosion and sedimentation. In: hydrology and water management in the humid tropics - Hydrologic Research Issues and Strategies for Water Management, M. Bonell, M. M.
Hufchmidt and J. S. Gladwell (Eds), Cambridge University Press, Cambridge, UK, pp. 301~343.
38. Shi, Z. H., Fang, N. F., Wu, F. Z., Wang, L., Yue, B. J. and W. U., G. L. (2012), Soil erosion process and sediment sorting associated with transport mechanisms on steep slope, Journal of Hydrology, Vol. 454~456, pp. 123~130.
39. Slattery, M. C. and Burt, T. P. (1997), Particle size characteristics of suspended sediment in hillslope runoff and stream flow, Earth Surface Processes and Landforms, Vol. 22, No. 8, pp.
705~719.
40. Sutherland, R. A., Wan, Y., Ziegler, A. D., Lee, C. T. and El-Swaify, S. A. (1996), Splash and wash dynamics: An experi- mental investigation using an Oxisol, Geoderma, Vol. 69, No.
1, pp. 85~103.
41. Takahashi T. (1980), Debris flow on prismatic open channel, Journal of Hydraulics Division, American Society of Civil Engineers, Vol. 106, No. 3, pp. 381~396.
42. van Genuchten, M. T. (1980), A closed-form equation for predicting the hydraulic conductivity of unsaturated soils, Soil Science Society of America Journal, Vol. 44, No. 5, pp. 892~898.
43. Wan, Y. and El-Swaify, S. A. (1998), Characterizing interrill sediment size by partitioning splash and wash processes, Soil Science Society of America Journal, Vol. 62, No. 2, pp. 430~437.
44. Wicks, J. M. and Bathurst, J. C. (1996), SHESED: a physically based, distributed erosion and sediment yield component for the SHE hydrological modeling system, Journal of Hydrology, Vol.
175, No. 1, pp. 213~238.
45. Wischmeier, W. H. and Smith, D. D. (1978), Predicting rainfall erosion losses: A guide to conservation planning, Agriculture Handbook No. 537, USDA-SEA, Washington, DC, pp. 1~58.
46. Young R. A. and Onstad C. A. (1978), Characterisation of rill and interrill eroded soil, Transactions of the American Society of Agricultural Engineers, Vol. 21, No. 6, pp. 1126~1130.