* Professor, Vision University of Jeonju ([email protected])
** Researcher, K-water Research Institute, K-water ([email protected])
The Analysis of Reduction Efficiency of Soil Erosion and Sediment Yield by a Ginseng Area using GIS Tools
Geun Sang LEE* ・ Dae Youn JEON**
ABSTRACT
Recently, turbidity problem is one of the hot issues in dam and reservoir management works. Main reason to bring about high density turbid water is sediment yield by rainfall intensity energy. Because existing researches didn't consider diverse types of crops, it was difficult to calculate more accurate soil erosion and sediment yield. This study was evaluated the reduction efficiency of soil erosion and sediment yield using ginseng layer extracted from IKONOS satellite image, and the area and the ratio of ginseng area represented 0.290km2 and 0.94%. The reduction efficiency of soil erosion considering ginseng area represented low value in 0.9% using GIS-based RUSLE model, because the area of ginseng was small compared to areas of other agricultural lands. To reflect future land use change, this study was calculated the reduction efficiency of soil erosion and sediment yield by considering many scenarios as kinds of crops of paddy, dry field, orchard, and other agricultural areas convert to the ginseng district.
As result of analysis of them according to scenarios, scenario (1) in which dry field was converted to ginseng area and scenario (2) in which fully agricultural lands were converted to ginseng area showed high reduction efficiency as 31.3% and 34.8% respectively, compared to existing research which didn't consider ginseng area. Methodology suggested in this study will be very efficient tools to help reservoir management related to high density turbid water.
Keywords : Ginseng, Soil Erosion, Sediment Yield, Scenario, GIS
요 약
최근 탁수문제는 댐과 저수지관리 업무에서 중요한 이슈중의 하나가 되고 있으며, 고탁수를 유발하는 주요
원인은 강우강도 에너지에 의한 유사량이다. 기존의 연구들은 다양한 작물형태를 고려하지 않아 정확한 토양 침식 및 유사량을 계산할 수 없었다. 본 연구에서는 IKONOS 위성영상으로부터 추출한 인삼밭 레이어를 이용
하여 토양침식량과 유사량의 저감효과를 분석하였으며, 인삼밭의 면적과 점유비율은 각각 0.290km2와 0.94%
로 나타났다. GIS 기반 RUSLE 모델을 이용하여 인삼밭을 고려한 토양침식량의 저감효과를 분석한 결과는 0.9%로 낮게 나타났으며, 이는 인삼밭의 면적이 다른 농경지에 비해 상대적으로 작기 때문으로 해석된다. 미
래의 토지이용변화를 반영하기 위해, 본 연구에서는 논, 밭, 과수원 그리고 기타 재배지들이 인삼밭 지역으로
전환된다는 시나리오를 고려하여 토양침식과 유사량의 저감효과를 평가하였다. 시나리오에 따른 인삼밭의 저
감효과를 분석한 결과, 밭지역을 인삼밭으로 전환한 시나리오 (1)과 모든 농경지를 인삼밭으로 전환한 (4)가 인삼밭을 고려하지 않은 기존의 연구와 비교할 때 31.3% 및 34.8% 더 높은 저감효과를 나타내었다. 본 연구에
서 제시한 방법론은 고탁수와 관련된 저수지관리를 지원하기 위한 매우 효과적인 도구가 될 수 있을 것이다.
주요어 : 인삼, 토양침식, 유사량, 시나리오, GIS
1. Introduction
Extremely heavy rainfall events have increased over the last decades and it is also supported by some observations in Korea. Then soil erosion may be exacerbated in the near future because of anthropogenic climate change (Houghton et al., 2001).
Soil erosion is a natural process affected by natural and anthropogenic factors (Wischmeier and Smith, 1978), and it transports absorbed chemicals to downstream lakes or reservoirs. Top soil removal reduces the productivity of land (on-farm impact) and the suspended sediment and sediment-bound nutrients increase the growth and proliferation of aquatic organisms like algae (off-farm impact) (Pionke and Blanchard, 1975).
In Korea, soil erosion is unexceptionally a serious problem that is mainly caused by agricultural intensification, rainstorm, and/or their combination. Water quality degradation due to soil erosion has been a threat to turbid-water and ecosystem integrity but the infrastructure for soil conservation and management is poorly devel- oped in Korea. Accordingly effective soil conservation planning and management are in urgent need and controlling soil erosion by water is an important issue (G.
S. Lee, 2006).
Agricultural area shows most sensitive response among factors which have an effect on the estimation of soil erosion. Especially, these sorts of crops play an important role in the change of soil erosion. Foreign researches about soil erosion including these kinds of land covers and crops are very various(Anton et al., 2001;
Angima et al. 2003).
As representative cases, Donald et al. (2003) evaluated C factors for 40 crop rotation systems on arable farms in the Kemmelbeek watershed, Belgium. The calculation
of the C factor was based on Universal Soil Loss Equation (USLE) growth stages, according to the Agricultural Handbook 537 (Wischmeier and Smith, 1978). The duration of those stages needs to be known for each crop, These data can be derived from Wischmeier and Smith's study, which gives the planting and harvesting time and the development of plant cover(%) as a function of number of days following planting (DFP) or sowing. Also, Lufafa et al. (2003) predicted soil erosion in a Lake Victoria basin catchment using a GIS-based Universal Soil Loss model. Especial- ly, they applied diverse C-factors according to the crops and cultivating method. Wayne et al.(2002) applied Revised Universal Soil Loss Equation (RUSLE) model to estimate land use effect on sediment yields and soil loss rates in small basin of Triassic sandstone near Sydney, NSW, Australia.
Foreign researches considering kinds of crop were kinds of study for supporting the land use policy and applied to small basin comparatively.
But, most of soil erosion studies were applied to vast basin scale. Therefore, most of papers presumed agricultural land into the one type of crop, because much time and money are required to construct the database of crops which were located in basin.
It caused that calculated soil erosion amounts showed excessive estimation in comparison with observation data and also made problem in selection detailed area for the construction of countermeasures against soil erosion. Recently, districts cultivating specialized crops show a steady growth in rural community. Cultivation methods of specialized crops play an important role in sediment yield when it rains a lot. Therefore more accurate analysis of soil erosion and sediment yield is possible if database system about specialized crops is constructed and cover management factor (C) according
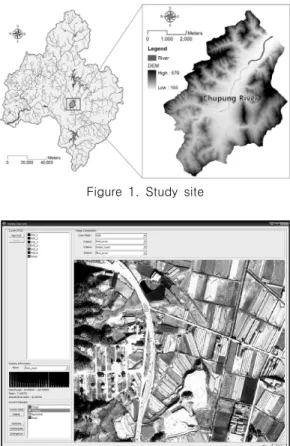
Figure 1. Study site
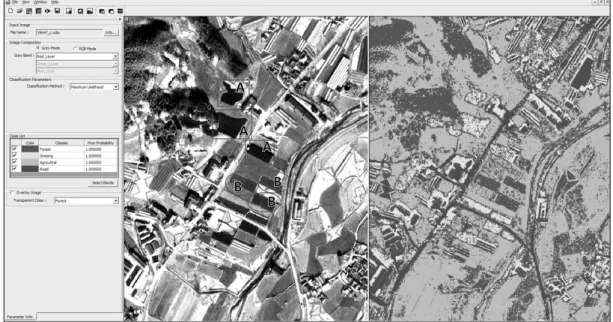
Figure 2. Selection of ROI to kinds of crops is determined. Especially, ginseng area
is critical case. Rainfall energy is decreased with the curtain of ginseng in ginseng area. So approach considering ginseng area is very important to advance the accuracy of soil erosion.
This study chose Chupung river basin of Geum river which is famous for ginseng and constructed ginseng layer based on IKONOS satellite image. And the influence of soil erosion and sediment yield was estimated by the cultivation of ginseng. Especially, this study established scenarios and analyzed the reduction efficiency of soil erosion and sediment yield considering the conversion existing paddy, dry field, orchard, and other agricultural areas into ginseng districts for the preparation of expansion of rural specialized crops.
2. Study site and GIS DB
Chupung river basin of Geum river was selected in this study, showed the area in 31km2 (Figure 1). To determine the characteristics of soil erosion within the basin, the cause of turbid-wateroccurrence, it basically calls for the information on the DEM, soil, land cover, and other GIS database. First, to determine the geomorphological characteristics, the study develops a Triangle Irregular Network (TIN) using a 1:5,000-scale digital topographic map crafted by the National Geography Institute. Using the TIN, a 10m-resolution DEM is crafted. The DEM distribution of Chupung-river basin covers from 165m to 579m (Figure 1).
The land cover plays a decisive role in causing soil erosion and then turbid-water occurrence according to the intensity of rainfall. Therefore, it is crucial to secure an accurate landcover map; to overcome the limit of the existing 30m-resolution LANDSAT satellite images, this study used a basic land cover map with 10m-resolution SPOT 5 images of Ministry of Environment.
Land cover maps of Ministry of Environment don't have class data about kinds of crops in agricultural area.
Therefore, it requires separate processing procedures
using satellite image to extract the ginseng area among agricultural areas in Chupung river basin.
This paper selected Region Of Interest (ROI) such as Figure 2. and classified image as Figure 3. with Maximum Likelihood Method (MLM) to extract land cover classes including ginseng area using IKONOS satellite image.
Supervised classification clusters pixels into the classes that user define, resulting in a GIS image layer.
User can define classes and training data based on study, maps, and empirical knowledge. In order to do the supervised classification, users need to create ROIs (Region Of Interests). All classes of interest must be carefully selected and defined to successfully classify remotely sensed data into land cover information (Gong and Howarth, 1992). The user-defined classes become a training dataset. Each pixel is compared with the classes
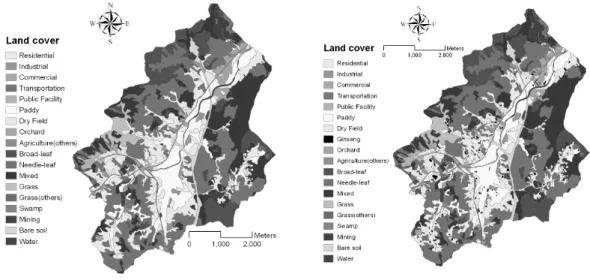
Figure 3. Image classification with Maximum Likelihood Method
Figure 4. Extraction of ginseng area using IKONOS satellite images
in the training data and a class is assigned to the pixel.
Maximum Likelihood Method (MLM) is a kind of algo- rithm to each pixel with classes. This method calculates a probability that a given pixel belongs to a certain class. It clusters pixels of data based on statistical results. A Priori Probability for each class can be defined in advance. This method gives better results that other algorithms and has a covariance matrix to calculate the spatial distribution of each class. It requires an extensive amount of computation time and it is applicable only for data sets having a normal distribution (Jensen, 1996; Sabins, 1997).
In classified results of land cover as Figure 3,「A」
districts of square box were representative cases which were extracted to ginseng area, and「B」districts of oval shape showed ginseng area classified to forest.
This paper used IKONOS satellite image, which is taken in November 3, 2007. Therefore, most of forests showed diverse colors except for pine tree and the result of classification were not good result. Especially, The shade area by forest and building caused misclassification of ginseng area. Therefore, screen digitizing method are used to construct accurate ginseng
area as Figure 4 in this research. Figure 5 represents land cover map by the land cover information of Ministry of Environment and IKONOS satellite image.
And land cover characteristics considering ginseng districts are as Table 1.
The area and ratio of ginseng area among total land covers showed 0.290km2 and 0.94% respectively. And the ratio of ginseng area among agricultural area represented about 3.15% (=0.290/9.209×100%). The alloted areas to the ginseng district among paddy, dry field, orchard, and
(a) Before applying ginseng area (b) After applying ginseng area Figure 5. Land cover map
Table 1. Analysis of land cover in chupung river basin.
Land cover Before applying ginseng area After applying ginseng area
Area(km2) (%) Area(km2) (%)
Residential Area 0.903 2.91 0.903 2.91
Industrial Area 0.493 1.59 0.493 1.59
Commercial Area 0.125 0.40 0.125 0.40
Recreation Facility 0.000 0.00 0.000 0.00
Transportation Area 0.299 0.97 0.299 0.97
Public Facility 0.203 0.65 0.203 0.65
Paddy 3.678 11.86 3.633 11.72
Dry Field 4.816 15.53 4.600 14.84
Plastic Greenhouse 0.000 0.00 0.000 0.00
Orchard 0.678 2.19 0.650 2.10
Agricultural (others) 0.037 0.12 0.036 0.12
Ginseng 0.000 0.00 0.290 0.94
Broad-leaf 3.293 10.62 3.293 10.62
Needle-leaf 8.651 27.90 8.651 27.90
Mixed 5.752 18.55 5.752 18.55
Grass 0.606 1.96 0.606 1.96
Golf 0.000 0.00 0.000 0.00
Grass (others) 0.140 0.45 0.140 0.45
Swamp 0.055 0.18 0.055 0.18
Mining 0.294 0.95 0.294 0.95
Bare soil 0.578 1.86 0.578 1.86
Water 0.406 1.31 0.406 1.31
31.007km2 (100%)
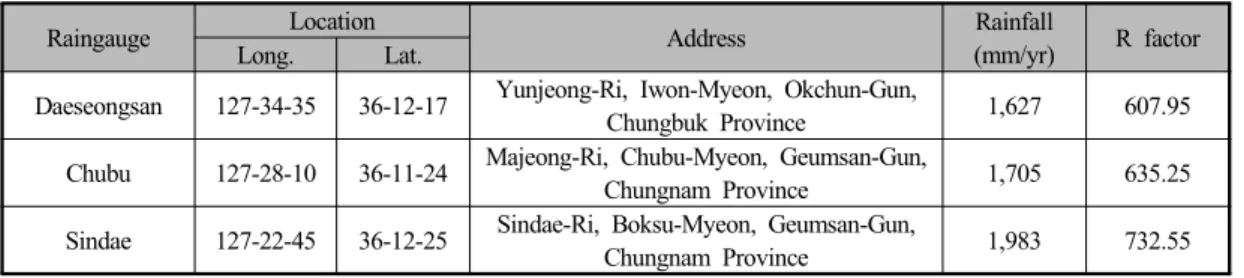
Table 2. Rainfall and R factor according to the raingauge.
Raingauge Location
Address Rainfall
(mm/yr) R factor
Long. Lat.
Daeseongsan 127-34-35 36-12-17 Yunjeong-Ri, Iwon-Myeon, Okchun-Gun,
Chungbuk Province 1,627 607.95
Chubu 127-28-10 36-11-24 Majeong-Ri, Chubu-Myeon, Geumsan-Gun,
Chungnam Province 1,705 635.25
Sindae 127-22-45 36-12-25 Sindae-Ri, Boksu-Myeon, Geumsan-Gun,
Chungnam Province 1,983 732.55
other agricultural areas are 0.045km2, 0.216km2, 0.028 km2, 0.001km2 respectively. Also, the alloted ratio into the ginseng area are 1.22% (=(3.678-3.633)/3.678×100%), 4.49% (=(4.816-4.600)/4.816×100%), 4.13% (=(0.678-0.650)/
0.678×100%), 2.70% (=(0.037-0.036)/0.037×100%). It means dry field converted into the ginseng areas in high value.
3. M odeling of soil erosion and sediment yield
This study selects a RUSLE model that involves GIS data and that is usually used in basins. RUSLE is the advanced experimental equation of USLE model in existing agriculture area. RUSLE was developed by Renard et al. (1991) in order to apply to watershed, and much research is performed based on this experimental data. The RUSLE model is shown as below (Renard et al., 1991).
P C S L K R
A= × × × × × (1)
where, A is annual soil loss(ton/ha/yr), R is rainfall erosivity factor(․ ), K is soil erodibility factor(ton/ha/R), L is slope length factor, S is slope steepness factor, C is cover management factor and P is support practice factor. Rainfall erosivity factor is the loss intensity of annual rainfall and is acquired from time-distribution and characteristics of rainfall. This study uses Eq. (2) that is made by A. G. Toxopeus and the equation can easily calculate rainfall erosivity factor
from annual rainfall.
Pr 35 . 0 5 .
38 + ×
=
R (2)
In which Pr denotes Annual rainfall in mm/yr.
Rainfall conditions are a crucial factor for evaluating soil erosion, and the design rainfall varies according to dam basins. This study applied rainfall data (2008 yr) of raingauges as Daeseongsan, Chubu, and Sindae into Eq. (2) and calculated rainfall erosivity factor (R).
The soil erodibility factor is the rate of soil loss per rainfall loss index unit. The K-factor varies according to soil texture, organic matter content permeability, and other factors and it is often transformed from the soil texture data (Wischmeier, 1971), which is related to the grain size distribution and was derived from theErickson’s triangle diagram (Erickson, 1997) for the study.
Topographic factors are divided into slope length factor(L) and slope steepness factor(S). Slope length factor is the ratio of the horizontal slope length to the unit-plot slope length (22.13m) raised to a slope-dependent exponent (Bartsch, 1998). This study uses the slope length factor as the determined algorithms by Renard et al.(1991). Eq.(3), from Renard et al.(1991), uses the number of grid cells flowing into the observation cell and the cell length as a multiplier to determine the total slope length of the segment. The cell-based method accounts for the divergence and convertgence of flows and attempts to take into account the complexity of natural landscapes.
) 56 . 0 sin 96 . 2 (
) 0896 . 0 / (sin
79 .
0 +
= ×
θ
β θ , (1 β)
β
= +
m (3)
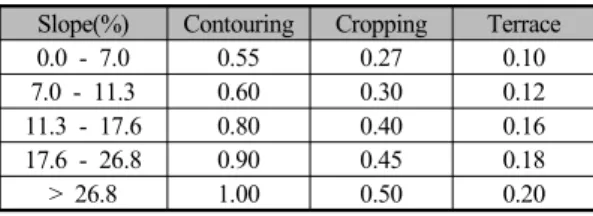
Table 3. Support practice factor considering support type and slope.
Slope(%) Contouring Cropping Terrace
0.0 - 7.0 0.55 0.27 0.10
7.0 - 11.3 0.60 0.30 0.12
11.3 - 17.6 0.80 0.40 0.16
17.6 - 26.8 0.90 0.45 0.18
> 26.8 1.00 0.50 0.20
In which m denotes the slope length exponent and denotes the angle of slope.
m m m
m i
i i L x
13 . 22
) ) 1 ( ( +1− − +1
= (4)
In which is the slope length factor for the cell at i'th segment and denotes the length of the grid cell in m.
The slope steepness factor reflects the influence of slope gradient on soil loss and is calculated using the algorithm by Nearing (1997).
) sin 1 . 6 3 . 2 exp(
1 5 17 .
1 + + − θ
−
=
S (5)
In which is the same in equation (4).
The cover management factor reflects the effect of both cropping and management practices on soil loss rates(Renard et al., 1991). The value of cover management factor shows 1.0 in barren land that offers nearly no vegetation, and 0.1 in forest area.
Wischmeier and Smith defined the support practice factor as the ratio of soil loss with a specific support practice to the corresponding soil loss with up and down cultivation. There are contouring, strip cropping and terracing in cultivation type, and the support practice factor affects soil loss directly by reducing the amount and rate of runoff. Land cover and topographic maps are used to calculate the support practice factor.
We regard paddies as terracing, and dry fields as strip
cropping. Table 3 shows the support practice factor according to the type of cultivation and topographic slope.
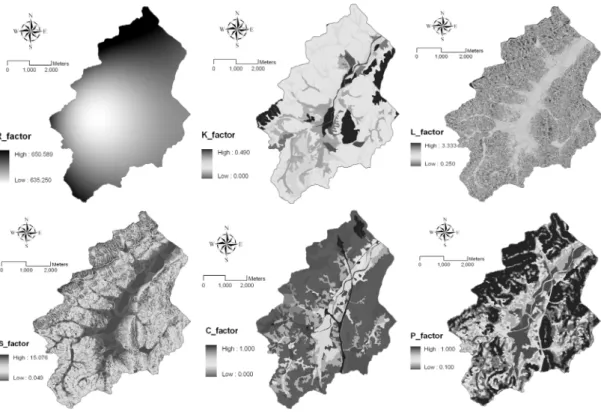
Figure 6 shows RUSLE factors map and Table 4 is the statistics of RUSLE factors. Cover management factor applying ginseng area shows more low value in 0.128 than existing cover management factor in 0.136.
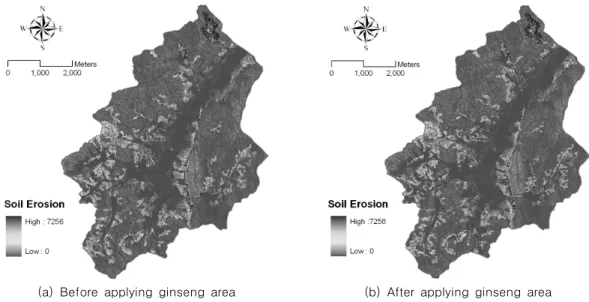
Figure 7 shows soil erosion map and Table 4 is the statistics of RUSLE factors.
RUSLE-simulated soil erosion amounts are sheet erosion; thus a modeling of soil particles that are yielded to rivers and reservoirs should consider SDR (Sediment Delivery Ratio). SDR is a function chiefly of (1) sediment source, (2) the distance between the river transport system and the sediment source, (3) the density and condition of the river transport system, (4) the size and texture of sediment and (5) the characteristics of the basin. SDR varies according to sediment source, and if actual measured values of SDR are unavailable, regional regression equations will be determined using statistical analysis methods.
An empirical equation derived and calibrated from field experimental data by Boyce (1975) was used as follows (Frentle and Julien, 1987);
0.41 0.3
SDR= A− (6)
Where SDR is the sediment delivery ratio in % and A is the basin area in km2. The SDR is involved in numerous uncertainties including temporal discontinuity and spatial variability.
SDR was calculated as 0.146 by applying the area (=31km2) of Chupung river basin to Boyce's equation.
Table 5 represents cover management factor (C), soil erosion, and sediment yield considering the influence of ginseng district. In case of applying ginseng area, soil erosion and sediment yield show about 99.1%, compared to the existing study as not applying the influence of ginseng district. The reduction efficiency of soil erosion by ginseng area shows low value in 0.9%, because the area of ginseng is small compared to areas of other agricultural lands.
Figure 6. RUSLE factors map
Table 4. Statistics of RUSLE factors.
Items Statistics
Min Max Mean StD.
Factors
Rainfall erosivity factor (R) 635.250 650.589 640.378 3.226
Soil erodibility factor (K) 0.000 0.490 0.277 0.076
Slope length factor (L) 0.250 3.333 1.371 0.830
Sloe steepness factor (S) 0.049 15.076 5.566 4.241
Cover management factor (C)
Before applying ginseng area 0.000 1.000 0.136 0.215 After applying ginseng area 0.000 1.000 0.128 0.214
Support practice factor (P) 0.000 1.000 0.688 0.322
4. Analysis of soil erosion and sediment yield according to the scenarios
In basin causing severe turbid water, ginseng district which can intercept rainfall intensity before rainfall arrives in surface is more efficient than structure as
debris barrier which can reduce soil particle in river channel. Also practical use of ginseng area is expected in basin rising turbid water, because ginseng district is a kind of specialized crops which can guarantee high profitability.
Cultivation areas and production amounts of ginseng are as Figure 8. according to the announcement of Ministry for Food Agriculture Forestry and Fisheries
(a) Before applying ginseng area (b) After applying ginseng area Figure 7. Soil Erosion map
Table 5. C factor, soil erosion, and sediment yield.
Item Cover Management Factor Soil Erosion Total Soil Erosion Sediment Yield
Min Max Mean StD. Min Max Mean StD. ton(%) ton(%)
Before applying
ginseng area 0.000 1.000 0.136 0.215 0.000 7256.000 55.081 267.392 169,419(100%) 24,735(100%) After applying
ginseng area 0.000 1.000 0.128 0.214 0.000 7256.000 54.391 268.325 167,983(99.1%) 24,526(99.1%)
(a) (b)
Figure 8. Area of ginseng (a) and The amount of production of ginseng (b)
(2008).
Even though the annual cultivation area of ginseng shows irregularly, the graph of that showed increasing trend on the whole. This increasing trend of ginseng is
closely connected with the amounts of production of ginseng as Figure 8(b) in rural district.
This study analyzed the reduction efficiency of soil erosion and sediment yield in many scenarios as kinds
Figure 9. Land cover map according to the scenario of crops of paddy, dry field, orchard, and other
agricultural areas convert to the ginseng district. Diverse scenarios area as follows;
Scenario (1) means that dry field is converted to ginseng area, and scenario (2) is case in conversion paddy to ginseng district. Also scenario (3) means dry field, orchard, and other agricultural area are converted to ginseng area, and scenario (4) is case in fully agricultural lands are converted to ginseng district.
Figure 9 and 10 shows the maps of land cover and
soil erosion and table 6 represents results of cover management factor, soil erosion, and sediment yield in according to scenarios.
As result of analysis of soil erosion and sediment yield according to scenarios, scenario (4) considering fully agricultural lands were converted to ginseng district showed the reduction efficiency as 34.8% in comparison with existing research which didn't consider ginseng area.
The scenario (1) also showed high reduction
Figure 10. Soil erosion map according to the scenario Table 6. C factor, soil erosion, and sediment yield accordint to the scenario.
Items Cover Management Factor Soil Erosion Total Soil Erosion Sediment Yield
Min Max Mean StD. Min Max Mean StD. ton(%) ton(%)
Scenario
1 0.000 1.000 0.075 0.185 0.000 7256.000 37.761 258.004 116,443(68.7%) 17,001(68.7%) 2 0.000 1.000 0.101 0.209 0.000 7256.000 54.278 266.226 167,383(98.7%) 24,438(98.7%) 3 0.000 1.000 0.070 0.184 0.000 7256.000 36.976 257.684 114,023(67.3%) 16,647(67.3%) 4 0.000 1.000 0.036 0.164 0.000 7256.000 35.859 257.631 110,580(65.2%) 16,145(65.2%)
efficiency like 31.3%, it could be explained as the area of dry field had more large value like 4.816km2 than other agricultural areas. But scenario (2) considering only paddy area which was changed to ginseng district, represented low reduction efficiency as 1.3%. It means
that sensitivity of paddy against soil erosion is smaller than that of dry field, even though the area of paddy had large value as 3.678km2. The analysis of soil erosion and sediment according to diverse scenarios can be very important decision -making data in establishing
the countermeasure of high density turbid water.
5. Summary and Conclusion
Chupung river basin of Geum river was chosen as study site to estimate the reduction efficiency of soil erosion and sediment yield by ginseng area.
First, Maximum Likelihood Method (MLM) as a kind of supervised classification method was applied to extract ginseng district based on IKONOS image, but we could not construct ginseng layer efficiently, because spectrum characteristics of ginseng and shade region were very complicated. Therefore screen digitizing method was used to extract more accurate ginseng district. As the result of the area and ratio of ginseng area represented 0.290km2 and 0.94% respectively. And the ratio of ginseng area among agricultural area showed about 3.15%.
The alloted areas to the ginseng district among paddy, dry field, orchard, and other agricultural areas are 0.045km2, 0.216km2, 0.028km2, 0.001km2 respectively.
Also, the alloted ratio into the ginseng area are 1.22%, 4.49%, 4.13%, 2.70%. It means dry field converted into the ginseng areas in high value.
This study applied RUSLE model to calculate soil erosion, especially that model can simulate soil loss by diverse scenarios and GIS data. Rainfall erosivity factor was calculated by rainfall data (2008 yr) around Chupung river basin. Cover management factor applying ginseng area shows more low value in 0.128 than existing cover management factor in 0.136.
SDR concept was used to analyze sediment yield from soil erosion. SDR was calculated as 0.146 by applying the area (=31km2) of Chupung river basin to Boyce's equation. The reductionefficiency of soil erosion by ginseng area represents low value in 0.9%, because the area of ginseng is small compared to areas of other agricultural lands.
And this study analyzed the reduction efficiency of soil erosion and sediment yield in many scenarios as kinds of crops of paddy, dry field, orchard, and other
agricultural areas convert to the ginseng district. As result of analysis of soil erosion and sediment yield according to scenarios, scenario (1) and (4) showed high reduction efficiency as 31.3% and 34.8% re- spectively, compared to existing research which didn't consider ginseng area. It means dry field is sensitive to the reduction efficiency of soil erosion. Therefore, the curtain of ginseng area is very effective to soil conservation in rainy season. Methodology suggested in this study can be very efficient tools to support decision -making for the countermeasure of high density turbid water.
References
Angima S.D., Stott D.E., O's Neill M.K., Ong C.K., Weesies G.A., 2003, Soil erosion prediction using RUSLE for central Kenyan highland conditions, Agricultural Ecosystems & Environment, 97, pp.
295-308.
Anton J.J. Van Rompaey, Gerard Govers, Etienne Van Hecke, Kristine Jacobs, 2001, The impact of land use policy on the soil erosion risk: a case study in central Belgium, Agriculture Ecosystems & Environment, 83, pp.83-94.
Bartsch K.P., 1998, Modelling Soil Loss to determine water loss risk at Camp Williams national guard base, PhD, UTAH State University, USA.
Erickson A.J., 1997, Aids for estimating soil erodibility – K value class and soil loss tolerance, U.S. Department of Agriculture, Soil Conservation Services: Salt Lake City of Utah.
Frentle M and Julien P.Y., 1987, Computer modeling of soil erosion and sediment yield from large watershed, Int. J. Sediment Res, 2, pp.38-68.
Houghton J.T., Jenkins G.J., Ephraums J.J., 2001, Climate Change 2001, Cambridge Univ. Press, Cambridge, UK.
Jensen J.R., 1996, Introductory digital image processing, ISBN 0-13-205840-5, Prentice Hall Series in Geographic Information Science, pp.197-231.
Donald Gabriels, Greet Ghekiere, Wouter Schiettecatte, Ilse Rottiers, 2003, Assessment of USLE cover management C-factors for 40 crop rotation systems on arable farms in the Kemmelbeek watershed, Belgium, Soil & Tillage
Research, 74, pp. 47-53.
G. S. Lee, 2006, The comparative estimation of soil erosion for Andong and Imha basins using GIS spatial analysis, Korean journal of Civil Eng., 26(2D), pp.
341-347.
Lufafa, A., Tenywa, M.M., Isabirye, M., Majaliwa, M.J.G., Woomer, P.L., 2003, Prediction of soil erosion in a Lake Victoria basin catchment using a GIS-based Universal Soil Loss model, Agricultural Systems, pp.883-894.
Ministry for Food Agriculture Forestry and Fisheries, 2008, Statistical Handbook of Ginseng, pp.1-15.
Pionke H.B., Blanchard B.J., 1975, The remote sensing of suspended sediment concentrations of small impoundments, Water, Air, and Pollution, 4, pp.19-32.
Renard K.G., G.R. Foster, G.A. Weesies and P.J. Porter, 1991, RUSLE : Revised Universal Soil Loss Equation, Journal of Soil and Water Conservation, 46(1), pp.
30-33.
Sabins Floyd F., 1997, Remote Sensing (principles and interpretation), ISBN 0-7167-2442-1, Freeman Company, pp.387-416.
Wayne D. Erskine, A. Mahmoudzadeh, C. Myers, 2002, Land use effects on sediment yields and soil loss rates in small basins of Triassic sandstone near Sydney, NSW, Australia, CATENA, 49, pp.271-287.
Wischmeier W.H., 1971, A Soil Erodibility Nomograph for Farmland and Construction sites, Journal of Soil and Water Conservation, 26, pp.189-193.
Wischmeier W., Smith D.D., 1978, Predicting rainfall erosion losses- a guide to conservation planning, Handbook 537, USDA-ARS.
Received (April 15, 2009) Revised (July 9, 2009) Accepted (July 10, 2009)