The Effect of Wavelet Pair Choice in the Compression of the Satellite Images
Hong Sung Jin1 and Dong Yeob Han2,*
1Department of Applied Mathematics, Chonnam National University, Jeonnam 550-749, Korea
2Department of Marine and Civil Engineering, Chonnam National University, Jeonnam 550-749, Korea
인공위성 영상 압축에 있어 웨이브렛 선택의 효과
진홍성1·한동엽2,*
1전남대학교 응용수학과, 550-749, 전남 여수시 둔덕동 산 96-1
2전남대학교 해양토목공학과, 550-749, 전남 여수시 둔덕동 산 96-1
Abstract: The effect of wavelet pair choice in the compression of the satellite images is studied. There is a trade-off between compression rate and perception quality. The encoding ratio is used to express the compression rate, and Peak Signal-to-Noise Ratio (PSNR) is also used for the perceptional performance. The PSNR and the encoding ratio are not matched well for the images with various wavelet pairs, but the tendency is remarkable. It is hard to find the pattern of PSNR for sampled images. On the other hand, there is a pattern of the variation range of the encoding ratio for each image. The satellite images have larger values of the encoding ratio than those of nature images (close range images).
Depending on the wavelet pairs, the PSNR and the encoding ratio vary as much as 13.2 to 21.6% and 16.8 to 45.5%, respectively for each image. For Synthetic Aperture Radar (SAR) images the encoding ratio varies from 16 to 20% while for the nature images it varies more than 40% depending on the choice of wavelet pairs. The choice of wavelet for the compression affects the nature images more than the satellite images. With the indices such as the PSNR and the encoding ratio, the satellite images are less sensitive to the choice of wavelet pairs. A new index, energy concentration ratio (ECR) is proposed to investigate the effect of wavelet choice on the satellite image compression. It also shows that the satellite images are less sensitive than the nature images. Nevertheless, the effect of wavelet choice on the satellite image compression varies at least 10% for all three kinds of indices. However, the important of choice of wavelet pairs cannot be ignored.
Keywords: wavelet pairs, PSNR, encoding ratio, ECR, satellite images compression
요 약: 웨이브렛 변환을 이용한 인공위성 영상의 압축을 보다 효과적으로 수행할 수 있는 필터의 조합을 살펴보았다.
압축정도를 표현하는 방법으로 encoding ratio를 이용하였고, 웨이브렛의 선택에 따라 PSNR값과 encoding ratio값이 변 하는 양상을 보았다. 웨이브렛의 선택에 따라 PSNR값은 대략 13.2-21.6% 정도의 차이를 보였고 encoding ratio는 16.8-45.5%까지의 차이를 보였다. SAR 영상의 경우 encoding ratio는 16%20% 변동이 있지만, 일반영상의 경우는 웨이 브렛의 선택에 따라 40% 이상 변화였다. 영상 압축시 웨이브렛의 선택효과는 인공위성 영상보다 일반영상에서 큰 영향 을 미쳤다. PSNR, encoding ratio의 지수에서 인공위성 영상은 웨이브렛 선택에 영향을 덜 받는다. 인공위성 영상의 압 축에 대한 웨이브렛 선택효과를 보여주기 위하여 새로운 지수인 ECR을 제안하였다. ECR은 일반영상보다 인공위성영 상에서 웨이브렛의 종류에 따른 영향이 더 적게 나타났다. 그러나 인공위성 영상 압축시 3개의 지수에서 웨이브렛의 선택효과는 최소한 10% 이상으로 선택의 중요성은 무시될 수 없을 것이다.
주요어: 웨이브렛 쌍, PSNR, encoding ratio, ECR, 인공위성 영상 압축
*Corresponding author: [email protected]
*Tel: +82-61-659-7249
*Fax: +82-61-659-6917
Introduction
The amounts of remotely sensed images from satellite are getting bigger and bigger The size of data in the modern networked life is really huge. Specially geographical information and position services are essential nowadays. There are massive amount of data transmission every second. The data compression is really important problem and is hot topic. Better compression with high perceptional quality is one of the goal of signal processing.
Wavelet transform was introduced in geophysics since 1980’s. Grossman and Morlet decomposed the hardy function (Grossman and Morlet, 1984). They showed that the oscillatory function can express seismic signals by translation and dilation. The application of wavelets in geophysics is getting wider.
Wavelets are used in polar motion analysis, seismic data processing, and gravity potential field (Oh, 2009;
Jung and Lee, 2007; Keller, 2004; Kim et al., 2004;
Rim et al., 1999).
Other application can be found in physics, chemistry, genetics, medicine and finance and earth science. For the remote sensed images the wavelet was used in denoising, compression, and classification (Jin et al., 2009; Yoo et al., 2008).
Data compression is becoming essential in remote sensed image processing to deal with the huge amount of data. The CCSDS (Consultative Committee for Space Data System) recommends the standards for image data compression. The standards are discrete wavelet transform but different in several points with those of JPEG2000 (Garca-Vlchez and Serra-Sagrist, 2009). The JPEG2000 uses wavelet techniques.
In this paper we use the separable wavelet basis in image compression. Non separable wavelet is more general in modern image processing because the image is not always rectangle (Vetterli and Kovacevic, 1995). Although the separable wavelet transform is confined to the rectangle still image, it is used widely because it is easy to manipulate. Many types of satellite image consist of rectangle, hence it is meaningful to develop techniques in dealing with the
remote sensed images with separable wavelet bases.
We present the effect of different wavelet basis pairs in the compression of the remote sensed images and nature images. Separable wavelet transform allows us to use different wavelet basis in different direction (Jin et al., 2010).
The image processing method using wavelet transform divide the image to four frequency band, i.e.
LL LH HL HH, two channel band for horizontal and two for vertical direction. Separable 2D wavelet multiresolution analysis usually decomposes an image into 4 parts at the first step and adapts the same algorithm to the LL part at the next step repeatedly.
The key point of compression is the degree of the perceptual quality to the human visual system. The perceptual quality is measured by PSNR and MSE in many articles (Cohen et al., 1992; Villasenor et al., 1995; Glasdston et al., 2008).
The peak signal-to-noise ratio, abbreviated PSNR, represents the ratio between the maximum possible power of a signal and the power of noise. The index PSNR is commonly used in image compression processing. The PSNR is one of perceptual quality measure and it is objective. It is calculated as follows:
PSNR=10 Log10 ( ) (1)
where
In the above equation, MSE represents the mean squared error for m×n monochrome image, A, and K · A represents the original image. K is the approximated image to A. If we use LL for K, K is reconstructed image from the subimage LL. max is the maximum possible pixel value of the image (Thomos et al., 2006). Although the smaller MSE is better and greater PSNR is better for the choice of wavelet function, the MSE and PSNR do not always correlated with the quality as perceived by human eye.
At high bit rate compression (≥1 bpp), images with PSNR above 32dB are considered to be perceptually
max2 ---MSE
⎝ ⎠
⎛ ⎞
MSE 1
mn--- A i j( ) K i j,, – ( )2
j 0= n 1– i 0=
∑
m 1–
∑
=
loseless. At medium and low bit rates, the PSNR does not agree with the quality of the image (Strang and Nguyen, 1996). Bit allocation and coding will assign many bit to LL so that the compression be more effective.
In satellite images the signal dependant noise can make the PSNR degrade seriously although the image is perceptible. Hence we need to check the processed images subjectively, too (Wang et al., 2004). Couple of other image quality evaluation index was proposed (Grgic et al., 2001).
In a lossy compression, there is a tradeoff between compression ratio and image quality. Images with high spectral activity are more difficult to compress. These images usually contain large number of small details and low spatial redundancy.
Choice of wavelet function for coding performance is critical step in image compression which consists of three steps such as choice of basis, quantization, and coding (Vetterli and Kovacevic, 1995).
Which wavelet shows the maximum PSNR? It depends on the characteristics of wavelets. There are rules associated with wavelet properties such as regularity, vanishing moment, size of support, symmetry, orthogonality. These properties are considered in order to select the right wavelets (Daubechies, 1992; Mallat, 1998). But there is not yet a representative algorithm to find the best wavelet for image compression.
This choice should be adjusted to image content.
The compression performance for images with high spectral activity is fairly insensitive to choice for compression method (Mandal et al., 1996). On the other hand, coding performances for images with moderate spectral activity are more sensitive to choice of compression method. The best way for choosing wavelet function is to select optimal basis for images with moderate spectral activity.
An algorithm to choose the wavelet pairs making nearly optimal PSNR was suggested and implemented well for some remote sensed images (Jin et al., 2010).
When we use the algorithm up to level three to find the nearly optimal wavelet pair, we got more than 1300 times speed up with less than 0.03% reduction
of PSNR. The algorithm was analysed precisely (Jin and Han, 2011). In those paper only the energy concentration in LL part was considered and no bit allocation and coding algorithm was used.
In this paper we introduce the index, ECR, representing energy concentration in LL. It comes from MSE. It is used to compare the dependence on the choice of wavelet pairs. And we compare the PSNR between the satellite images and nature images for various wavelet pairs. The wavelet compression was implemented in the MatLab software and the EZW (embedded zero tree) is used as a coding method. For another index, the encoding ratio is used to compare the compression efficiency between wavelet pairs. Then the effect of choice of wavelet pairs to the satellite images is compared to the nature images.
Methodology
We calculate the energy distribution for various wavelet pairs for the sample images in experiment 1.
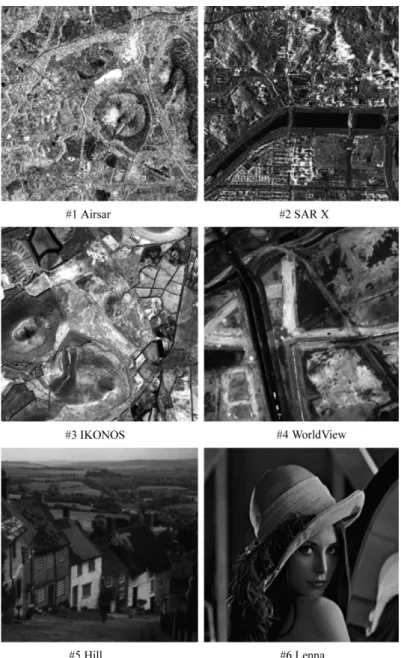
Figure 1 shows the sample images. The sample images consist of 2 SAR images, 2 high resolution optical images, and 2 nature images, one scenery and Lenna. The wavelet sets are composed of 9 wavelets in Table 1. Table 1 also shows the abbreviation of wavelets in this paper.
In experiment 2, the PSNRs are calculated and analyzed. The encoding ratio is used to measure the compression efficiency. Those values are calculated and compared in the 4th level, decomposition 4 times.
Experiment 1
Energy Distribution Patterns Depending on the Wavelet Pairs after EZW Encoding
The energy is calculated as follows
Energy= (2)
The energy of the image is the sum of the squares of wavelet coefficients; it is computed by sub-bands
fij
j
∑
m i∑
nafter the wavelet decomposition process.
For image compression the energy concentration to the low frequency part is critical in wavelet transform.
The low frequency part is again transformed. Those iteration keeps the high energy to the low frequency
part so that the compression rate is getting high with high energy retainment. The choice of wavelet pairs can make the energy distribution different. The nearly optimal choice of wavelet pairs was suggested (Jin et al., 2010). After transform, the encoding method is Fig. 1. Sample images; two SAR, two optical satellite and two nature images.
Table 1. Wavelets used in the image compression and their abbreviation
1 2 3 4 5 6 7 8 9
‘coif5’ ‘db8’ ‘sym8’ ‘bior1.1’ ‘bior1.3’ ‘bior2.2’ ‘bior3.9’ ‘bior4.4’ ‘bior5.5’
coif: Coiflet, db: Daubechies, sym: Symmelet, bior: Biorthogonal
used to make the compression more efficient. The EZW was introduced (Saphiro, 1993). It is fundamental method to code using the multiresolution characteristics of wavelet transform although more efficient methods such as SPHIT (Set-Partitioning In Hierarchical Trees) are developed. We use the EZW encoding and calculate the energy distribution. The energy distribution is expressed in terms of MSE in section 1.
Figure 2 shows the distribution of MSE for various wavelet pairs in LL and HH for 6 sample images, 81 wavelet pairs for each image. It’s scale and range is referable. The scale difference is more than 103 and the maximum and minimum values for the individual images are shown in Table 2. It shows the huge energy concentration to LL. If we want concentration more energy to LL, we have pick the optimal wavelet pairs. So the lower in the MSE from LL is better while the higher in the MSE from HH is better. For the image 1 the minimum MSE in LL is 870 and the maximum in LL is 1023. We use a new index ECR for the effect of wavelet choice to the satellite image compression.
ECR is for energy concentration ratio and is defined as follows:
(3) It measures the degree of the optimal over worst energy concentration. If the ECR is large there can be big difference in the compression performance. For
ECR (max MSE of LL min MSE of LL– ) max MSE of LL
--- 100 %× ( )
= Fig. 2. MSE for the six images with 81 wavelet pairs to each images.
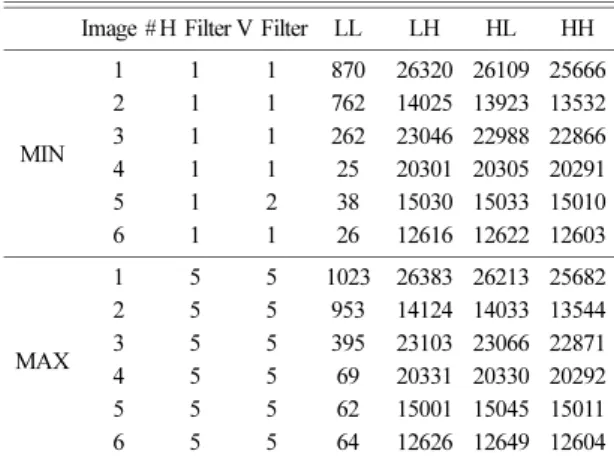
Table 2. MSE distribution with wavelet pairs for the sam- ple images
Image # H Filter V Filter LL LH HL HH
MIN
1 1 1 870 26320 26109 25666
2 1 1 762 14025 13923 13532
3 1 1 262 23046 22988 22866
4 1 1 25 20301 20305 20291
5 1 2 38 15030 15033 15010
6 1 1 26 12616 12622 12603
MAX
1 5 5 1023 26383 26213 25682
2 5 5 953 14124 14033 13544
3 5 5 395 23103 23066 22871
4 5 5 69 20331 20330 20292
5 5 5 62 15001 15045 15011
6 5 5 64 12626 12649 12604
large ECR value we have to be careful to choose the wavelet pairs. The performance of compression can be degrade for a certain wavelet pair.
Table 3 shows ECRs with various wavelet pairs for 6 images. Nature images have larger values than that of SAR images. It means that SAR images are less sensitive to the choice of wavelet pairs than the nature images.
The 9 kinds of wavelet filters in Table 1 is used. In MatLab the ‘bior nd*nr’ represents the vanishing moments in decomposition(nd) and reconstruction(nr) while biorthogonal A · S represents the filter length in analysis (A) and synthesis (S) in other references. As an example ‘bior4.4’ in MatLab is CDF97 scaled by . The CDF is Cohen-Daubechies-Feauveau wavelet (Cohen et al., 1992). The CDF97 is standard biorthogonal wavelet used in JPEG2000. It is symmetric wavelet with vanishing moment 4 in analysis and synthesis, so named ‘bior4.4’ in MatLab. The filter length of CDF97 is 9 in analysis and 7 in synthesis, in other words 9 in lowpass and 7 in high pass.
The 9 kinds of wavelet make 81 wavelet pairs to transform each images in Table 4.
The numbers “1-81” in the x axis are for the wavelet pairs for the image number 1, SAR image.
In Fig. 2 we focused to the pattern for the images.
For more precise interpretation we focused one image to see the MSE distribution pattern for various wavelets.
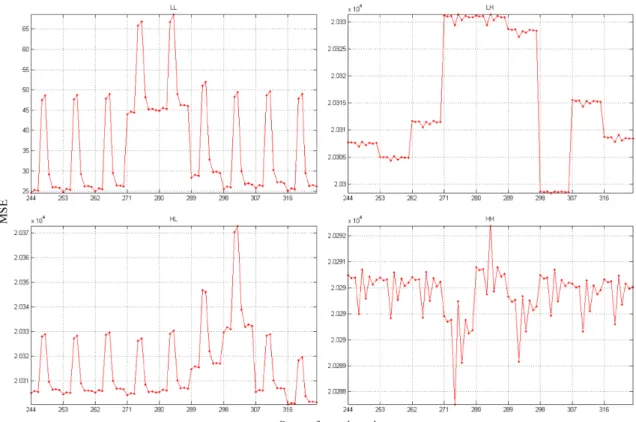
Figure 3 represents the mean square error distribution in 4 part i.e. LL, HL, LH and HH. The numbering in
the x axis follows to Table 4. The range of the MSE in LL was 25-69. The MSE in other part was 20288- 20373. It means that there is big energy concentration in LL. But there is big difference in LL in terms of wavelet pairs. The MSE score 25 and 69 can be big difference in compression efficiency. It is important to choose the proper wavelet pairs making MSE score smaller.
Experiment 2
Encoding Ratio and PSNR
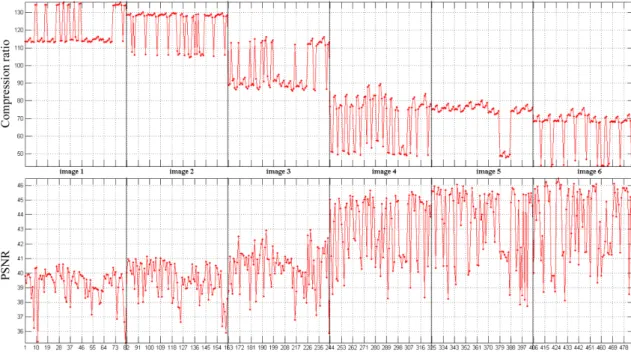
In Fig. 4 both values PSNR and encoding ratio are fluctuating. The pattern of encoding ratio looks more formative than that of PSNR. A little bit change of an image can make the PSNR small though the image quality is quite acceptable (Grgic et al., 2001). While the PSNR can represent the compression performance it is so objective. Table 5 shows the maximum and minimum PSNR for images and the wavelet pairs.
We used the encoding ratio denoted by “ENR” for another compression performance such as
Encoding ratio (ENR)=
(4)
The lower ENR value means the higher compression ratio. The change of encoding ratio looks more stable. The value seems to depend on the images. We can separate the images by grouping the encoding ratio values in the upper part of Fig. 4. By contrast it is harder to draw a border line between images with PSNR values in the lower part of Fig. 4.
In each images the value of encoding ratio varies up to 50% or more depending on the choice of wavelet pairs.
The range of PSNR of the satellite images (1-3) are lower than that of nature images (4-6) while the range of encoding ratio of the satellite images (1-3) are 2
Coded file size
Number of element∈originalfile --- 100× Table 3. The energy concentration ratio (ECR) in LL
Image min MSE in LL max MSE in LL ECR(%)
1 870 1023 15.0
2 762 953 20.0
3 262 395 33.7
4 25 69 63.8
5 38 62 38.7
6 26 64 59.4
Table 4. The index of wavelet pairs in the x axis in Fig. 1
Image 1 Image 2 Image 3 Image 4 Image 5 Image 6
x-axis 1-81 82-162 163-243 244-324 325-405 406-486
higher than that of natural images (4-6). The sample 1 and 2 are SAR images with a lot of noise. They showed low PSNR and high ENR values. The sample 3 and 4 are optical satellite images with moderate noise and PSNR. The sample 5 and 6 are natural images showing high PSNR and effective compression
with low ENR values. Hence the satellite images showed lower compression ratio with lower PSNR than the nature images.
The range of encoding ratio variation was 16.8 to 45.5% in Table 6. For SAR images it showed generally narrow range of encoding ratio variation, 16.8 and 19.7. There were more than 40% differences of encoding ratio in other nature images.
The variation of PSNR was 13.2 to 21.6%. For SAR images it showed narrow range of variation, too.
Therefore satellite images are less sensitive to the choice of wavelet pairs. Despite, the choice of wavelet pairs can make the compression efficient more than at least 10% for satellite images.
The compression performance index PSNR over 30 is hard to perceive the difference between images.
Another index ENR can be helpful in picking up the effective wavelet pairs when the PSNR is over 30.
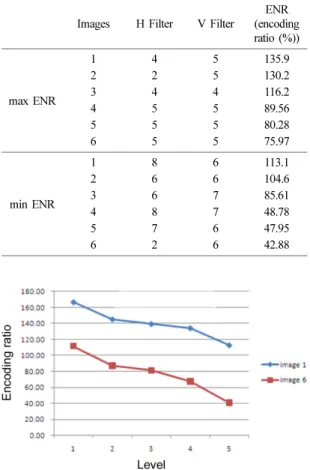
Table 7 shows wavelet pairs up to level 4 with maximum and minimum encoding ratio.
Fig. 3. Mean square error of image #4 in decomposed images.
Table 5. Wavelet pairs showing maximum and minimum PSNR for 6 images
Image # H Filter V Filter MSE PSNR
max PSNR
(min MSE)
1 4 4 5.669 40.60
2 2 8 4.996 41.14
3 8 3 3.302 42.94
4 4 6 1.770 45.64
5 3 3 1.613 46.05
6 3 3 1.461 46.48
min PSNR
(max MSE)
1 9 9 19.49 35.23
2 9 8 16.65 35.91
3 9 9 16.72 35.89
4 6 2 9.686 38.26
5 9 5 10.91 37.74
6 9 9 14.71 36.45
Without counting the threshold the compression ratio is 1/4 times as level goes one step. The five level menas 210 times compression. But every level encoding and quantization is used to concentrate energy to the low frequency part. So the optimal wavelet pairs for the encoded processing can be different to maximum PSNR valued wavelet pairs calculating only the energy concentration in LL without encoding.
PSNR tends to increase as level goes up in the lower levels in Fig. 6. After level 4 the PSNR is decreasing in both images. The decomposition level 4 means low bit rate expression for the images. At high
decomposition level it is hard to predict the nearly optimal wavelet pairs in terms of PSNR from the level 1.
On the other hand the ENR is decreasing almost linearly from level 1 to level 5 in Fig. 5. The lower value of ENR means high compression efficiency so that the compression efficiency is getting better as level goes up. Therefore the ENR can be an index for the choice of wavelet transform pairs.
There is a tradeoff between PSNR and compression ratio. Here the compression ratio was expressed in terms of encoding ratio, the lower encoding ratio higher compression ratio. As level goes up the PSNR Fig. 4. Encoding ratio and PSNR for the six images with 81 wavelet pairs.
Table 6. The ranges of PSNR and encoding ratio
1 (SAR) 2 (SAR) 3 (IKONOS) 4 (WorldView) 5 (hill) 6 (Lenna)
ENR
Max 136.0 130.2 116.3 89.6 80.3 76.0
Min 113.2 104.6 85.6 48.8 48.0 42.9
D 22.8 25.6 30.7 40.8 32.3 33.1
D(%) 16.8 19.7 26.4 45.5 40.3 43.6
PSNR
Max 40.60 41.14 42.94 45.65 46.05 46.48
Min 35.23 35.91 35.90 38.27 37.75 36.45
D 5.37 5.23 7.04 7.38 8.30 10.03
D(%) 13.2 12.7 16.4 16.2 18.0 21.6
ENR: encoding ratio, D: Max-Min, D(%): D/Max×100
is getting lower in the benefit of high compression ratio. The Blue Book CCSDS 122.0-B-1 defined the standard for Image Data Compression (IDC), where the level of wavelet transform was set to three (Garca-
Vlchez and Serra-Sagrist, 2009). Satellite images usually contain large number of small details and low spatial redundancy. It is hard to compress the images with high spectral activity such as remote sensed images. It shows level 4 is maximum for our SAR sample image 1 in Fig. 6. While the PSNR can represent the compression performance it is so objective. So for SAR images we have to choose the level between level 3 and level 4, although the PSNR in level 4 is greater than that in level 3. Even in the same level the PSNR varies more than 10%
depending on the choice of wavelet pairs as in level 4.
Discussion and Conclusions
The effectiveness of wavelet choice for the satellite image compression was reviewed in terms of PSNR.
The perceptional performance index PSNR varied more than 10% for the wavelet pair selections. For satellite images the PSNR varied less than for the nature images. It looks like that satellite images are less sensitive to the choice of wavelet pairs. The PSNR started to decrease from level 4. As the decomposition level goes up we get the high compression ratio with low bit rate. At medium and low bit rates, the PSNR does not agree with the quality of the image (Strang and Nguyen, 1996).
For satellite images the PSNR varied near 13%
while for the nature images it varied near 20%. It means that satellite images are less sensitive to the choice of wavelet pairs.
We used a new index ECR, energy concentration ratio, for the effect of wavelet choice to the satellite image compression. It also showed that satellite images are less sensitive than nature images. ECR is based on MSE so that it is very much related to PSNR.
For another compression performance index, the encoding ratio was used and tested. There was strong grouping for images with various kinds of wavelet pairs. The encoding ratio tends to decrease with more compression. The new index varied up to 45% for one image with different wavelet pairs.
Table 7. Wavelet pairs showing maximum and minimum encoding ratios for 6 images
Images H Filter V Filter
ENR (encoding ratio (%))
max ENR
1 4 5 135.9
2 2 5 130.2
3 4 4 116.2
4 5 5 89.56
5 5 5 80.28
6 5 5 75.97
min ENR
1 8 6 113.1
2 6 6 104.6
3 6 7 85.61
4 8 7 48.78
5 7 6 47.95
6 2 6 42.88
Fig. 5. Encoding ratio of image 1 and image 6 from level 1 up to level 5.
Fig. 6. PSNR of image 1 and image 6 from level 1 up to level 5.
For satellite images the encoding ratio varied less than for the nature images.
Nature images are really sensitive to the choice of wavelet pairs. The effect of choice of wavelet was strong in the nature images up to 45% while the effect was in the satellite images more or less 20%. The minimum was still 16.8%, which is not ignorable.
Although the satellite images are less sensitive to the choice of wavelet pairs, it is important to choose proper wavelet pairs for satellite image compression.
(1) With the index PSNR, the SAR images were less sensitive to the choice of wavelet pairs. The encoding ratio was 16.8% for SAR image 1 and 43.6% for image 6, Lena, depending on the choice of wavelet pairs.
(2) With the index encoding ratio, the SAR images were also less sensitive to the choice of wavelet pairs. The PSNR was 13.2% for SAR image 1 and 21.6% for image 6, Lena, depending on the choice of wavelet pairs.
(3) With the index ECR, energy concentration ratio, satellite images were less sensitive to the choice of wavelet pairs.
(4) The variation range of encoding ratio was larger than that of PSNR, 16.8-45.5% vs. 13.2-21.6%.
Therefore the encoding ratio can be more useful to pick up the optimal wavelet pairs.
(5) When the PSNR is over 30 it is hard to perceive the difference between images. Another index ENR or ECR can be helpful in picking up the effective wavelet pairs when the PSNR is saturated.
(6) In general satellite images were less dependant on the choice of wavelet pairs comparing to nature images. Nevertheless, it is important to choose more effective wavelet pairs or not to choose worst wavelet pairs, because it showed at least 10% difference efficiency in all cases with three kinds of index.
Acknowledgments
We thank to the referees. This paper is for Professor
Kwon, Byung Doo.
This study was financially supported by Chonnam National University, 2010.
References
Cohen, A.I., Daubechies, I., and Feauveau, J.C., 1992, Biorthogonal bases of compactly supported wavelets.
Communications on Pure and Applied Mathematics, 45, 485-560.
Daubechies, I., 1992, Ten lectures on wavelets. Society for Industrial and Applied Mathematics, Philadelphia, 357 p.
Garca-Vlchez, F. and Serra-Sagrist, J., 2009, Extending the CCSDS recommendation for image data compression for remote sensing scenarios. Institute of Electrical and Electronics Engineers Transactions on Geoscience and Remote Sensing, 47, 3431-3445.
Gladston, R., Revathy, K., and Raju, G., 2008, Study on the choice of wavelet filters for image compression using neural and k-nearest neighbor classifiers. Journal of Wavelet Theory and Applications, 2, 15-30.
Grgic, S., Grgic, K., and Zovko-Cihlar, B., 2001, Perfor- mance analysis of image compression using wavelets.
Institute of Electrical and Electronics Engineers Transac- tions on Industrial Electronics, 48, 682-695.
Grossmann, A. and Morlet, J., 1984, Decomposition of hardy functions into square integrable wavelets of con- stant shape. Society for Industrial and Applied Mathe- matics on Mathematical Analysis, 15, 723-736.
Jin, H., Yoo, H., Eom, J., Choi, I., and Han, D., 2009, Wavelet pair noise removal for increasing the classifica- tion accuracy of a remotely sensed image. Korean Jour- nal of Remote Sensing, 25, 1-9.
Jin, H., Han, D., and Lee, H., 2010, Nearly optimal wave- let pairs for remotely sensed image compression. Pro- ceedings of the 2010 Institute of Electrical and Electronics Engineers International Geoscience and Remote Sensing, 2179-2181.
Jin, H. and Han, D., 2011, Choice of separable wavelets for image compression. Journal of Wavelet Theory and Applications. (to be appeared)
Jung, H. and Lee, B., 2007, The S-wave velocity structure of shallow subsurface obtained by continuous wavelet transform of short period Rayleigh waves. Journal of the Korean Earth Science Society, 28, 903-913.
Keller, W., 2004, Wavelets in geodesy and geodynamics.
Walter de Gruyter, NY, USA, 279 p.
Kim, S., Jin, H., and Rim, H., 2004, Wavelet generation and it's application in gravity potential. Journal of the Korean Earth Science Society, 25, 256-264.
Mallat, S., 1998, A wavelet tour of signal processing. Aca- demic Press, USA, 577 p.
Mandal, M.K., Panchanathan, S., and Aboulnasr, T., 1996, Choice of wavelets for image compression. Lecture Notes in Computer Science, 1133, 239-249.
Oh, S., 2009, Variation analysis of geomagnetic data observed around the event of Andong earthquake (May 2, 2009). The Journal of the Korean Earth Science Society, 30, 683-691.
Rim, H., Jin, H., and Kwon, B., 1999, Denoise of syn- thetic and earth tidal effect using wavelet transform.
Journal of the Korean Geophysical Society, 2, 143-152.
Shapiro, J.M., 1993, Embedded image coding using zerotrees of wavelet coefficients. Institute of Electrical and Electronics Engineers Transactions on Signal Pro- cessing, 41, 3445-3462.
Strang, G. and Nguyen, T., 1996, Wavelets and filter banks.
Wellesley and Cambridge Press, MA, USA, 520 p.
Thomos, N., Boulgouris, N., and Strintzis, M., 2006, Opti-
mized transmission of JPEG2000 streams over wireless channels. Institute of Electrical and Electronics Engi- neers Transactions on Image Processing, 15, 54-67.
Vetterli, M. and Kovacevic, J., 1995, Wavelets and sub- band coding. Prentice Hall, NJ, USA, 488 p.
Villasenor, J., Belzer, B., and Liao, J., 1995, Wavelet filter evaluation for image compression. Institute of Electri- cal and Electronics Engineers Transactions on Image Processing, 4, 1053-1060.
Wang, Z., Lu, L., and Bovik, A.C., 2004, Video quality assessment based on structural distortion measurement.
Signal Processing: Image Communication, 19, 121-132.
Yoo, H.Y., Lee, K.W., Jin, H.S., and Kwon, B.D., 2008, Selecting optimal basis function with energy parameter in image classification based on wavelet coefficients.
Korean Journal of Remote Sensing, 24, 437-444.
2011년 7월 4일 접수 2011년 8월 2일 수정원고 접수 2011년 8월 12일 채택