* Associate Professor, Department of Applied Mathematics, The Chonnam National University ([email protected])
** Corresponding Author, Assistant Professor, Department of Civil & Environmental Engineering, The Chonnam National University ([email protected])
Wavelet Compression Experiments of the Remotely Sensed Images for Three Kinds of Wavelet Families
Jin, Hong Sung* ・ Han, Dong Yeob**
ABSTRACT
A method to find the nearly optimal PSNR values for compression was tried to remotely sensed images. There is no rule to find the best wavelet pairs for image processing. The expected wavelet pairs following the suggested algorithm showed the optimal result for various kinds of images. Firstly, the PSNR variations with three wavelet families were analyzed. In many cases the longer wavelet filter shows the higher PSNR value, but the rate is getting less in orthogonal wavelet families. Wavelets with moderate filter length are suggested at the point of computational cost. For biorthogonal families it was hard to predict from the length of filters. Multiresolution wavelet analysis was used up to level 3 with three kinds of wavelet families. Biorthogonal wavelet family showed irregular pattern to get the maximum PSNR values, while orthogonal wavelet families showed regular pattern. In orthogonal wavelet families the nearly optimal wavelet pair can be predicted from the level 1.
Keywords : Wavelet, Compression, Remotely Sensed Images
요 약
원격탐사 영상에서 압축을 위한 근최적의 PSNR 값을 찾는 방법을 연구하였다. 예상 웨이블릿쌍은 다양한 영 상에서 최적의 결과로 나타났다. 영상처리를 위한 최고의 웨이블릿쌍을 찾는 규칙은 없다. 제시된 알고리즘에 따라 예상 웨이블릿쌍이 다양한 종류의 영상에서 최적의 결과를 나타냈다. 먼저 세 개의 웨이블릿 패밀리에 서 PSNR 값의 변화를 분석하였다. 직교 웨이블릿 패밀리에서는 많은 경우에 웨이블릿 필터의 길이가 길수록 높은 PSNR 값을 나타내지만, 그 증가 비율이 점차로 작아졌다. 연산비용의 측면에서 중간 필터길이의 웨이블 릿을 제안한다. 쌍직교 웨이블릿 패밀리에서는 필터의 길이와 PSNR값의 관계를 예측하기는 어려웠다. 다차 원 웨이블릿 분석에서는 세 개의 웨이블릿 패밀리가 3단계까지 처리되었다. 쌍직교 웨이블릿 패밀리는 최대 PSNR 값에서 불규칙한 패턴을 보였지만, 직교 웨이블릿 패밀리는 규칙적 패턴을 나타냈다. 직교 웨이블릿 패 밀리는 1단계 결과로부터 근최적의 웨이블릿쌍을 예상할 수 있었다.
주요어 : 웨이블릿, 압축, 원격탐사 영상
resolution Seamless Image Database) are used for airphoto, satellite images. In DWT Discrete Wavelet Transform), biorthogonal 9/7, 5/3, Daubechies D4 filter, asymmetrical filters, etc are used Chae et al., 2003).
There are too many wavelets to pick the best one for each applications. The theoretical criterions to pick the good wavelet were mentioned in some references (Daube- chies, 1992, and Mallat, 1998). But for the real world it is impossible to pick the optimal wavelets.
In this research, we compared wavelet families and evaluated different horizontal and vertical filter pairs for compression. This method does not always give the algo- rithm to pick the optimal one for any cases but shows the nearly optimal wavelet pairs for remotely sensed image compression. It can be also used to other image process- ing fields.
The image processing method using wavelet transform divide the image to four frequency bands, i.e. LL LH HL HH, two channel band for horizontal and two for vertical direction. The energy distribution pattern to four parts depends on the kind of wavelet. The energy concentration of LL part was expressed by PSNR value.
The peak signal-to-noise ratio, abbreviated PSNR, re- presents the ratio between the maximum possible power of a signal and the power of noise. Since the part con- cerned was LL, the other parts, LH, HL, and HH were treated as noise.
The PSNR values are calculated as follows:
max ) ( log 10
2
10 mse
psnr = ⋅
,
where
1 2
0 1 0
0(, ) (, )
1 ∑ ∑−
=
−
=
−
= m
i n j
j i LL j i mn M
mse
found for eight kinds of remotely sensed images. A me- thod suggested in Jin et al. (2009) was tried to these images. Then the results were compared to the real maxi- mum PSNR values. The wavelets were used in vertical and horizontal direction separately. If n kinds of wave- let comes from a wavelet filter bank then n^2 wavelet pairs can be made for image processing filter.
In experiment 2 the PSNR values were calculated and compared with different filter length for three kinds of wavelet families. In experiment 3 the maximum PSNR values up to level 3 were calculated using the method in experiment 1. Then the wavelet pairs making maximum PSNR values were examined. As level goes up we can get more compressed images in a lossless image process- ing with perfect reconstructible wavelet bases. However we may lose important information as level goes up. Hence the experiment goes up to level 3.
2. Experiment 1: The choice of nearly optimal wavelet basis
For image compression optimal wavelet bases shows few non-zero coefficients in data processing. To find those wavelets we would better check the regularity of data and the vanishing moment of wavelets. The support of wavelets is another factor to consider. If a wavelet has p vanishing moment then its support is at least of size 2p-1. Daubechies wavelets with p vanishing moment have the support size 2p-1 while coiflet wavelets have the support size 3p-1 (Daubechies, 1992). The vanishing moment and the size of biorthogonal wavelets depend on the filter length of analysis and synthesis. As an example db2 has 2 vanishing moment with the support size 3. If the image is very regular, wavelets with many vanishing moment is more efficient. Hence wavelets with longer filter length are good for regular images. It there are many singularities
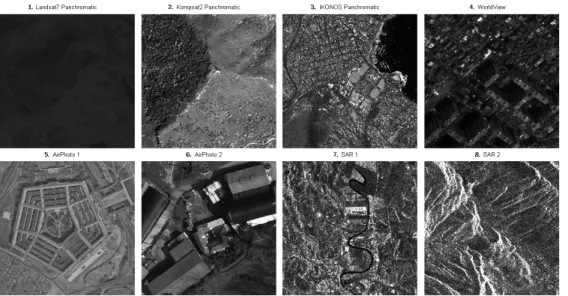
Figure 1. Remotely sensed images
in the image we’d better choose short length wavelets (Mallat, 1998).
But the regularity of the image is hard to count for real images. In fact it is almost impossible to find the optimal algorithm working everywhere. By heuristic, one method was suggested in Jin et al. (2009).
The method was tried for eight remotely sensed images which were selected because of various ground resolution, land use, optical and microwave images. The images are shown in Fig. 1. They are consisted of Landsat 7, Komp- sat 2, IKONOS, WorldView, airphoto, synthetic aperture radar images.
The method is consisted of two steps. At first, fix the horizontal wavelet filter as db1 with various wavelets as vertical filter then pick the vertical wavelet which shows the maximum PSNR value. Second, change the role of horizontal filter to the vertical one. As an example if we have a filter bank consisted of {db1,db2,db4}. Then there could be 9 kinds of wavelet pairs. The wavelet pair {db(hmax), db(vmax)} is suggested which satisfies the following condition :
(i) {db1, db(vmax)} ≥ {db1, db*}
(ii) {db(hmax), db1} ≥ {db*, db1}
This algorithm is tested to the eight kinds of remotely
sensed images with 18 kinds of wavelet filter bank.
Table 1 shows the wavelets used in experiment 1.
The expected wavelet pairs come from the above algori- thm. Table 2 shows the results. For all images the expected wavelet pairs making maximum PSNR values are coincide with the real maximum ones. This may not work everywhere.
However, this method may work good for many images without counting the regularities of images.
3. Experiment 2: Pattern of PSNR values for the three kinds of wavelet families
In multiresolution wavelet analysis the LL part is used as an target image to process in the next level. Hence the energy amount in the LL part is very important. The energy distribution to LL can be estimated through PSNR value. The PSNR value may depend on the kinds of wave- let filters. For different wavelet family the PSNR value variation may show different pattern.
Three types of wavelet families such as daubechies, coiflet, and biorthogonal wavelet families were chosen to this experiment. Compactly supported wavelets are gua- ranteed to have perfect reconstruction. Daubechies orthogo- nal wavelet family and biorthogonal wavelet family are
coiflet# coif1,coif3,coif4,coif5 biorthogonal# bior2.6, bior3.1, bior3.5,
bior3.9, bior4.4, bior6.8
Table 2. expected and real PSNR values for eight images
image#
wavelet pair (horizontal, vertical) optimal/
nearly optimal expected
max PSNR
real max PSNR
1 (db10,coif5) (db10,coif5) optimal 2 (db10,coif5) (db10,coif5) optimal 3 (db10,db10) (db10,db10) optimal 4 (coif5,coif5) (coif5,coif5) optimal 5 (coif5,db10) (coif5,db10) optimal
6 (db8,db8) (db8,db8) optimal
7 (coif5,db10) (coif5,db10) optimal 8 (coif5,coif5) (coif5,coif5) optimal
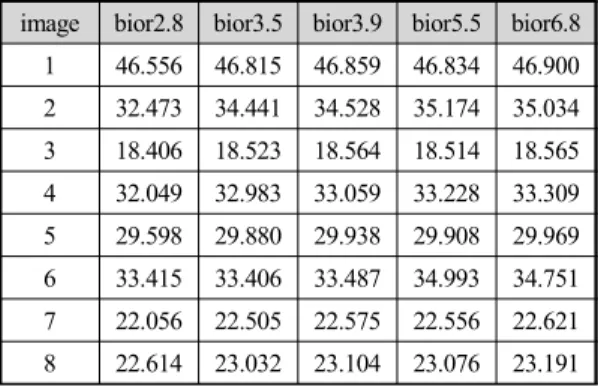
biorthogonal bior2.8 bior3.5 bior3.9 bior5.5 bior6.8
Table 4. PSNR values for various wavelets in bio- rthogonal families
image bior2.8 bior3.5 bior3.9 bior5.5 bior6.8 1 46.556 46.815 46.859 46.834 46.900 2 32.473 34.441 34.528 35.174 35.034 3 18.406 18.523 18.564 18.514 18.565 4 32.049 32.983 33.059 33.228 33.309 5 29.598 29.880 29.938 29.908 29.969 6 33.415 33.406 33.487 34.993 34.751 7 22.056 22.505 22.575 22.556 22.621 8 22.614 23.032 23.104 23.076 23.191
widely used compactly supported wavelet groups. The coiflet is very similar to the daubchies wavelet families except the length of support of the scaling function. So three wavelet families are representative to the compactly supported wavelets.
To see the pattern of PSNR value variation the horizon- tal and the vertical filter were chosen identical filter. In each families the wavelets chosen were different with those in the experiment 1.
Table 3 shows the wavelet families and wavelets used in experiment 2 and 3. Wavelets in each families were numbered 1 to 5.
All those families are compactly supported wavelets.
To construct the wavelet with perfect reconstruction the analysis and the corresponding synthesis filter, the alias cancellation and the distortion correction should be done to make a product filter. This product filter can be factored to make a analysis and synthesis wavelet pairs. The bio-
rthogonal and the daubechies families come from the fac- toring the product filter (Strang and Nguyen, 1996).
where : product filter,
: lowpass filter for analysis, : lowpass filter for synthesis
The coiflet wavelet come from the daubechies wave- let by modifying the scaling function (Daubechies, 1992).
3.1 Results for biorthogonal wavelet family
Table 4 shows the PSNR values for each eight remo- tely sensed images with biorthogonal wavelets. There are four patterns (as) shown in Fig. 2. Fig. 2(a) shows the pattern for the image 2. and 2(b) for the image 4.
The pattern of PSNR for the images 1,3,7,8 follows the pattern of the image 5 shown in Fig. 2(c).
Without bior5.5 they show very similar pattern for all images except for the image 15. Bior5.5 and bior6.8 show
Figure 2. 4 patterns of PSNR variation for the biorthogonal family
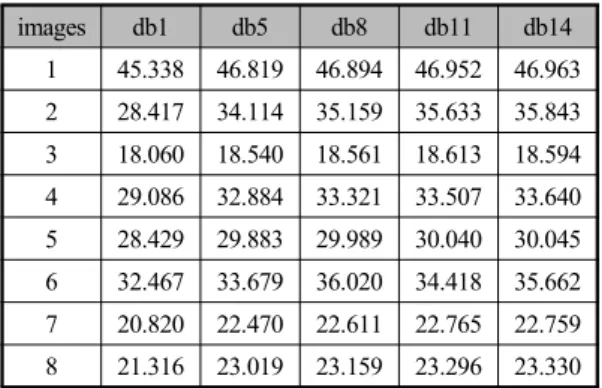
Table 5. PSNR values for various wavelets in dau- bechies families
images db1 db5 db8 db11 db14
1 45.338 46.819 46.894 46.952 46.963 2 28.417 34.114 35.159 35.633 35.843 3 18.060 18.540 18.561 18.613 18.594 4 29.086 32.884 33.321 33.507 33.640 5 28.429 29.883 29.989 30.040 30.045 6 32.467 33.679 36.020 34.418 35.662 7 20.820 22.470 22.611 22.765 22.759 8 21.316 23.019 23.159 23.296 23.330
Figure 3. 2 patterns of PSNR variation for the daubechies family wavelets
Table 6. PSNR values for various wavelets in coi- flet families
images coif1 coif2 coif3 coif4 coif5 1 46.371 46.760 46.867 46.916 46.943 2 31.329 33.672 34.651 35.183 35.515 3 18.356 18.502 18.549 18.573 18.587 4 31.404 32.701 33.148 33.374 33.510 5 29.412 29.820 29.935 29.987 30.017 6 32.899 34.246 34.704 34.935 35.074 7 21.792 22.347 22.546 22.648 22.710 8 22.344 22.913 23.115 23.219 23.282
high PSNR values for all the images. For the image 15, bior2.8 bior3.5 bior3.9 show relatively low PSNR values.
Biorthogonal wavelet filtering depends on the filter length of analysis and synthesis. This family wavelets are hard to predict the result from the filter length. Biorthogonal 3.9 means that the filter length of analysis is 3 and that of synthesis is 9.
3.2 Result for daubechies wavelet family
Table 5 shows the PSNR values for each eight remo- tely sensed images with daubechies wavelets. Fig. 2 shows the pattern of PSNR variation with wavelets in daubechies family. The patterns for images 1,2,4, and 8 are similar to that of the image 5 in Fig. 3(a)
The length of db filter is getting longer as PSNR values is getting better, but the rate is getting smaller.
There were three exceptions for images 3, 7 and 6. For the image 3 and 7, they show very similar pattern to pattern 1 except db11. The wavelet db11 has the higher PSNR value than that of longer filter db 14. Including the mage 3 and 7 for most of all images do not show the effectiveness after longer than the filter db8. The real small increasing PSNR value with longer filter make the calculation cost high. Hence it is not a bad idea to take db8 or db11 as the adequate filter in pro- cessing. For the case of image 6, db8 is the most suitable as shown in Fig. 3(b).
3.3 Result for coiflet wavelet family
Table 6 shows the PSNR values for each eight remotely sensed images with coiflet wavelets. There is only one pattern. The length of db filter is getting longer as PSNR values is getting better, but the rate is getting smaller.
There was no exception for the coiflet family. They shows
Figure 4. The pattern of PSNR variation for the coiflet family
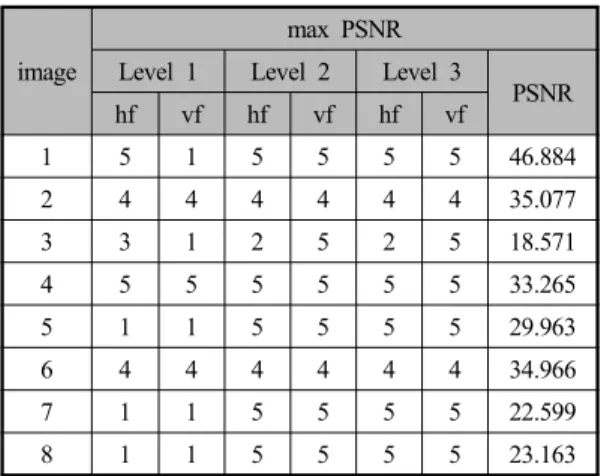
1 5 1 5 5 5 5 46.884
2 4 4 4 4 4 4 35.077
3 3 1 2 5 2 5 18.571
4 5 5 5 5 5 5 33.265
5 1 1 5 5 5 5 29.963
6 4 4 4 4 4 4 34.966
7 1 1 5 5 5 5 22.599
8 1 1 5 5 5 5 23.163
Table 8. daubechies wavelet pairs with maximum PSNR values at each level
image
max PSNR Level 1 Level 2 Level 3 hf vf hf vf hf vf PSNR
1 4 5 4 5 4 5 46.956
2 5 5 5 5 5 5 35.767
3 4 4 4 4 4 4 18.610
4 5 5 5 5 5 5 33.610
5 5 4 5 4 5 4 30.040
6 3 3 3 3 3 3 36.019
7 4 4 4 4 4 4 22.756
8 5 5 5 5 5 5 23.306
the one type graph in Fig. 4. Coif3 or coif4 can be an effective filter in the sense of the calculation cost.
4. Experiment 3: W avelet families for the image compression
The multiresolution analysis is very useful in the image compression. For two band filter it usually divide the image into four parts such as LL, LH, HL, and HH.
Here H represents the high pass filtered image and L for the low pass filtered one. As mentioned in the ex- periment 1, the choice of wavelet can make the distri- bution of the energy in the four parts different. The multiresolution method analyzes the LL part again to make the level one up. Again the choice of wavelet is needed. At each level the PSNR values are calculated to find the maximum energy in the LL part as in the experiment 1. Hence, the many kinds of wavelet were used to horizontal and vertical direction separately. Three kinds of wavelet families in the experiment 2 were used. The level was tried up to three. Table 7 ∼ Table 9 show the wavelet pairs which have maximum PSNR values at each level for sample images. In each table hf represents horizontal filter and vf does vertical filter.
The numbering is followed the table 3.
For the biorthogonal families the wavelet pairs showing maximum PSNR values are different at each level in five images out of eight images. For the image 1,5,7 and 8 two kinds of wavelets were used to get the maximum PSNR values. But for the image 3 four kinds of wavelet were used. Total elapsed time to calculate the maximum PSNR value for each image was hugh.
Hence finding the maximum PSNR values for image
compressions may cost too much.
For the daubechies families the wavelet pairs showing maximum PSNR values are identical at each level. It means that the nearly wavelet pairs can be predicted at the level one.
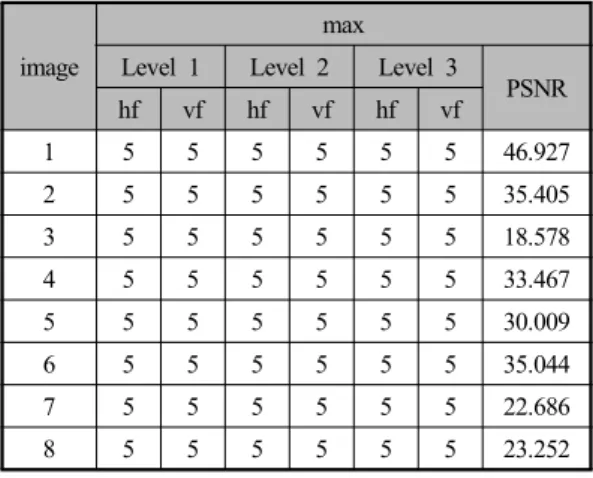
For the coiflet families the wavelet pairs showing maximum PSNR values are identical at each level. Even those wavelets are identical. It was the coif5 with long- est filter length in the family. It means that the optimal wavelet pairs can be predicted at the level one.
Table 9. coiflet wavelet pairs with maximum PSNR values at each level
image
max Level 1 Level 2 Level 3 hf vf hf vf hf vf PSNR
1 5 5 5 5 5 5 46.927
2 5 5 5 5 5 5 35.405
3 5 5 5 5 5 5 18.578
4 5 5 5 5 5 5 33.467
5 5 5 5 5 5 5 30.009
6 5 5 5 5 5 5 35.044
7 5 5 5 5 5 5 22.686
8 5 5 5 5 5 5 23.252
5. Conclusions
Various kinds of wavelet pairs were examined to find the nearly optimal PSNR values in the remotely sensed image data compression. The nearly optimal wavelet pairs could be predicted in the level one for the orthogonal wavelet families. These results will be used for the com- pression of air photo mosaic, image encryption, image fusion, noise removal, and so on (Chun et al., 2005; 윤 공현, 2006). There are four conclusions from three ex- periments.
(1) The algorithm which pick the wavelet pairs using db1 wavelet works good for eight remotely sensed images.
(2) For biorthogonal wavelet families the variation of maximum PSNR values was not predictable. The filter length of analysis and synthesis affects differ- ently so that bior2.6 and bior6.2 are totally different.
Therefore heuristic information about wavelet filter works more efficiently.
For daubechies wavelet families, the longer filter length showed higher PSNR values in many cases. But the increasing rate of PSNR values are getting less as
the filter length is getting longer. Even after db8 we could see degrading PSNR values in image 6 Therefore picking the wavelet with moderate filter length such as db8 may be more effective.
For coiflet wavelet families the variation of maximum PSNR values could be predictable. The longer filter length showed higher PSNR values. However the incr- easing rate of PSNR values is getting less as in daubec- hies wavelets. Therefore picking the wavelet with medi- um filter length such as coif4 or coif5 may be enough and efficient.
(3) For biorthogonal families the wavelet pairs showing the maximum PSNR values are different at each le- vel in five out of eight images. It means that it is hard to predict the optimal wavelet pairs from level 1.
For orthogonal families such as daubechies and coiflet wavelet the pattern of wavelet pairs giving the maximum PSNR values is consistent from level 1 to level 3. There- fore the optimal wavelet pairs can be predicted from level 1 for daubechies and coiflet wavelet families. The level one processing can be done as in experiment 1.
(4) For all cases the compression rate can be detected roughly at level 1.
If the PSNR value in level 1 for some wavelet pairs is around 18, then for any other wavelet pairs the value is 10% more or less
Acknowledgement
This research was supported by the Korea Aerospace Research Institute through a grant from the KOMPSAT- 3 system development project.
References
윤공현, 2006, SFR기법을 이용한 영상 융합의 정확도 향상에 관한 연구, 한국GIS학회지, 14(1), pp.85-94.
Anscombe, F. J., 1973, Graphs in statistical analysis, Am-
Park, S. H., 2005, A GIS Vector Data Compression Method Considering Dynamic Updates, The Journal of GIS Association of Korea, 13(4), pp.355-364.
Daubechies, I., 1992, Ten lectures on wavelets, SIAM, Philadelphia.
Gladston, R. S., Revathy, K., and Raju, G., 2008, Study on the choice of wavelet filters for image compression using neural and k-nearest neighbor classifiers, Journal of Wavelet Theory and Applications, Vol.2, No.1, pp.15-30.
Jin, H. S., Yoo, H. Y., Eom, J. Y., Choi, I. S., and Han, D. Y., 2009, Wavelet Pair Noise Removal for Increas- ing the Classification Accuracy of a Remotely Sensed Image, Korean Journal of Remote Sensing, Vol.25, No.3, pp.1-9.
Thomos, N., Boulgouris, N. V., and Strintzis, M. G., 2006, Optimized Transmission of JPEG2000 Streams Over Wireless Channels, IEEE Transactions on Image Pro- cessing, Vol.15, No.1, pp.54-67.
Yoo, H. Y., Lee, K. W., Jin, H. S., and Kwon, B. D., 2008, Selecting Optimal Basis Function with Energy Parameter in Image Classification Based on Wavelet Coefficients, Korean Journal of Remote Sensing, Vol.24, No.5, pp.437-444.
Received (November 9 2009) Revised (December 21 2009) Accepted (December 22, 2009)