537
Expression of caveolin-3 as positive intracellular signaling regulator on the development of hypertrophy in cardiac tissues
Joo-Heon Kim
1, Jin Han
2, Yong-Kwon Kim
3, Young-Ae Yang
3, Yonggeun Hong*
2,31
Institute of Animal Medicine, College of Veterinary Medicine, Gyeongsang National University, Jinju 660-701, Korea
2
Cardiovascular & Metabolic Disease Center, College of Medicine, Inje University, Busan 614-735, Korea
3
College of Biomedical Science and Engineering, Inje University, Gimhae 621-749, Korea (Accepted : November 28, 2005)
Abstract : We have examined distribution and expression of caveolin-3 (cav-3), one of three caveolin isoforms from 16-wks-old spontaneously hypertensive rats (SHR) compared with age-matched control wistar-kyoto (WKY) rats. The expression of cav-3 was increased, whereas expression of PKB/Akt and calcineurin (Cn) was not changed in cardiac tissues of SHR compared to WKY rats. Interestingly, expression of cav-3, PKB/Akt and Cn were decreased in plasma membrane fraction in SHR compared to WKY rats. In H9c2 cardiomyoblast cells treated with phenylephrine (50 µM, 48hr) or isoproterenol (10 µM, 48hr), the expression of cav-3 was markedly enhanced compared to nontreated cells. Upon immunofluorescence analysis, cav-3 was localized in plasma membrane of control H9c2 cells. However phenylephrine or isoproterenol treatment caused translocation of cav-3 to perinuclear region. These results suggest that cav-3 plays as positive regulators in the development of hypertrophy in cardiac tissues of SHR rats.
Key words : calcineurin, caveolin, hypertrophy, SHR, spontaneously hypertensive rat, PKB/Akt,
Introduction
Caveolae were first observed by electron microscopists in the 1950s [25, 39]. They were named as plasmale- mmal vesicles by Palade and, 2 years later, Yamada proposed the name ‘caveolae’ to define these small flask-shaped, 50-100 nm invagination of the plasma membrane [25, 39]. Morphologically, they are abundant in endothelial cells; adipocyte; cardiac, smooth and striated myocytes; and epithelial cells [2, 12, 29].
Caveolin was identified as a principal protein component of caveolae. PKB/Akt least four caveolin gene products are present in mammalians; caveolin-1
α, -2, and -3 [1, 10, 27, 29] and possibly two in Caenorhabditis elegans [34]. Caveolin-1 (cav-1) and - 2 (cav-2) are coexpressed and form a hetero-oligomeric complex [28] in many cell types, with particularly high levels in adipocytes, endothelial cells and muscle cells [12, 29] whereas expression of caveolin-3 (cav-3) is muscle-specific and found in both cardiac and skeletal
muscle, as well as smooth muscle cells. Cav-3 is 65%
identical with and 85% similar to cav-1. The caveolin- 1 gene appears to be the progenitor of the cav-2 and -3 genes [34].
Purification methods using the caveolae marker protein caveolin established new criteria for identifying this membrane. These included (a) resistance to solubilization by Triton X-100 at 4
oC (at low tempe- rature), (b) a light buoyant density [30], and (c) richness in glycosphingolipid (GSLs), cholesterol, and lipid-anchored membrane proteins [8, 11, 37].
Recent study also examined the functional role of caveolins in regulating signaling along the MAPK cascade [6]. Interestingly, the activation of this pathway is usually accompanied with a downregulation of cav-1 gene expression while increase in the level of cav-1 protein strongly inhibits the pathway.
Coexpression with cav-1 dramatically inhibited signaling from EGF-R, Raf, MEK-1, and Erk-2 to the nucleus
in vivo[7].
*Corresponding author: Yonggeun Hong
College of Biomedical Science and Engineering, Inje University, Gimhae 621-749, Korea
[Tel: +82-55-320-3681, Fax: +82-55-329-1678, E-mail: [email protected]]
After various pathologic stresses and in response to increased demands for cardiac work, heart adapts through compensatory hypertrophy of myocytes.
Hypertrophic stimuli induce an increase in cell size in the absence of cell division [19, 38] and are accompanied by a number of qualitative and quantitative changes in gene expression [3]. Cardiac hypertrophy is induced by a variety of factors, such as vasoactive peptides, growth factors, cytokines, and hormones [22].
Specially, catecholamines (phenylephrine, isoproterenol) also play pivotal roles in cellular growth [4]. There are main hypertrophic signaling pathway has been described which involves activation of the Ca
2+/calmodulin- dependent phosphatase calcineurin [21]. Persistent stimulation of cardiac cells by catecholamines, for example, has been known as a prime example of calcineurin-induced cardiac hypertrophy [15].
We used phenylephrine and isoproterenol to study catecholamines-induced hypertrophy in H9c2 cells with specific inhibitors, verapamil and cyclosporin A (CsA).
They are well known as an inhibitor of calcium influx and calcineurin, respectively. We examined the molecules involved in the catecholamines signal, such as adrenergic receptor, G-proteins, adenylate cyclase, PLC, Akt/PKB, Erk, calcineurin, and protein kinase A, which are accumulated in caveolae with caveolin in cardiac hypertrophy. Previously, the direct regulation of G- proteins, adenylate cyclase and protein kinase A by caveolin has also been demonstrated [36]. Thus, we examined the role of caveolins on the progression of cardiac hypertrophy induced by hypertension and on the catecholamines-induced hypertrophy in H9c2 cells.
Materials and Methods
Animals
Animal care of spontaneously hypertensive rat (SHR), Wistar Kyoto rat (WKY) strain, were followed as described previously [14]. They were starved overnight and anesthetized by intraperitoneal adminis- tration of 100 µg of sodium pentobarbital per g of body weight at 10 to 15 min before the experiments. At 8- wk-old-age, systolic blood pressure of SHR and their control WKY rats were measured using tail cuff plethysmography as described previously [26].
Immunoblotting, immunofluorescence microscopy H9c2 cells were cultured in DMEM medium
containing 10% fetal bovine serum. Cultivated cells and tissue from rat heart were lysed in RIPA buffer [40], and proteins were subjected to SDS-PAGE on 12% gels [14]. All of the antibodies (all 1 : 2500 dilution) used were cav-3, calcineurin, PKB/Akt from Transduction Lab (USA). For immunofluorescence staining, cells were fixed 4% paraformaldehyde and permeabilized with 0.1% Triton X-100, washed three times (PBS containing 0.01% Triton X-100 and 10%
FBS), followed by incubation with anti-mouse cav-3.
A 1 : 100 dilution of TRITC (Molecular Probes, USA) secondary antibody was used. Images were captured using a immunofluorescence microscope (Olympus, Japan).
Immunohistochemistry
Immunohistochemical detection of cav-3 was performed as described previously [11, 13]. Briefly, prepared left ventricular myocardium from 16-wks-old WKY and SHR rats were fixed using 4% paraformal- dehyde and incubated with monoclonal anti-caveolin- 3 primary antibody (1 : 500) diluted in phosphate- buffered saline containing 1 mg/ml bovine serum albumin for 2 hr, rinsed with the same solution for 30 min, and incubated with biotinylated goat anti-mouse IgG (1 : 200) for 60 min. The samples were then exposed to avidin-biotin-peroxidase complex method (Vectastain ABC kit; Vector, USA) and reacted with DAB according to the manufacturers recommendations and counterstained with hematoxylin.
Caveolin-enriched membrane fractionation Hearts from SHR and WKY rats were harvested, minced with a razor blade, and homogenized for 30 sec using a Polytron tissue grinder in 2 ml of MES- buffered saline with 1% (v/v) Triton X-100, at 4
oC.
Samples were centrifuged (1,000×g, 5 min, 4
oC), and
the supernatant was adjusted to 40% sucrose by the
addition of 2 ml of 80% sucrose in MES-buffered
saline. A 5-35% continuous sucrose gradient was
formed above the homogenate and centrifuged at
39,000 rpm for 16 hr in a SW41 rotor (Beckman
Instruments, USA). A light-scattering band in the 15-
20% sucrose region was observed. Twelve 1-ml
fractions were collected, starting from the top of the
gradient. For SDS-PAGE/Immunoblotting, an equal
amount of total protein from each fraction (25 µg) was
analyzed.
Results
Expression of caveolin-3 in left ventricular myocardium from 16-wks-old WKY and SHR rats From our results, the fundamental orientation of hypertension in genetically hypertensive SHR rats showed a cardiac hypertrophy concomitant with enlargement of heart size (data not shown), thicken cardiac wall (data not shown), and cav-3 overexpression (Fig. 1B) in whole cell level. In order to investigate that the differential expression of cav-3 in the left ventricular (LV) myocardium of hearts from 16-wks- old WKY and SHR rats, immmunohistochemistry analysis was directly performed with the isolated LV myocardium. As shown in Fig. 1, cav-3 expression was significantly increased in the myocardium of SHR (Fig.
1B) compare to in that of WKY rats (Fig. 1A).
However, prominent staining of cav-3 in the sarcolemma (muscle plasma membrane) and intercalated disc (arrows in Fig. 1A) observed in WKY rats, become throughout the cytosol of cells with strong signals visible in the cytosol of SHR rats (Fig. 1B).
Thus we suggest that the overexpression in whole cell level but the retardation in translocation of cav-3 to PM from cytosol (as shown in Fig. 1B) is related to the hypertrophy which was observed in the hypertensive SHR rats.
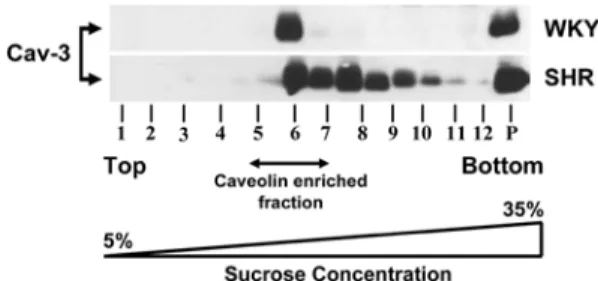
Expression and localization of caveolin 3 at caveolin-enriched fraction in cardiac tissues of WKY and SHR rats
In cardiac tissues of 16-wks-old WKY and SHR rats, the expression of cav-3 was investigated. In a whole tissue lysate, the amount of cav-3 expression in
hypertensive SHR was higher than in normotensive WKY (by 5-fold at 16 weeks, n = 3) (Fig. 2). In contrast, cav-1 expression was similar between 16-wks- old in WKY and SHR rats (data not shown). Thus, cav- 3 expression, but not cav-1, was altered in hypertensive SHR with cardiac hypertrophy (Fig. 2). Finally, our data render was to speculate that the increased expression of cav-3 may play a role in the accelerated development of cardiac hypertrophy in the hypertensive SHR rats.
Localization of caveolin-3 upon agonist induced hypertrophy in H9c2 cardiomyoblast cells
We demonstrated that the expression of cav-3 was decreased in plasma membrane (PM) fraction, more specifically in caveolae of hypertensive SHR compared Fig. 1. Immunohistochemical analysis of caveolin-3 expre-
ssion in left ventricular myocardium from 16-wks-old WKY and SHR rats. Prominent staining of caveolin-3 in the sarcolemma and intercalated disc was observed in WKY rats (A) compared to SHR rats (B).
×400.
Fig. 2. Localization of caveolin-3 from caveolin-enriched membrane fraction of cardiac tissues from 16-wks-old WKY and SHR rats.
Fig. 3. Localization of caveolin-3 in caveolin-enriched membrane fraction from control (A) and phenylephrine (PE, 50
µM, 48 hr) induced hypertrophy in H9c2 cardiomyoblast cells (B). Cell lysates prepared from H9c2 cardiomyoblast cells were fractionated as shown in Fig.
2 and subjected to immunoblot analysis with caveolin-3
antibody.
to WKY rats (Fig. 2). Upon agonist-induced hypertrophy in H9c2 cell, the expression cav-3 was markedly enhanced (Fig. 3). After the induction of hypertrophy by phenylphrine (50 µM, 48 hr) treatment, a marked decrease of the cav-3 translocation to plasma membrane was observed with a increased expression of cav-3 in cytosolic fraction (data not shown). At experiment to determine trafficking of cav-3 from cytoplasm to plasma membrane, the results strongly indicate that the agonists (phenylephrine or isoproterenol) induced hypertrophy cause the impairment in translocation of cav-3 to plasma membrane from cytosolic cellular compartment.
Expression of caveolin-3 and hypertrophy-related signaling molecules in agonist-induced hypertrophic H9c2 cardiomyoblast cells
It is well established that GPCR ligands such as phenylephrine (PE) [35] or isoproterenol (ISO) [41] are capable of inducing cardiomyocyte hypertrophy through the activation of wide array of intracellular signaling pathway. Thus, we studied the role of cav- 3 in the development of hypertrophy induced by the hypertrophic agonists, PE (50 µM, 48 hr) or ISO (10 µM, 48 hr) [9, 41] in cultured H9c2 cells. In the H9c2 cells treated with PE (50 µM) or ISO (10 µM) alone, the expression of cav-3 and calcineurin were markedly enhanced (Fig. 4. lane 2 and 5 compared to no treatment (control) of Lane 1). Also, expression of PKB/Akt was markedly increased by the treatment of PE (50 µM) (lane 2) but the expression was decreased in the ISO alone treated cells (lane 5).
Recent studies reported that treatment of verapamil (L-type Ca
2+channel antagonist), or cyclosporin A (CsA) (calcineurin inhibitor), could prevent cardiomyocyte hypertrophy induced by PE or ISO treatment (Fig. 4) [21] and could prevent cardiac hypertrophy in various rodent models of heart disease [31]. Thus, we examined the effects of verapamil or CsA on the expression of cav-3 and calcineurin in the agonist induced hypertrophic H9c2 cells. In the presence of verapamil, the expression of both cav-3 and calcineurin in hypertrophic H9c2 cells was markedly reduced (lane 3 and 6). However, in the presence of CsA both PE and ISO treated cells, only calcineurin expression was greatly reduced (become basal (control) level) (lane 4 and 7) compared to hypertrophic H9c2 cells induced
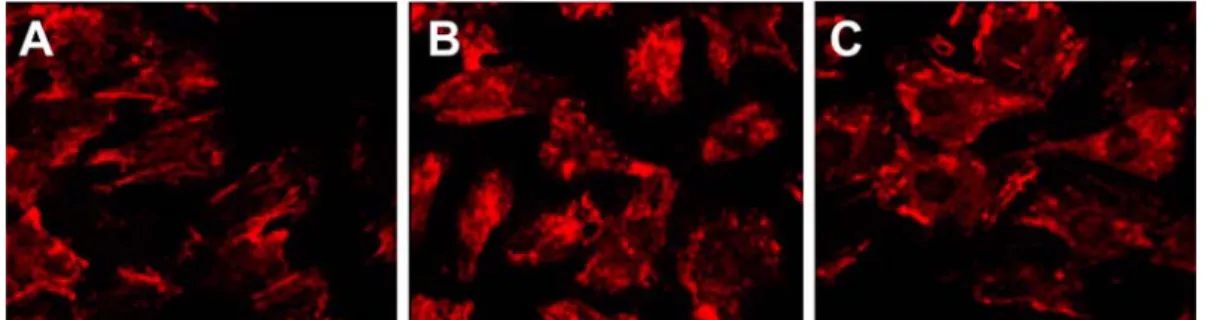
Fig. 5. Fluorescent microscopic analysis of caveolin-3 translocation upon agonist induced hypertrophy in H9c2 cardiomyoblast cells. Cells were plated onto chamber slides and treated with phenylephrine (PE, 50
µM) or isoproterenol (ISO, 10
µM) for 48 hr. The cells were then stained with TRITC labeled caveolin-3 and viewed by immunofluorescence microscopy. (A) Control. (B) PE induced hypertrophic cells. (C) ISO induced hypertrophic cells.
×200.
Fig. 4. Expression of caveolin-3 and hypertrophy-related signaling molecules in agonist induced hypertrophic H9c2 cardiomyoblast cells. Cells were treated with phenylephrine (PE, 50
µM), isoproterenol (ISO, 10
µM), Verapamil (1
µ