Journal of the Korea Institute of Building Construction, Vol. 13, No. 2
http://dx.doi.org/10.5345/JKIBC.2013.13.2.159 www.jkibc.org
Development of Expertise-based Safety Performance Evaluation Model
Yoo, Wi Sung
1Lee, Ung-Kyun
2*1)Construction Management Division, Construction & Economy Research Institute of Korea, Gangnam-gu, Seoul 135-701, Korea
1Division of Architecture, Department of Architectural Engineering, Kwandong University, 24 579bungil Bumil-load, Gangneung-si, Gangwon-do 210-701, Korea
2Abstract
Construction projects have become increasingly complex in recent years, resulting in substantial safety hazards and frequent fall accidents. In an attempt to prevent fall accidents, various safety management systems have been developed. These systems have mainly been evaluated qualitatively and subjectively by practitioners or supervisors, and there are few tools that can be used to quantitatively evaluate the performance of safety management systems. We propose an expertise-based safety performance evaluation model (EXSPEM), which integrates a fuzzy approach-based analytic hierarchy process and a regression approach. The proposed model uses S-shaped curves to represent the degree of contribution by subjective expertise and is verified by a genetic algorithm. To illustrate its practical application, EXSPEM was applied to evaluate the safety performance of a newly developed real-time mobile detector monitoring system. It is expected that this model will be a helpful tool for systematically evaluating the application of a robust safety control and management system in a complex construction environment.
Keywords : expertise-based safety performance evaluation model, fall accidents, safety control and management system
1. Introduction
The quantitative assessment of safety performance is likely to be unsuccessful because of the diverse features of construction activities involved in a project and the lack of consistently accumulated historical data. Furthermore, it is more likely for a safety performance evaluator to be biased against making numerical estimates because more mental effort is required to estimate numerical values than to offer verbal estimates or statements[1]. For this reason, there has been a great deal of interest in removing the biased subjectivity of experts and on achieving a
Received : November 20, 2012 Revision received : December 11, 2012 Accepted : December 24, 2012
* Corresponding author : Lee, Ung-Kyun
[Tel: 82-10-3382-1007, E-mail: [email protected]]
ⓒ2013 The Korea Institute of Building Construction, All rights reserved.
transformation to an objective means of evaluating the safety performance of new safety control technologies.
An effective way to cope with such a challenge is to measure the degree of uncertainty in qualitative and subjective information. The magnitude of uncertainty can be estimated and measured using the fuzzy set theory[2] introduced in 1965 by Zadeh as a mathematical theory of vagueness[3].
This theory helps transform a linguistic model of a person ’s subjective judgment into an algorithm that emphasizes the ability to extract information from massive amounts of imprecise data. The fuzzy set theory also makes it easier to explain qualitative and subjective judgments[4].
To secure the safety of workers at a
construction site, Dėjus[5] has emphasized the
simplicity and applicability of a method to reliably
evaluate the technologies or systems applied to a
Development of Expertise-based Safety Performance Evaluation Model
safety control program. Currently, there is a paucity of practical data and information to support a traditional tool for evaluating a newly developed safety management system. Furthermore, such a system is mainly evaluated by the qualitative and subjective judgments of practitioners, supervisors, engineers, or other individuals who are responsible for safety control and management during construction projects.
To address these issues, this study introduced an expertise-based safety performance evaluation model (EXSPEM), which uses fuzzy modeling for the expertise-based aggregation of subjective information and to assist decision makers in the evaluation of a newly developed safety real-time monitoring system. The model was constructed by integrating a fuzzy approach-based analytic hierarchy process (AHP) and regression approach, and uses fuzzy modeling techniques for extracting experts ’ knowledge on uncertain information. It also employed a fuzzy-weighted average method for aggregation of subjective expertise, assuming that the expert ’s experience would affect safety performance evaluation. The model is expected to be one of tools that will help safety managers design more effective safety control plans and strategies by providing reliable evaluations of the applicability of newly developed technologies.
2. EXSPEM
2.1 Fuzzification of linguistic terms or fuzzy values Fuzzy modeling has been widely applied in solving problems in which the descriptions of observations are too imprecise, vague, and uncertain to reach a reliable decision[6]. This modeling was developed specifically to deal with uncertainties that are not statistical in nature.
Fuzzy operations allow the arithmetic combination
of fuzzy numbers[7,8]. In evaluating a safety monitoring system, an evaluator ’s judgments obtained through questionnaire surveys can be frequently used linguistic terms (words or idioms) or fuzzy values that are effectively represented by fuzzy numbers. In this study, the various linguistic and fuzzy values are referred to the standard performance scales of Hadipriono ’s model[9], which consist of 11 linguistic values.
2.2 Weights of safety performance evaluation criteria EXSPEM uses an experience-based learning curve with a mathematical function to reflect the contribution of the subjectivities into a decision variable. This curve is helpful in evaluating the performance of a system with ambiguous subjectivities caused by the uncertainty and vagueness of the subjective perception in evaluation procedures[10]. The weights of criteria for evaluating safety performance are estimated from a fuzzy pairwise comparison matrix ( Ᾱ ) in the application of the fuzzy AHP.
ú ú ú ú ú
û ù
ê ê ê ê ê
ë é
=
nn n2
n1
2n 22
21
1n 12
11
r r
r
r r
r
r r
r A
L M O M M
L L
, where r ii = 1 and r ij = 1/ r ji
In the above matrix, the n and r ij parameters indicate the number of criteria to be evaluated and the relative importance of the i th criterion according to the j th criterion, respectively. Based on the modification of Chen ’s definition[11], five linguistic terms, “very unimportant,” “less important,”
“equally important,” “more important,” and “very
important ” ranging from 0 to 10 were used to
develop the entries in such a matrix with a few
fuzzy numbers, (0, 0, 1, 2), (1, 2.5, 4), (3, 5, 7),
(6, 7.5, 9), and (8, 9, 10, 10), respectively. Of
these linguistic variables, fuzzy numbers
representing “very unimportant” and “very
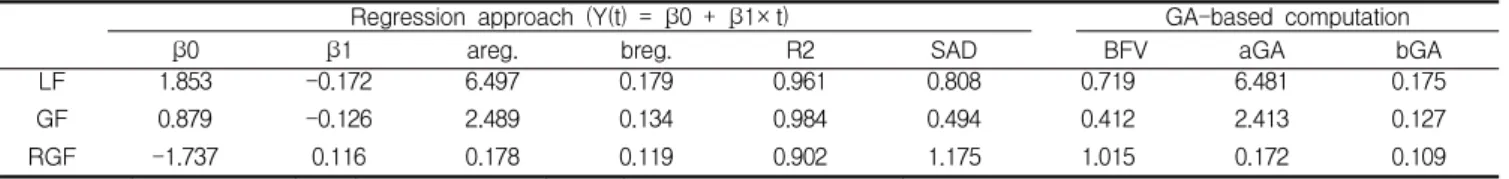
Regression approach (Y(t) = β0 + β1 ´ t) GA-based computation
β 0 β 1 areg. breg. R2 SAD BFV aGA bGA
LF 1.853 -0.172 6.497 0.179 0.961 0.808 0.719 6.481 0.175
GF 0.879 -0.126 2.489 0.134 0.984 0.494 0.412 2.413 0.127
RGF -1.737 0.116 0.178 0.119 0.902 1.175 1.015 0.172 0.109
* Note: LF(logistic function); GF(gompertz function); RGF(reverse-gompertz function)
Table 1. Analysis of experience-based allocation of contribution
functions (MFs), and the others are characterized by symmetric triangular MFs. In this matrix, Buckley[12] proposed that an element of negative judgment be treated as an inverse, and he reversed the order of the fuzzy number for the corresponding positive judgment. For this reason, careful review is required to avoid errors that may arise from such tedious manipulations while constructing a reciprocal matrix.
2.3 Experience-based allocation of contribution by subjective expertise
Levels of experience and expertise may differ, so a differentiated allocation curve of contribution by subjective expertise was developed using the mathematical functions derived from S-shaped growth curves. The curves reflect changes in the evaluator ’s expertise with increased experience, and are represented by a mathematical equation describing the relationship between experience and the contribution of subjectivity to a decision problem.
In this study, three types of S-shaped curves were used in the development of the experience-based allocation curve of contribution by subjective expertise. The gompertz function (GF) models a steep initial increase, and its increment rate decreases over the experience period.
Conversely, the reverse-gompertz function (RGF) represents the opposite behavior. However, the logistic function (LF) describes a gradual increase and decrease in the learning rate with acquired expertise. The equations of these curves are
GF: y(t) = S ´ exp[- a ´ exp(- b ´ t )] --- (1) LF: y(t) = S/[1+ a ´ exp(- b ´ t )] --- (2) RGF: y(t) = S ´ [1-exp(- a ´ exp(- b ´ t ))] --- (3)
In the above curves, a is a shift parameter and a constant of integration that shifts the curve along the time axis, b represents the rate of increase in the level of expertise, and S is the upper asymptote indicating the highest degree of contribution. The values of these parameters were computed using the regression approach because the S-shaped curves are linearized by mathematical manipulations with the natural logarithms.
Instantly, in the linearization of the LF, the terms ln ( ln ( y(t) ), ln (- a ), and - b are replaced with Y(t) , β 0 , and β 1 , respectively, which are estimated as presented in Table 1.
The change in degree of contribution by
subjective expertise over a period of time was
surveyed using 24 practitioners with between 1 and
30 years safety management and control experience
as safety managers, field supervisors, and technical
engineers. The averages of the collected data
against the number of years of experience are
plotted in Figure 1. After obtaining the fitted curve
by the regression approach, a genetic algorithm
(GA) was applied to verify the values of the
parameters ( a and b ). A GA is widely known as a
powerful tool for parameter optimization with a
known fitness function[13,14].
Development of Expertise-based Safety Performance Evaluation Model
0 0.5 1 1.5 2 2.5 3 3.5 4 4.5 5
0 10 20 30 40 50 60 70 80 90 100
RGF LF GF
0.0 0.1 0.2 0.3 0.4 0.5 0.6 0.7 0.8 0.9 1.0
0 1 2 3 4 5 6 7 8 9 10 11 12 13 14 15 16 17 18 19 20 21 22 23 24 25 26 27 28 29 30
(t) y
Reg.(t) y
GA.Figure 1. Contribution allocation curves and best fitness values
For application of the GA, the best fitness function (BFF) is derived from the sum of absolute difference (SAD) shown in Eq. [4] below, and determines the best fitness value (BFV).
÷ ÷ ø ö ç ç
è
= æ
=
∑
30-
1 t
actual
(t) y (t) y Min
BFF --- (4)
In Eq. [4], t indicates an experience period, and ȳ(t) is the fitted contribution of expertise from t years of experience. Table 1 presents the parameter values, the R 2 values resulting from the regression approach, and the BFVs derived from the GA-based computation. Even if the R 2 of the GF was 0.98, which commonly explains appropriate fitness, the operation of the GA provided a more reliable fitted curve than the SAD computed by the regression approach. As shown in Table 1 and Figure 1, a contribution curve (GF) to allocate experience-based expertise was developed with the parameter values ( a GA = 2.413 and b GA = 0.127) determined by the GA operation. This GF is used for aggregation of the subjective expertise in evaluating a newly developed safety monitoring system for preventing fall accidents.
2.4 Fuzzy aggregated values
The fuzzy numbers to be aggregated with the derived experience-based allocation curve of contribution were converted from linguistic values.
An element value ( r ij ) in the fuzzy pairwise comparison matrix ( Ᾱ ) can be concretized by a trapezoidal fuzzy number represented by ( a ij , b ij , c ij , d ij ), which can be aggregated with the allocated value of the contributions by n evaluators ’ opinions in comparing each pair criteria, ranging between 0 and 1. The aggregated element value (ȓ) can be calculated by the fuzzy multiplication and addition operators as shown in Eq. [5].
) e (r ) e (r ) e (r
r
ij=
ij1´
1+
ij2´
2+ L
ijn´
nˆ ---- (5)
In Eq. [5], e k indicates the degree of reliability of the k th evaluator ’s opinion, which is based on the allocated degree of contribution by experience, e 1 + e 2 + … + e n = 1. The term r k ij is a trapezoidal fuzzy number representing the opinion of the k th evaluator in comparing criterion i with j . Using Eq.
[5], ȓ is represented by a trapezoidal number ( a ʹ ij ,
b ʹ ij , c ʹ ij , d ʹ ij ), which can be transformed into a
triangular number ( a ʹ ij , b ʹ ij = c ʹ ij , d ʹ ij ). Eq. [6] was
matching crisp values c ij that can adequately represent the evaluators ’ preference.
6 d ) c b 2(
c
ija
ij¢ +
ij¢ +
ij¢ +
ij¢
= , c ii = 1 and c ij = 1/ c ji - (6)
Consequently, all the aggregated fuzzy scales, ȓ ij , were transferred into crisp scales within the range of [0, 10]. In calculating the weight of the criteria at each hierarchical level of the expected safety performance evaluation items, c ij was used as the value representing a quantified judgment on criterion i compared with criterion j . For example, the weight of each criterion at level 1 can be calculated using three sub-criteria, as shown in Eq. [7].
÷
÷
÷
÷
÷
ø ö
ç ç ç ç ç
è æ
= å
å
=
= 3
1 j
3
1 k
kj ij 1
level at i criterion
c c 3
w 1
3 , 2 , 1 , = j
i -- (7)
2.5 Computation of the performance index (PI) The PI was computed in this study to explain the overall safety performance of the system. The fuzzy number used in evaluating each expected performance item was derived by converting the linguistic values obtained from several evaluators into the standard performance model. This number is represented by a triangular fuzzy number, Tri(a PS , b PS , c PS ) , in which three components are computed by multiplying the allocated value of the contribution by the subjective expertise ( y iS ) with t years of experience and the opinion ( a iS ) of the i th evaluator for the S th expected performance item. In other words, they are produced using Eqs. [8], [9], and [10].
å
=1
i
--- (8)
å
=
´
=
n
1 i
iS iS
PS
y b
b --- (9)
å
=
´
=
n
1 i
iS iS
PS y c
c --- (10)
Here, Tri(a iS , b iS , c iS ) indicates the triangular fuzzy number converted from the linguistic value of the i th evaluator. With this number, the MF of the PI is determined by the weight ( w PS ) of the S th expected performance item, as described below.
÷ ÷
÷
÷
÷
÷
÷
÷
÷
÷
ø ö
ç ç ç ç ç ç ç ç ç ç
è æ
÷ ´
÷ ø ö ç ç
è æ
´
÷ ´
÷ ø ö ç ç
è æ
´
÷ ´
÷ ø ö ç ç
è
æ ´
=
= =
= =
= =
PS 14
1 S
n
1 i
iS iS
PS 14
1 S
n
1 i
iS iS
PS 14
1 S
n
1 i
iS iS
f f f
w c y
, w b y
, w a y
Tri ) c , b , (a Tri
∑ ∑
∑ ∑
∑ ∑
--- (11)
In Eq. [11], a f , b f , and c f were calculated using the principles of multiplication and addition of fuzzy numbers. Tri(a f , b f , c f ) can be converted into a real number output using Eq. [12], which was derived using the center of area (COA) method to determine the center of gravity of the area under the MF. The COA method is widely known as the most common defuzzification method[15]. In Eq.
[12], x i is the output variable indicating the system performance score, and f(x i ) represents the aggregated MF.
∑
∑
n
1 i
i n
1 i
i i
ECA
) f(x
) f(x x PI
=
=
´
=
, i = 1 , 2 , L , n --- (12)
Development of Expertise-based Safety Performance Evaluation Model
A Safety Manager Group Mobile Sensing
Device
Radio Frequency
Repeater
Safety Management Software in Site Office
Safety Control Actions Transmitter
Speaker Main
board Battery
Antenna
Infrared Sensor
Ultrasonic Sensor
Figure 2. Configuration of a real-time safety monitoring system
Table 2. Expected safety performance items of the monitoring system
Categories Expected safety performance items
Direct improvement in safety performance (C1)
P1: Precaution preparation
P2: Prompt response to a construction or site manager P3: Mental and external reliability
Complement to insufficient precautions (C2)
P4: Supplementation when there is insufficient training P5: Continuous safety control and management P6: Prevention of inappropriate worker movements
Elimination of causes of latent hazards (C3)
P7: Reduction in accidents due to lack of understanding constr. process P8: Eliminate unforeseen worker behavior through oppressive enforcement of safety policy
P9: Hazards due to lack of safety equipment
P10: Protection from unsafe construction methods or sequences P11: Controlling hazardous site conditions
P12: Reduction in accidents resulting from not wearing safety equipment P13: Improving worker attitudes regarding safety consciousness
P14: Prevention of accidents resulting from isolated, sudden deviation from prescribed behaviors
3. An illustrative application
3.1 A real-time safety monitoring system
In this study, EXSPEM was applied in a safety monitoring system[16] as an illustrative case to explain its practical use in a construction project.
The newly developed equipment for construction safety consisted of three parts: a mobile sensing device with hybrid sensors; a radio frequency repeater, which was a wireless sensor network
device, and safety management software. This system is also operated in sequential phases, such as acquiring data automatically, transmitting data, identifying the situation, and managing worker safety, as shown in Figure 2.
The safety performance evaluation items acquired
by surveying 24 practitioners with sufficient safety
management and control experience are categorized
with 14 elements, as presented in Table 2. These
categories were: 1) direct improvement in safety
precautions, and 3) elimination of causes of latent hazards. A questionnaire survey was conducted to evaluate the safety performance of a newly developed technology aimed at preventing accidents, on the assumption that evaluators possess sufficient information regarding the application of the technology.
3.2 Output explanation
After weighting the expected safety performance evaluation items using 24 practitioners, a questionnaire survey was conducted to evaluate an illustrative real-time safety monitoring system.
Fifty-two qualified practitioners with job experience related to safety control and management in construction projects participated in the survey.
Table 3 presents the experience and occupational areas of the survey participants.
Table 3. Experience and occupational areas of the survey participants
Experience
(years) Frequency Occupational
areas Percentage
(%)
1–3 8 Construction
(Site) 67
4–7 10
8–11 10 Construction
(Head office) 15
12–15 8
16–19 5 Academic world 11
20–23 7
24–27 3 Others 7
28–30 1
A fitted experience-based allocation curve of contribution by subjective expertise related to fall accidents was derived from the regression approach and GA using Eq. [4]. The values of parameters a and b were determined as 2.413( a GA ) and 0.127( b GA ), respectively. The BFV for optimizing this curve was computed by the GA and was 0.412.
This value was very close to the SAD resulting from the regression approach, which was acceptable in this study. With a BFV of 0.412, the crossover and mutation parameters of the GA were set at 0.7
parameters in the LF, GF, and RGF, and their SAD values were determined to be 0.808, 0.494, and 1.175, respectively. The GF was found to be the best-fitted function ( ȳ(t) ) reflecting the contribution of subjective opinions. In Figure 1, this fitted curve was compared with the average of the surveyed data.
Categories Performance Partial
weight Final weight Direct improvement in
safety performance (C1)
P1 0.126 0.019
P2 0.223 0.033
P3 0.651 0.096
Sub-sum 1 0.148
Complement to insufficient precautions
(C2)
P4 0.124 0.035
P5 0.207 0.058
P6 0.670 0.187
Sub-sum 1 0.279
Elimination of causes of latent hazards
(C3)
P7 0.038 0.022
P8 0.036 0.021
P9 0.049 0.028
P10 0.127 0.073
P11 0.110 0.063
P12 0.125 0.072
P13 0.233 0.134
P14 0.281 0.161
Sub-sum 1 0.573
Table 4. Weights of expected safety performance items
Table 4 shows the weights of the categorized and
expected performance items, which were computed
using Eqs. [5], [6], and [7]. The results indicated
that the system had significant safety performance
enhancements in the categories of “Prevention of
inappropriate worker movements (P6), ” “Improving
worker attitude toward safety consciousness (P13), ”
and “Prevention of accidents due to isolated, sudden
deviation from prescribed behaviors (P14). ” The
weights were 0.187, 0.134, and 0.161, respectively,
constituting 48.2% of the entire weight. Six of the
52 responses were rejected because of incomplete
information, and the 46 valid responses were
analyzed using EXSPEM. Each expected safety
performance item was evaluated in linguistic terms,
which were converted to fuzzy numbers using the
standard performance values. The contribution by
Development of Expertise-based Safety Performance Evaluation Model
subjective expertise was allocated and reflected in fuzzy operations, with the assumption that experience could bias subjectivity and degrade the reliability.
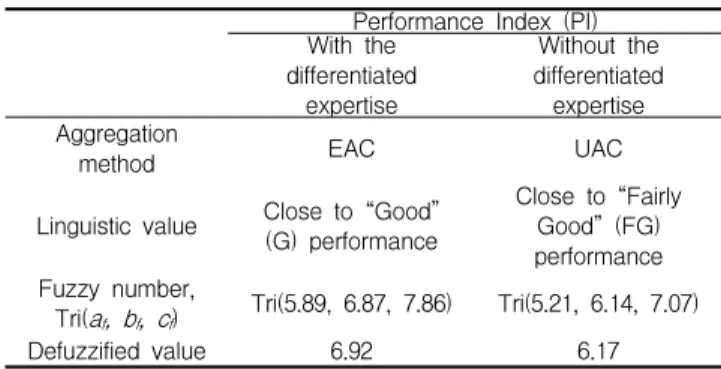
The MF of the PI resulting in experience-based allocation of contribution (PI EAC ) is derived from Eq.
[8] and shown in Figure 3, and can be defuzzified using Eq. [9] to quantify the overall performance level as a crisp value. The PI EAC value was compared with the MF of the PI based on the uniform allocation of contribution (PI UAC ), which was estimated regardless of the evaluators ’ experience assuming that there was no information available regarding the contribution by subjective expertise.
As shown in Table 5, the MF of the PI EAC
consisted of three components, 5.89, 6.87, and 7.86, and was converted to 6.92 in a real number output ranging from 0 to 10, indicating that the safety performance was evaluated to be between FG and G, closer to a “good performance” index. On the other hand, the MF of the PI UAC was 5.21, 6.14, and 7.07, indicating that the safety performance evaluation under a uniformly assigned contribution to each evaluator was underestimated.
This contradicts the assumption that the subjective expertise of an evaluator with substantial experience can affect the reliability of the safety performance evaluation.
Figure 3. MFs of PI
EACand P
IUACPerformance Index (PI) With the
differentiated expertise
Without the differentiated
expertise Aggregation
method EAC UAC
Linguistic value Close to “Good”
(G) performance
Close to “Fairly Good” (FG) performance Fuzzy number,
Tri(a
f, b
f, c
f) Tri(5.89, 6.87, 7.86) Tri(5.21, 6.14, 7.07)
Defuzzified value 6.92 6.17
Table 5. Comparison of PI values
To compare the MF of the PI based on the random allocation of contribution (PI RAC ) with the PI ECA , a degree of contribution was randomly generated in the range from 0 to 1, and the PI RAC value was calculated using the Monte Carlo technique. Figure 4 shows the probability distribution of PI RAC over 3000 random simulations. The mean was approximately 6.22, close to the value of the PIUAC. Therefore, it could be stated that EXSPEM is appropriate for the safety performance evaluation of the system.
0 0.005 0.01 0.015 0.02 0.025 0.03 0.035 0.04 0.045
5.5 5.565 5.63 5.695 5.76 5.825 5.89 5.955 6.02 6.085 6.15 6.215 6.28 6.345 6.41 6.475 6.54 6.605 6.67 6.735 6.8 6.865 6.93 6.995