pISSN 1598-2033 eISSN 2233-5706 Journal of the Korea Institute of Building Construction, Vol. 13, No. 4
http://dx.doi.org/10.5345/JKIBC.2013.13.4.416
www.jkibc.org
Performance assessment model for robot‐based automated construction systems
Lee, Ung-Kyun1* Yoo, Wi Sung2 An, Sung-Hoon3 Doh, Nakju4 Cho, Hunhee5 Jun, Changhyun4 Kim, Taehoon 5 Lee, Young Hoon 61)
Division of Architecture, Kwandong University, Gangneung-si, Gangwon-do 210-701, Korea 1 Construction and Economy Research Institute of Korea, Seoul, Korea 2
Department of Architectural Engineering, Daegu University, Gyeongsan, Gyeongbuk, Korea 3 School of Electrical Engineering, Korea University, Seoul, Korea 4
Department of Civil, Environmental and Architectural Engineering, Korea University, Seoul, Korea 5 Department of Electrical Engineering, University of Southern California, Los Angeles, California 90089, USA 6
Abstract
An adjusted assessment model based on benefit–cost analysis (BCA) is proposed for evaluating the economic efficiency of automated construction technologies. In contrast to conventional BCA, the model does not compare monetary values, but the differences in benefits and costs between traditional and automated construction methods. To verify the usefulness of the model, it was applied to a real-scale building construction project that used a fully automated building construction system, and the face validity of the model was confirmed. The results indicate that the model can support decision makers in identifying valuable benefit factors and in assessing the cost effectiveness of the system.
Keywords : assessment model, benefit-cost analysis, automated construction system
1. Introduction
Many studies have attempted to integrate robotic technologies with construction technologies to solve the industry-wide problems of increasing costs, declining productivity, skilled-labor shortages, safety, and quality control[1]. Although automated systems may improve productivity in the construction industry by substituting robots for humans, they have not been widely applied[2]
because there are few methods of assessing such systems effectively.
Received :
Revision received : Accepted :
* Corresponding author : Ung-Kyun Lee [Tel: +82-33-649-7548, E-mail: [email protected]]
©2013 The Korea Institute of Building Construction, All rights reserved.
Previous studies have conducted partial performance assessments of technologies. Lee et al.[3] developed a machine-vision-assisted teleoperated pavement crack sealer, and evaluated its productivity only. Ham et al.[4] developed road-stripe-removing equipment to save on labor and prevent traffic accidents. This equipment was evaluated with respect to productivity improvement, quality, and safety. Woo et al.[5]
developed a robotic system for road-lane painting and evaluated the performance and capacity of the robot, focusing on quality. In these studies, the evaluated performance measures concentrated on the successful development of the system.
However, most stakeholders are interested not only
in successful development but also in the cost
effectiveness of the system when it is applied on a
job site. Thus, an additional approach is required
that shows the overall effectiveness of a system.
Benefit–cost analysis (BCA) has been used to evaluate the efficiency of new technologies in the construction industry. Li and Madanu[6] proposed an uncertainty-based methodology for a highway project-level life-cycle BCA that handled certainty, risk, and the uncertainty inherent in the input factors of the computation. Application of this methodology required the collection of a large amount of data. Zhou et al.[7] conducted a study to assess the effects of access control near freeway interchange areas; their study evaluated the safety, operation, and fiscal benefit of purchasing an additional limited-access right-of-way at an interchange area, and they used the accumulated cost data to compute the benefits and costs. Jang and Skibniewski[8] performed a BCA in terms of labor productivity for an embedded sensor system for construction material tracking by using scenario-based simulation based on information collected from interviews with experts. In addition, Shin et al.[9] used BCA as a decision support tool to select the slab formwork system for high-rise building construction. They evaluated benefit and cost factors, duration, the cost of construction, quality, and safety of each alternative, based on a survey of an expert group from the construction field.
Benefit factors such as the quality and safety of each alternative were used in the above applications of BCA to estimate appropriate costs based on the experience of the decision maker or historical cost data. But it is not easy to apply conventional BCA to assess the performance of automated construction technologies. To implement BCA to evaluate a new system or method, the benefits need to be converted to money. However, there is currently a paucity of the data that would enable this to be accomplished. Thus, if the decision-making process for evaluating the
automated construction method is revised to be a decision based on differences in benefits and costs, instead of a decision based on monetary value, it would be helpful for a decision maker or a practitioner to understand the effectiveness of a system in terms of simple figures. Therefore, we propose an adjusted BCA model to evaluate the application of an automated construction system.
To identify the usefulness of the model, it is applied to a real-scale automated construction system that has been recently completed as a huge research project in South Korea. The model is also verified using face validity.
2. Framework of assessment model
2.1 Benefit index
The benefit index (BI) quantifies the benefit in terms of the difference between the traditional and automated construction methods. It is defined in Eq.[1] and is the sum of the degrees of each benefit factor. Each benefit factor has a different value depending on its importance. Thus,
--(1)
where n is the number of subtechnologies in the system and m is the number of benefit factors. W is a matrix giving the weight of each factor and is calculated by the analytic hierarchy process (AHP);
S is the score matrix for each subtechnology. The
elements t11, t22, …, tnn are the BIs of
subtechnologies 1, 2, …, n, respectively.
Performance assessment model for robot‐based automated construction systems
The benefit factors are developed using the Delphi method, which was originally developed as a systematic interactive forecasting method; this method relies on a panel of experts[10]. The weights of the benefit factors are assigned using the AHP[11].
2.2 Cost index
The cost index (CI) is the ratio of the traditional construction costs, represented by CT, to the automated construction costs, represented by CA.
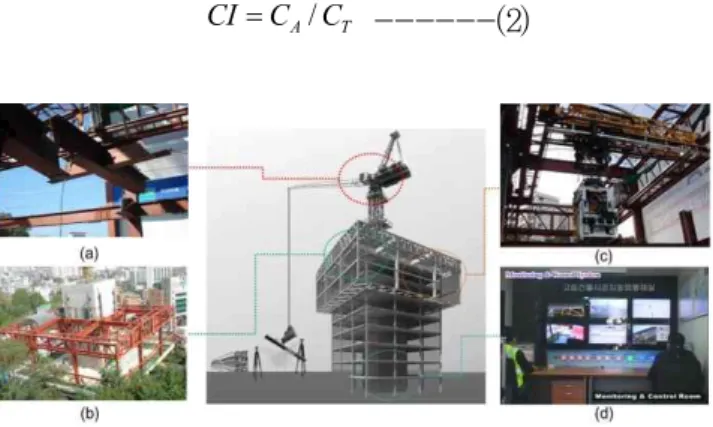
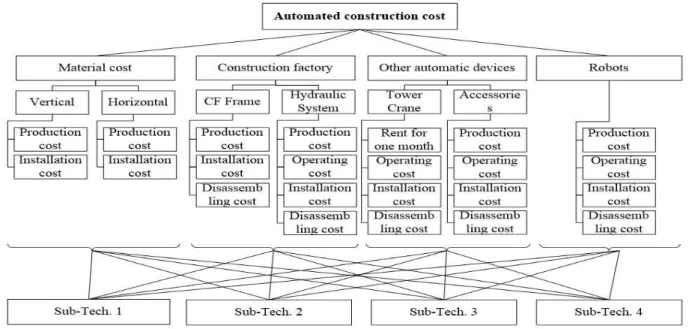
The variable CT is calculated using cost estimations per unit of construction from the Korean standard quantities[12]. The variable CA is measured using the cost breakdown structure (CBS) of the system, as shown in Figure 1. Because the automated system is new, the cost data are inadequate, and so the CBS was built by focusing on the cost items of the technologies. The main costs incurred are for the steel structures, the construction factory (CF), the intelligent tower crane, and the bolting robot. Each cost is specified and itemized by production, operation, installation, disassembly, lease expense of equipment, and labor and materials. CA is calculated and compared with CT, and the CI value is then calculated as follows:
T
A C
C
CI= /
---(2)
Figure 1. Structure of RCA system
(a) material assembly system; (b) CF system; (c) beam assembly system; and (d) monitoring and control system.
2.3 Performance index
The performance index (PI) is determined by Eq.
[3]. To calibrate the difference in scale between the BI and the CI, an adjustment coefficient, , is considered. When defining the BI, it is difficult to determine if, for instance, a new technology is twice as good as an old technology. On the other hand, because the cost items of a new system may contain many additional factors that have not been used in conventional methods, the new CI can be much higher than the previous index. The adjustment coefficient was developed using the Wideband Delphi technique[13], which is a useful technique for reaching a conclusion regarding an issue when the only information available is based more on “expert opinion” than on actual empirical data[14].
The PI value indicates the degree of cost effectiveness. A PI greater than 1.0 means that the benefit difference is larger (i.e., the innovation has better performance) than the cost difference.
Thus,
Cost Benefit CI
BI
PI =
a
× / =a
×D /D---(3) 3. Case study
3.1 Case description
The model was applied to an automation project being developed by the Research Center for Construction Automation (RCA) for High-Rise Buildings[15], as shown in Figure 2. The test-bed building (a steel structure with a reinforced concrete core, 3,300m
2in area) at Korea University in South Korea has seven floors. The traditional method was adopted for floors one to three, and the automated construction system was adopted for floors four to seven.
The RCA system has four core systems: 1)
monitoring and control, 2) material assembly, 3)
beam assembly, and 4) the CF. These systems are shown in Figure 2. In the monitoring and control system, the data from the system sensors are gathered using the integrated system protocol.
Then, the real-time progress management system and the real-time visualization system[16], which are subsystems of the monitoring and control system, examine the construction progress and display its status in three dimensions.
In the material assembly system, materials and structural steel frames are transported to the CF using a tower crane installed at the core of the building. Then, the frames are assembled semiautomatically by design for automation (DFA) technology developed by Jin et al.[17]. A beam assembly system transports the bolting robot system to the working space in the CF and executes the bolting process[18].
3.2 Data gathering and processing
3.2.1 BI
The benefit factors were determined using the
Delphi method, targeting four experts in construction and four experts in mechatronics to identify each benefit factor. A four-round Delphi survey was conducted, and the factors were divided into three classes: quality, productivity, and safety. Table 1 gives a detailed description of these factors.
Table 1. Detailed description of benefit factors.
Factors Subfactors Description of subfactors
Quality
Rate of work
success By how much has the success rate of steel fabrication been improved by the RCA system?
Ease of work By how much has the automated system made the fabrication easier?
Quality improvement in
fabrication
Has the automated system improved the quality of the fabrication compared with work done by skilled laborers?
Product ivity
Construction duration
If the automated system is used, what is the effect on the total duration of the construction?
Workload of tower crane
By how much has the automated system decreased the workload of the tower crane in steel fabrication work?
Operational efficiency of construction
system
Compared with the traditional method, how much improvement was shown in the operational efficiency of the construction system?
Safety
Workers’
safety assessment
Compared with the traditional method, how do the workers feel about the safety of the system?
Environmental safety
Compared with the traditional method, by how much has the new system improved the safety of the working environment?
Potentially dangerous factors
Can this system prevent or eliminate any potential hazards or dangerous factors?
Performance assessment model for robot‐based automated construction systems
To obtain the matrix W in Eq.[1], an AHP was performed based on the relationships between the benefit factors listed in Table 1. Pairwise comparisons
using a scale of 1–9 were used to evaluate the relative importance of each factor[19]. To evaluate the matrix S in Eq.[1], a questionnaire was designed with pairwise comparisons also using a scale of 1–9 and the responses were collected from two groups (28 completed responses from experts in developing core technologies and pilot-project workers). The questions corresponding to each factor are shown in Table 1.
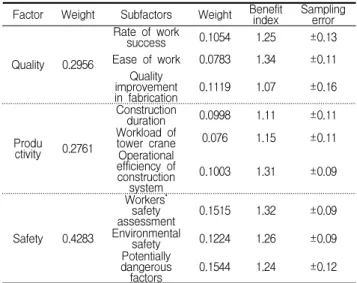
Using Eq.[1], the total BI was calculated as 1.20 with a 95% confidence level and a sampling error of ±0.12%. The detailed results for each benefit factor are listed in Table 2. The confidence level of all the factors is 95%.
Table 2. Measurement of benefit indices.
Factor Weight Subfactors Weight Benefit
index Sampling error
Quality 0.2956
Rate of work
success 0.1054 1.25 ±0.13
Ease of work 0.0783 1.34 ±0.11 Quality
improvement
in fabrication 0.1119 1.07 ±0.16
Produ
ctivity 0.2761
Construction
duration 0.0998 1.11 ±0.11 Workload of
tower crane 0.076 1.15 ±0.11 Operational
efficiency of construction
system 0.1003 1.31 ±0.09
Safety 0.4283
Workers’
safety
assessment 0.1515 1.32 ±0.09 Environmental
safety 0.1224 1.26 ±0.09
Potentially dangerous
factors 0.1544 1.24 ±0.12
3.2.2 CI
As reviously mentioned, the four cost items of an automated construction system integrated by core technologies are the steel structure, the CF, the intelligent tower crane, and the bolting robot.
The detailed costs of the various items of the automated construction system are listed in Table
3, including the core technologies (steel structure, CF, intelligent tower crane, and bolting robot). The CI is calculated using CA and CT, USD 862,073 and USD 103,218, respectively, and recalculated by cost per floor: CA is USD 215,518 per floor and CT is USD 34,406 per floor. The CI of the RCA system is therefore 6.26 (from Eq.[2]).
Table 3. Details of costs Cost items from CBS
Cost for RCA system (USD) From 4th to 7th
floor
Cost for traditional method (USD) From 1st to 3rd
floor Steel
frame
Production 96,049 68,570
Installation 13,529 11,576
Additional
device 30,000 –
Constructi on factory frame
Production 286,714 –
Installation 45,055 –
Disassembly 32,073 –
Recycling –45,818 –
Hydraulic device
Lease 4,986 –
Installation 36,364 –
Disassembly 22,727 –
deviceRoof
Production 166,182 –
Installation 28,909 –
Disassembly 5,364 –
Recycling –5,000 –
Bolting robot
Installation 2,727 –
Lease and
operation 8,727 –
Disassembly 1,364 –
Supporting devices
Production 31,818 –
Installation 5,455 –
Disassembly 2,727 –
Tower crane
Lease 10,338 7,753
Installation 15,127 11,345
Disassembly 5,299 3,974
Other automatio
devicesn
Production 58,636 –
Installation 909 –
Operation 2,722 –
Recycling 909 –
Total Cost per floor 862,073 103,218
215,972 34,406
3.2.3 PI
The adjustment coefficient was determined by
the Wideband Delphi technique. Five experts on
this system were invited to determine the
coefficient. Using Monte Carlo techniques with
5000 iterations, three values of the coefficient
were calculated. The minimum, maximum, and
respectively. From Eq.[3], the expected PI value of an automated construction system in Korea was calculated to be 0.77 with a 90% confidence band.
The upper limit on the 90% confidence band is 0.86, and the lower limit on the 90% confidence band is 0.68.
4. Model validation
To validate the assessment model, face validity, which involves an interview and survey with the end users, was performed. Five end users were selected for the validation and individual interviews were performed. The results show that the adjusted model can support the decision-making process usefully; however, more detailed information on the benefits and generalized cost breakdown structure is required for further research.
5. Discussion
The PI indicated that the system was not sufficiently cost effective for application to a real jobsite at this time. From the BI, if the system were applied to a construction project, a benefit of about 20% over the traditional method would be offered; specifically, it could improve jobsite and construction process safety. As suggested in previous studies, this automation system for the construction industry concentrated on substituting mechanical systems for human labor. This result proves the requirement quantitatively. In other words, the calculated BI value of “Ease of Work”
is 1.34, which is the highest of all the subfactors;
however, its weight factor value is 0.0783, which is the second lowest. When the expected benefits that are directly related to the system ’s objective
less important than the others for the automation system. However, after development of the automation system had finished, the system showed an unexpected disadvantage.
In terms of the CI, the automated construction cost is about six times the traditional construction cost. Regarding the automation system, new cost items related to the robot and other mechanics became apparent. Although the benefits of improved safety and recycling cost times were included, the new equipment costs are too high.
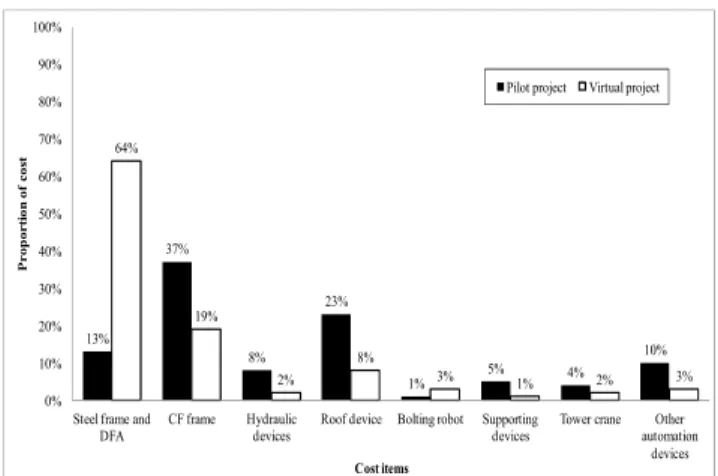
This is because the system was developed for high-rise buildings with at least 40 stories, but the pilot project is only a seven-story building. If the building were expanded to 40 stories, the proportions of the cost items would change, as shown in Figure 3, because the material cost of the steel frame increases, and so the cost of the automation equipment would be spread over a larger building cost. Compared with a seven-story building, the proportion of cost for the automation equipment was adjusted from 87% to 36%. Thus, the cost will decrease as the number of stories increases, increasing the repetition of steel fabrication work, and the construction duration will decrease relative to the size of the project.
This may decrease the CI. This model provides
three significant values to assess the automation
system. Regarding the BI, the model ’s user can
quantitatively identify the kinds of factors that are
improved by the automation system and the
relationship between factors. From the CI, the user
can find the proportions of cost items when the
system is applied. In addition, the cost breakdown
structure provides information on how to calculate
the automation construction cost. Finally, the PI
can support the decision-making process by
providing relevant figures.
Performance assessment model for robot‐based automated construction systems
13%
37%
8%
23%
1% 5% 4%
10%
64%
19%
2%
8%
3% 1% 2% 3%
0%
10%
20%
30%
40%
50%
60%
70%
80%
90%
100%
Steel frame and DFA
CF frame Hydraulic devices
Roof device Bolting robot Supporting devices
Tower crane Other automation
devices
Proportion of cost
Pilot project Virtual project
Cost items
Figure 3. Comparison of cost proportion for each cost item.
6. Conclusion
An adjusted model has been proposed to assess automated construction methods based on various scientific approaches, including the Delphi, Wideband Delphi, and Monte Carlo techniques. The conventional BCA model was revised based on differences in benefits and costs. To verify the usefulness of the proposed model, a real construction project constructed by an automation system was considered and its face validity was confirmed. The use of the model can support a decision maker interested in developing a new system. In addition, the approach of using the variances between two construction methods may be applicable to other construction development projects as well as to other industries.
Although the result is not ideal, it is nonetheless a meaningful outcome. First, an adequate assessment model was introduced to evaluate the economic efficiency of robotic construction technologies. This model not only can help practitioners to understand the economic effectiveness of the application of robotic technologies to the construction industry, but also help engineers to decide whether or not to use these new technologies. Second, the study enables
a better understanding of the influence of sub-technologies on costs and the areas in which more development is required. This could lead to careful investment into the improvement of automated construction systems, minimizing the trial and error that is common in the initial development of new technologies.
Acknowledgements
This work was supported by the Korean Institute of Construction and Transportation Technology Evaluation and Planning (KICTEP) under the program “06-Unified, the Advanced Construction Technology Program-D01 (the KICTEP program 06-UACTP-D01), ” and by a National Research Foundation of Korea grant funded by the Korean government (No. NRF-2009-352-D00314). The authors gratefully acknowledge this support.
References
1. Everett JG, Slocum AH. Automation and robotics opportunities: construction versus manufacturing. Journal of Construction Engineering and Management. 1994 Mar;120(2):443–52.
2. Oh D, Lee Y, Lee UK, Doh N, Cho H, Kang KI. Performance evaluation index for comparing traditional construction methods with a robot-based automated construction method.
In The 3rd International Conference on Construction Engineering and Management, Final program and Abstract book; 27–29 May 2009; Jeju, Korea. Seoul (Korea): Korea Institute of Construction Engineering and Management;
2009. p. 1088–94.
3. Lee JH, Yoo HS, Kim YS, Lee JB, Cho MY. The development of a machine vision : assisted teleoperated pavement crack sealer. Automation in Construction. 2006 Sep;15(5):616–26.
4. Ham YB, Kwon SW, Noh JH, Han JG, Kim KT. Development of road stripe removing equipment using high-pressure water jet. Automation in Construction. 2006 Sep;15(5):578–
88.
5. Woo S, Hong D, Lee W-C, Chung J-H, Kim T-H. A robotic
6. Li Z, Madanu S. Highway project level life-cycle benefit/cost analysis under certainty, risk, and uncertainty: methodology with case study. Journal of Transportation Engineering. 2009 Aug;135(8):516–26.
7. Zhou H, Williams KM, Farah W. Methodology to evaluate the effects of access control near freeway interchange areas.
Journal of Transportation Engineering. 2008 Dec;134(12):504 –11.
8. Jang WS, Skibniewski MJ. Cost–benefit analysis of embedded sensor system for construction materials tracking. Journal of Construction Engineering and Management. 2009 May;135(5):378–86.
9. Shin YS, Choi HB, Lee UK, An SH, Kang KI. A study on selection of slab formwork system for high-rise building construction. Journal of Architectural Institute of Korea:
Structure & Construction Section. 2006 Feb;22(2):147–54.
10. Linstone HA, Turoff M. The Delphi method: techniques and applications. Newark (MA): Addison-Wesley; 1975. 616. p.
11. Saaty TL. The analytic hierarchy process: planning, priority setting, resource allocation. New York (NY): McGraw-Hill;
1980. 57. p.
12. Korea Institute of Construction Technology. Standard quantities per unit of construction projects in Korea. Seoul (Korea): Ministry of Land, Transport and Maritime Affairs;
2010. p. 917-28.
13. Boehm B. Software engineering economics. Englewood Cliffs (NJ): Prentice-Hall, Inc.: 1980. 385 p.
14. Boehm B, Abts C, Chulani S. Software development cost estimation approaches―a survey. Annals of Software Engineering. 2000 Mar;10(1–4):177–205.
15. Kang TK, Nam C, Lee UK, Doh N, Park GT. Development of robotic crane-based automatic construction system for steel structures of high-rise buildings. In The 28th International Symposium on Automation and Robotics in Construction; 29 June–2 July 2011; Seoul, Korea. Seoul: International Association for Automation and Robotics in Construction;
2011. p. 670-1.
16. Kim K, Kim G, Kim K, Lee Y, Kim J. Real-time progress management system for steel structure construction.
Journal of Asian Architecture and Building Engineering.
2009 May;8(1):111–18.
17. Jin IG, Shin Y, Cho H, Kang KI. Development of component design process for automated construction system. Korean
18. Chu B, Jung K, Ko KH, Hong D. Mechanism and analysis of a robotic bolting device for steel beam assembly. In International Conference on Control, Automation and Systems; 2010 Oct; Ilsan, Korea. Seoul: Institute of Control, Robotics and Systems; 2010. p. 2351-6.
19. Saaty TL, Vargas LG. Models, methods, concepts and applications of the analytic hierarchy process. Norwell (MA):
Kluwer Academic Publishers; 2001. 335. p.