Vol. 41, No. 2, June 2015, 97-103 http://dx.doi.org/10.15230/SCSK.2015.41.2.97
1)
† 주 저자(e-mail: [email protected]) call: 031)709-9070
아시아 피부에서 기존 미백 평가방법과 이미지 분석방법의 비교연구 (비타민 C 제형의 이온토포레시스 연구)
박 혜 경†⋅김 남 수⋅문 태 기⋅김 보 라⋅정 호 영
㈜엘리드 피부과학연구소
(2014년 12월 18일 접수, 2015년 5월 14일 수정, 2015년 5월 23일 채택)
A Comparison Study Between Image Analysis and Conventional Methods in the Evaluation of Asian Skin Color
Hye Kyong Park†, Nam Soo Kim, Tae Kee Moon, Bora Kim, and Ho Young Jung
Ellead / Skin Research Center, 325, Hwangsaeul-ro, Bundang-gu, Seongnam-si, Gyeonggi-do 463-824, Korea (Received December 18, 2014; Revised May 14, 2015; Accepted May 23, 2015)
요 약: 최근까지 ChromameterⓇ CR-400, MexameterⓇ M18 그리고 육안평가는 피부색 평가를 위한 주된 평가방법으로 이용되어 왔다. 하지만 본 연구를 통해 피부색의 변화를 평가할 수 있는 객관성 있는 평가방법으로 이미지 분석을 제안하고자 한다. 본 연구에서는 세 가지의 기존 평가방법의 변수들과 이미지 분석을 통해 얻은 V (Value) 값을 이용하여 미백 인체 효능평가를 수행하고 변수들 사이의 상관성을 분석하여 이미지 분석의 신 뢰성을 확보하고자 하였다. 효능 평가를 위해 과색소침착으로 고민하는 34명의 시험 대상자를 모집하였고 선정된 시험 대상자들은 8주간의 시험기간 동안 vitamin C가 함유된 5 종류의 미백 화장품을 사용하는 동시에 일주일에 1회 전기이온영동(iontophoresis) 시술을 받았다. 제품 사용 및 시술 전과 8주 후 기존 평가 변수들과 V 값 측정결과를 비교하고 각 변수들 사이의 상관성을 분석한 결과, 제품 사용 및 시술 8주 후 V 값은 ChromameterⓇ의 L* 값의 경향과 유사하게 증가하였으며, L* 값과는 양의 상관관계를 보이는 것을 확인하였다(r = 0.494, p <
0.01). 또한, MexameterⓇ의 MI 값(r = - 0.683, p < 0.01)과 육안평가 측정 값(r = - 0.549, p < 0.01)은 V 값과 음의 상관관계를 나타내었다. 따라서 이미지 분석의 V 값의 활용은 기존의 평가방법과 더불어 주관적인 육안평가의 한계를 보완할 수 있는 신뢰성 있는 미백평가 방법의 하나라고 생각된다.
Abstract: Until recently, the three conventional evaluation methods, which are instrumental (ChromameterⓇ CR-400 and MexameterⓇ M18) and visual assessments have been used frequently for skin color evaluation. However, we took notice the potential of image analysis as a new tool to evaluate color change of skin. To reveal the reliability of the image analysis for the evaluation of whitening agents, 34 healthy female volunteers with hyperpigmentation were recruited, and the selected volunteers applied the whitening products containing Vitamin C twice a day in the morning and evening and received iontophoresis treatments once a week for 8 weeks. The changes in hyperpigmentation evaluated by ChromameterⓇ, MexameterⓇ and visual assessment were compared with the results from the image analysis. As with L* value trends of the analysis using ChromameterⓇ, the V value from the image analysis increased after applying the test products compared with baseline values. Furthermore, V value showed a positive correlation with L* value (r = 0.494, p < 0.01) and negative correlation with MI (r = - 0.683, p < 0.01) and VG (r = - 0.549, p < 0.01). Therefore, image analysis may be considered as an effective method to complement the limitations of visual assessment for whiten- ing efficacy in Asians.
Keywords: image analysis, evaluating method, efficacy, skin color, cosmetics
1. Introduction
Hyperpigmentation of the face is a common skin prob- lem among middle-aged women, especially those with dark complexion[1]. Moreover, facial skin color dis- tribution significantly influences the perception of age and attractiveness[2,3]. Asian women who have hyper- pigmentation generally use various whitening products or undergo medical treatments to get brighter skin. Therefore, it is very important to evaluate the efficacy of these whitening products and treatments, and setting up reliable evaluation methods for skin color assessment is crucial in the field of research associated with hyperpigmentation.
Various measurement methods, such as instrumental evaluation (using Chromameter
®or Mexameter
®) and vis- ual assessment, have been used to assess skin color.
Although they are useful and simple to handle, there are several disadvantages. Both Chromameter
®and Mexameter
®can measure only a limited part of the face (the measur- ing surface area of their probe is less than 1 cm
2). In ad- dition, the measured data can be influenced by varying manual pressure of the researcher during the measurement.
Visual assessment is a subjective evaluation method, so it is not possible to completely prevent individual biases.
The colors perceived through human eyes are affected by a number of factors such as pigmentation, blood flow, roughness of the skin surface, and illumination of the sur- roundings[4]. For these reasons, it is not easy to establish objective and quantitative criteria of visual assessment.
Thus, there is a growing need to develop more scien- tific and objective methods for assessment of skin color [5,6]. We paid attention to image analysis as a new candi- date for evaluation of skin color. However, there are no convincing studies on the relationship between Value pa- rameter (V value) from image analysis and the color pa- rameters of conventional methods, such as instrumental evaluation using Chromameter
®and Mexameter
®and vis- ual assessment.
In this study, we performed the image analysis of test areas using Image-Pro Plus software. Image-Pro Plus is an image analysis software that offers automated image cap-
turing, counting, and measuring of various objects includ- ing cells and skin. This software is already being used by thousands of researchers worldwide.
The V value analyzed by Image-Pro Plus software was compared with the L
*value of Chromameter
®, melanin index (MI) of Mexameter
®and visual grade (VG). Based on these results, we evaluated the correlation among vari- ous parameters.
The purpose of this study was to confirm the reliability and effectiveness of image analysis in the evaluation of Asian skin color.
2. Experimental
2.1. Subjects
The 34 subjects were healthy, Asian female volunteers with hyperpigmentation, aged 30 - 60 (43.75 ± 4.84 years) and each subject gave the informed consent in writing.
2.2. Treatment and measurement
All subjects applied the appropriate amount of the five kinds of whitening products on the entire face twice a day in the morning and evening. For all subjects, iontopho- resis treatments with Vitamin C were conducted weekly for 8 weeks in our laboratory. During the entire study pe- riod, the use of cosmetics other than the test materials in- volved in the study and dermatologic treatments that may potentially affect the test results were prohibited.
The evaluation process was performed under controlled temperature (20 ~ 24 ℃) and humidity (40 ~ 60%). All measurements were taken from the same skin site for each subject. The selected test areas (1 × 1 cm
2) were evaluated using instrumental analysis, visual assessment and image analysis at the initial visit and after 8 weeks.
2.3. Instrumental assessment using Chromameter
®CR-400
Chromameter (Chromameter
®CR-400, Minolta, Japan)
is a widely used device in the field of cosmetic research
that transfers the colors recognized by human eyes into
digital codes consisting of three parameters. Hyperpig-
mentation was assessed by measuring the L
*, a
*and b
*values of the test areas selected by the dermatologist at baseline and after 8 weeks. The L
*parameter represents color brightness between the values of 100 for a white surface and 0 for a black surface. The a* parameter repre- sents changes along a red-green axis with changes from + 60 for a red surface to 60 for a green surface. The b
*parameter changes from + 60 for a yellow surface to 60 for a blue surface. The trimmed mean of 5 measurement values from chromameter
®was calculated by removing the largest and smallest value among 5 values to reduce the effects of statistical outliers.
2.4. Instrumental assessment using Mexameter
®MX18 Mexameter (Mexameter
®MX18, Courage & Khazaka, Germany) measures the content of melanin and hemoglo- bin in the skin. The probe of Mexameter
®MX 18 emits three specific light wavelengths (568 nm, 660 nm and 880 nm) and a receiver measures the light reflected off of the skin. A MI value is calculated from the intensity of the absorbed and the reflected light by melanin at 660 nm (red light) and 880 nm (infrared light), respectively. The erythema index is determined by the intensity of the ab- sorbed and reflected light by hemoglobin at 568 nm (green light) and 660 nm (red light), respectively. The MI values were measured five times and, the trimmed mean of the values was calculated by discarding the largest and smallest value among 5 values.
2.5. VISIA-CR image analysis using Image-Pro Plus software
Each subject’s face was photographed using VISIA-CR (VISIA-CR, Canfield, USA) at baseline and after 8 weeks. The photographing conditions were set by a com- puter using a digital camera (EOS-5D Mark II digital SLR, Cannon, Japan) and a strobe mounted inside the equipment. VISIA-CR is equipped with specially manu- factured chin supports and forehead clamps, thereby main- taining an angle of 45° during the photographing process and fixating the distance between the subjects and the camera at all times. All the images captured with VISIA-CR system in cross-polarized condition were ana- lyzed using Image-Pro Plus 4.5 software (Image-Pro Plus, Media Cybernetics, USA). An example of image analysis using Image-Pro Plus software is demonstrated in Figure 1.
Skin brightness was assessed using the average of the V values.
2.6. Visual assessment by dermatologists
The skin color of the test areas was evaluated by two dermatologists using VG (0: none, 1: none / mild hyper- pigmention, 2: mild hyperpigmention, 3: mild / moderate hyperpigmention, 4: moderate hyperpigmention, 5: moder- ate / severe hyperpigmention, 6: severe hyperpigmention,
Figure 1. An example of image analysis using Image-Pro Plussoftware. The selected square on the subject’s face represents the hyperpigmented area to be analyzed.
7: very severe hyperpigmention). The skin color of each subject was evaluated at the initial visit and after 8 weeks with VG. The level of agreement between the two derma- tologists was compared using intraclass correlation co- efficient (ICC).
2.7. Statistical analysis
The changes of the values in each evaluation method were analyzed using repeated Measures ANOVA. In order to determine the relationship between L
*,MI, VG and V value measured by image analysis, Pearson and Spearman’s
rank correlation coefficient test was conducted. The ICC was used to determine inter-rater reliability between the two dermatologists. Data was analyzed by SPSS 21.0 software (IBM SPSS Statistics, IBM Corp., USA) and p values < 0.05 were considered statistically significant.
3. Results
3.1. Effect of whitening products and iontophoresis measured by conventional evaluation methods After 8 weeks of treatment (whitening products and iontophoresis), the hyperpigmented lesions of the subjects showed improvement when evaluated with the three con- ventional methods (Chromameter
®, Mexameter
®and visu- al assessment). The changes of skin color parameters are demonstrated in Figure 2. The L
*value of Chromameter
®at baseline was 59.30 ± 2.07 and it progressively in- creased to 61.34 ± 2.33 at 8 weeks after applying the test products (*p < 0.05). The MI value of hyperpigmentation at baseline was 204.28 ± 42.84 and the mean level was gradually reduced to 182.88 ± 34.96 after 8 weeks (*p <
0.05). Similarly, the VG decreased from 3.68 ± 0.64 to 3.18 ± 0.76 at 8 weeks after applying the test products (*p < 0.05). The inter-rater reliability between the two dermatologists is considerable (ICC = 0.961 at baseline, ICC = 0.974 at 8 weeks). All these results represent that statistically significant whitening effect can be verified by
Figure 3. Change of V value measured by Image-Pro Plussoftware after 8 weeks of treatment with whitening products.
*p < 0.05 vs. before treatment. T0: before applying the test products, T8: after 8 weeks of applying the test products.
Figure 2. Change of color parameters, (a) L* value, (b) MI and (c) VG, measured by the three conventional methods after 8 weeks of treatment with whitening products. *p < 0.05 vs. before treatment. T0: before applying the test products, T8: after 8 weeks of applying the test products.
Chromameter
®, Mexameter
®and VG.
3.2. Evaluation of whitening effect by image analysis using an image analysis software
The V value obtained by image analysis was 207.92 ± 11.66 at baseline and it increased to 212.02 ± 11.76 at 8 weeks after applying the test products. The increase in the V value from image analysis was a statistically significant improvement after 8 weeks when compared with the T0 values. Results of VISIA-CR image analysis using the Image-Pro Plus software at baseline and after 8 weeks are demonstrated in Figure 3.
3.3. Correlations between parameters of the conventional evaluation methods
Correlations between the three conventional evaluation methods are demonstrated in Table 1.
The analysis results of 34 subjects showed good corre- lation coefficients between the three conventional evalua- tion methods. The correlation coefficient (r) between L
*and MI was - 0.728. The correlation coefficient (r) be- tween L
*and VG was - 0.574 at baseline. Additionally, although the correlation coefficient between MI and VG
was not very high (r = 0.476, p < 0.01), it showed a stat- istically significant positive correlation. Similarly, these parameters showed statistically significant correlations at 8 weeks after applying the whitening products (Table 1).
3.4. Correlations between the V value of image analysis and other color parameters
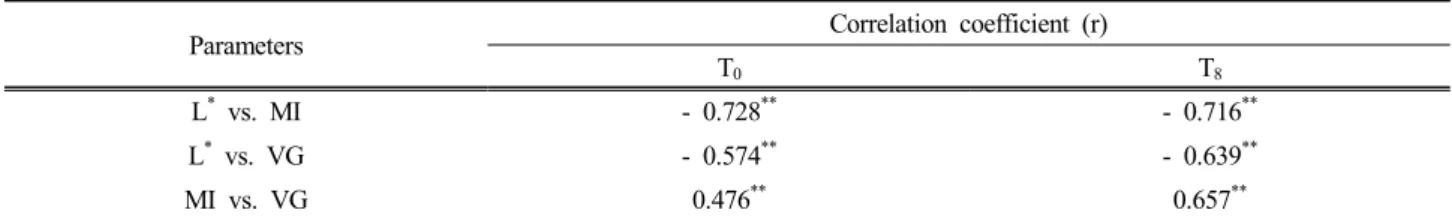
To assess if there is a relationship between the three parameters of the whitening evaluation methods and the image analysis parameter, their correlations were analyzed (Table 2).
The V value obtained from image analysis that refers to the degree of brightness was significantly correlated with the parameters of the three conventional evaluation methods (Chromameter
®, Mexameter
®and visual assess- ment) at baseline and 8 weeks.
At baseline, the correlation coefficients (r) of L
*, MI and VG with V value were 0.494, - 0.683 and - 0.549, respectively (Table 1). Also, we observed similar correla- tions between these parameters at 8 weeks. The correla- tion coefficients between three color parameters (L
*, MI and VG) measured by the three conventional evaluation methods and the V value measured by Image-Pro Plus
Parameters Correlation coefficient (r)
T0 T8
L* vs. MI - 0.728** - 0.716**
L* vs. VG - 0.574** - 0.639**
MI vs. VG 0.476** 0.657**
L*: Brightness parameter by Chromameter®, MI: Melanin Index by MexameterⓇ, VG: Visual Grade, T0: Before treatment, T8: After 8weeks of treatment, **p < 0.01
Table 1. Correlation Analysis between Parameters of the Three Conventional Methods
Parameter Correlation coefficient (r)
T0 T8
L* vs. V 0.494** 0.608**
MI vs. V - 0.683** - 0.713**
VG vs. V - 0.549** - 0.632**
L*: Brightness parameter by ChromameterⓇ, MI: Melanin Index by MexameterⓇ, VG: Visual Grade, V: Value, **p < 0.01 Table 2. Correlation Analysis between the V Value of Image Analysis and the Parameters of Conventional Methods
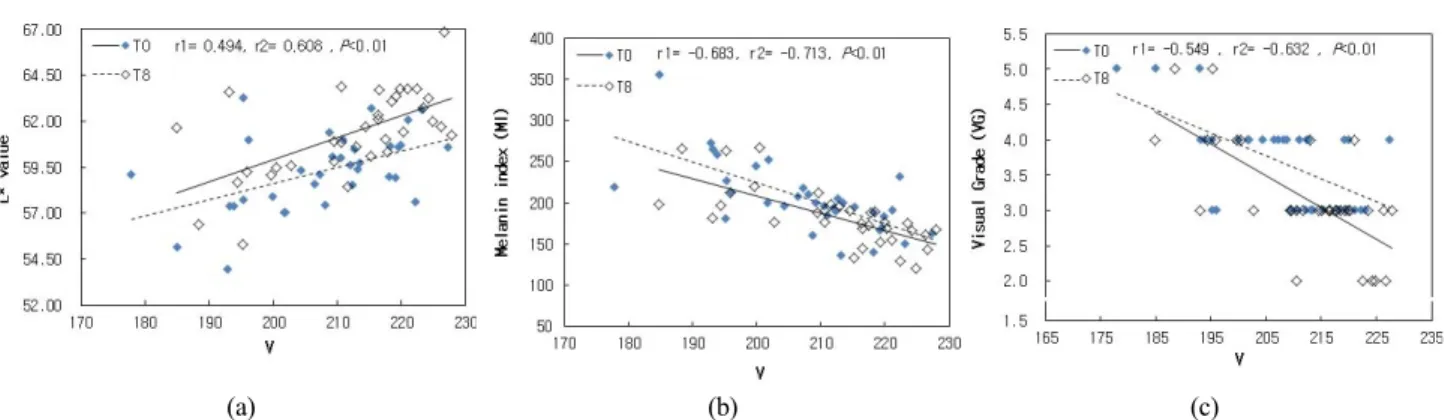
software all showed a significant correlation. The results for the correlation between the color parameters are shown in Figure 4 and Table 2.
4. Discussion
In the field of dermatology and the cosmetic industry, the increased interest in hyperpigmentation of skin and its improvement has led to the development of various ob- jective assessment methods. Although visual assessments and instrumental assessments are commonly used to meas- ure the brightness of skin, they have some disadvantages.
Their measuring area is less than 1 cm
2and contact-type measuring systems may lead to experimental errors.
Image analysis has been widely used in the fields of bi- ology and medicine. We took notice of its potential as a tool to evaluate color change of skin. In this study, VISIA-CR photographic data was analyzed by Image-Pro Plus software. Image-Pro Plus expresses the colors of im- ages in its three parameters [hue (H), saturation (S), and value (V)]. Hue is one of the main properties of a color such as the redness, blueness, greenness, or yellowness.
Saturation refers to the purity or intensity of a color.
Value is defined as the relative lightness or darkness of a color. Therefore, we compared the V value of Image-Pro Plus software with the values of the conven- tional methods.
After applying the test products for 8 weeks, we could
observe an increase in the V value. This discovery was similar to that of L* measured by Chromameter
®. We also compared the correlation between Mexameter
®and visual assessment. There was a significant positive correlation between MI and VG. In addition, we identified that both MI and VG values showed significantly negative correla- tions with L* values as demonstrated in a previous study[7].
Although there are some studies showing a correlation between the parameters of chromameter
®and Mexameter
®[7,8], not enough clinical research was done on the rela- tionship between image analysis parameters and other dif- ferent parameters for skin color evaluation. In this study, we found that V value shows a positive correlation with L* value and a negative correlation with MI value as well as visual grade (VG) at a statistically significant level.
Chromameter
®and Mexameter
®can only measure a limited area of less than 1 cm
2, while image analysis method analyzes a wider range of skin. Furthermore, these contact-type devices may cause inconsistent results due to excessive pressure or insufficient contact on the skin by a researcher[9]. In contrast, the measurements from image analysis are not influenced by measuring pressure because this method does not directly measure the subject’s skin. And image analysis can measure in a larger surface of the face compared with the instrumental evaluation method which can measure only a limited area of less than 1 cm
2. Therefore, the V value obtained from
(a) (b) (c)
Figure 4. Correlation graphs between the V value and the other color parameters: (a) Correlation of ChromameterⓇ L* value with the V value. (b) Correlation of MexameterⓇ MI with the V value. (c) Correlation of VG with the V value. Highly positive correlation was observed between L* and V value. MI and VG showed a significant negative correlation with V value.