343
“Journal of the Korean Society of Radiology, Volume 6, Number 5”
Evaluation of the dose distribution in Mapcheck using Enhanced Dynamic Wedge
Suman Kang
*, Eunsun Jang
*, Byungkoo Lee
**, Bongjae Jung
***, Jungsub Shin
****, Cheolwoo Park
*****Department of Radiation Oncology, Kosin University Gospel Hospital
*, Department of Radiation Oncology, Korea University Anam Hospital
**, Department of Radiological Science, International University of Korea
***,
Department of Radiologic Technology, Sunlin college
****,
Department of Radiologic technology Dong-eui Institute of Technology, Busan
*****Enhanced Dynamic Wedge를 사용한 Mapcheck에서의 선량분포 평가
강수만*, 장은성*, 이병구**, 정봉재***, 신정섭****, 박철우*****
고신대학교 복음병원 방사선종양학과
*, 고려대 안암병원
**, 한국국제대학교 방사선학과
***, 선린대학교 방사선과
****,동의과학대학 방사선과
*****Abstract
Intensity Modulated Radiotherapy (IMRT) is increasing its use recently due to its benefits of minimizing the dose on surrounding normal organs and being able to target a high dose specifically to the tumor. The study aims to measure and evaluate the dose distribution according to its dynamic changes in Mapcheck.
In order to verify the dose distribution by EDW angle(10˚,15˚,20˚,25˚,30˚,45˚,60˚), field size (asymmetric field) and depth changes (1.5 cm, 5.0 cm)using IMRT in Clinac ix, a solid phantom was placed on the Mapcheck and 100MU was exposed by 6 MV, 10MV X-ray. Using a 6MV, 10MV energy, the percentage depth dose according to a dynamic changes at a maximum dose depth (1.5 cm) and at 5.0 cm depth showed the value difference of maximum 0.6%, less than 1%, which was calculated by a treatment program device considering the maximum dose depth at the center as 100%, the percentage depth dose was in the range between 2.4%
and 7.2%. Also, the maximum value difference of a percentage depth dose was 4.1% in Y2-OUT direction, and 1.7% in Y1-IN direction. When treating a patient using a wedge, it is considered that using an enhanced dynamic wedge is effective to reduce the scattered dose which induces unnecessary dose to the surroundings.
In particular, when treating a patient at clinic, a treatment must be performed considering that the wedge dose in a toe direction is higher than the dose in a heel direction.
Key Words: Mapcheck, Enhanced Dynamic Wedge(EDW), Isodose Curve
Corresponding Author: Cheolwoo Park E-mail: [email protected], Tel: +82-(0)51-860-3531 Addr. Dong-eui Institute of Technology, Yangjeong 1-dong, Busanjin-gu, Busan, Korea
http://dx.doi.org/10.7742/jksr.2012.6.5.343
요약
세기조절방사선치료(intensity modulated radiation therapy ; IMRT)는 주변 정상장기 선량을 최소화하면서 종양에 집중적으로 고선량을 조사할 수 있는 장점으로 인하여 최근 그 사용이 급격히 증가하고 있다. 기능강화 동적쐐기 (enhanced dynamic wedge; EDW) 사용 시 기하학적 변화에 따른 Mapcheck에서의 선량분포를 측정 평가하고자 한 다. Clinac ix에서 IMRT를 이용하여 EDW angle(10˚, 15˚, 20˚, 25˚,30˚, 45˚, 60˚), field size(asymmetric field), depth 변화(1,5 cm, 5 cm)에 따른 선량분포를 검증하기 위해 Mapcheck위에 고체팬텀을 올려놓고 6 MV, 10MV X-ray로 100MU를 조사하였다. 6MV, 10MV의 에너지를 사용하여 기하학적변화에 따라 최대선량깊이(1.5 cm)와 5 cm 깊이에서 심부 선량백분율(percentage depth dose; PDD)은 치료계획장치에서 계산한 값의 차이가 최대 0.6%로 1%미만의 값으로 나타났다. 심부선량백분율은 조사야 중앙에서 최대선량깊이의 선량을 100%로 보았을 경우, 2.4%에 서 7.2%의 범위에 있다. 또한 심부선량백분율 차이의 최대값은 Y2-OUT 방향에서 4.1%로 나타났고 Y1-IN 방향으 로 1.7%로 나타났다. 동적쐐기를 사용하여 환자를 치료할 경우, 조사야 주변부의 불필요한 피폭을 유발하여 산란되는 선량을 줄이기 위하여 기능 강화 동적쐐기를 사용하는 것이 바람직할 것으로 사료된다. 특히 임상에서 환자를 치료할 경우, 쐐기의 toe방향 선량이 heel방향 선량보다 높다는 것을 염두에 두고 치료를 수행해야 할 것으로 사료된다.
중심단어 : Mapcheck, 기능강화 동적쐐기 , 등선량 분포곡선
Ⅰ. 서론
세기변조방사선치료(intensity modulated radiation therapy
; IMRT)는 치료 조사면의 선량 분포가 일정하게 유지되는 전통적인 치료 방식과는 달리 인체의 불규칙한 모양이나 내부 장기의 불균일성 또는 여러 방사선 조사면의 겹침에 따른 치료 표적 내 불균일한 선량분포를 형성한다[1-5].
또한 방사선 치료 시, 입사하는 광자와 환자 피부의 경사 굴곡 또는 불규칙한 종양의 모양으로 인하여 쐐 기 모양의 등선량 곡선을 필요로 하는 경우가 발생한 다. 이러한 필요를 충족시키기 위하여 금속쐐기 또는 기능 강화 동적쐐기 등이 임상에서 사용되고 있다[6]. 금속쐐기의 경우, 선속중앙에 위치시키며 선량 분포 를 원하는 각도, 방향으로 기울임으로써 치료의 효과를 증진시킨다. 쐐기인자는 실제 측정을 통하여 결정되고 조사야 크기에 따라 변화한다. 또한 금속쐐기의 물리적 인 특성으로 인하여 빔 경화효과가 발생하며, 쐐기각은 깊이에 따라 변화 한다. 금속쐐기를 사용할 경우 빔의 출력이 일정하기 때문에 환자 치료 시, 전자포탈영상장 치(electronic portal imaging device ; EPID)를 이용하여 포 탈 이미지를 얻을 수 있다. 하지만 방사선의 출력을 감 소시키고, 불필요한 산란선을 생성하며 예기치 않는 물
리적 충돌의 위험을 가지고 있는 것이 사실이다.
기능 강화 동적쐐기(enhanced dynamic wedge;EDW) 의 경우, 선량률과 콜리메이터의 움직임을 통하여 쐐 기 모양의 등선량 곡선을 생성한다.
쐐기인자는 STT(segmented treatment table) 에 의하 여 결정되고 조사면 크기의 증가에 따라 감소하는 특 성을 가진다. 또한 빔 경화효과가 없어 빔의 특성을 변화시키지 않는다. 깊이가 깊어지더라도 쐐기각은 항 상 일정한 각도를 유지할 수 있고 일반적으로 조사야 주변부 선량이 작다고 한다. 또한 10°, 15°, 20°, 25°, 30°, 45°, 60°에 제한되지 않은 다양한 각도를 만들어낼 수 있다. 금속쐐기를 사용할 때와 다르게 기능강화 동 적 쐐기를 장착한 gantry가 치료 중에 환자와 충돌할 우려가 없고 필터를 사용하지 않기 때문에 쐐기 자체 에 의한 감쇄가 없어 출력이 감소하지 않는다. 비대칭 조사야 에서도 사용이 가능하며, 금속쐐기에 비해 조 사면 바깥 영역의 선량이 낮아 조사면 주변 영역의 불 필요한 선량 전달을 줄일 수 있다. 이러한 기능강화 동적 쐐기(enhanced dynamic wedge;EDW)의 사용은 쐐 기의 탈부착이 필요 없기 때문에 임상에서 치료시간 의 단축과 함께 업무의 효율을 증가시킬 수 있는 장점 을 가진다[7].
“Journal of the Korean Society of Radiology, Volume 6, Number 5”
이처럼 금속쐐기와 기능강화 동적쐐기는 일정한 각 도를 가지는 등선량 곡선을 얻기 위한 동일한 목적으 로 사용되지만, 선량분포를 만드는 방법이나 선량 특 성적인 면에서 차이를 보인다. 실제 임상에서 쐐기를 사용할시 이러한 차이를 염두에 두고 쐐기를 선택해 야 하며 쐐기를 사용하여 방사선 치료를 수행할 때에 결정장기 등을 보호하는 것이 중요하다[8].
본 연구에서는 Varian 선형가속기(clinac iX Varian palo Alte, USA)에 장착된 EDW의 Mapcheck에서의 기 하학적 변화에 따른 선량분포와 Omnipro IMRT Software를 통한 선량분포를 확인하였다.
Ⅱ. 대상 및 방법
1. 실험 기자재
선형가속기는 부산지역 K대학병원에 설치되어 있 는 EDW가 장착된 Clinac iX (Varian palo Alte, USA)의 6MV, 10MV X-ray를 이용하였고, 방사선량률은 100MU 로 하였다.
선원-측정기간 거리(source-axis distance ; SAD)는 100 cm, 깊이는 phantom 표면에서 Dmax 1.5 cm, 5 cm에 위 치하였다. 측정용 phantom은 고체 팬톰(solid phantom) 이 사용되었다. 치료계획 선량분포도는 IMRT치료계획 소프트웨어인 Omnipro IMRT Software (version 8.9 Varian, USA)를 이용하여 Mapcheck (scanditronix wellhofer)에서 얻은 선량분포를 실시간으로 beam profile을 형성하여 isodose curve를 획득할 수 있다[9].
Fig. 1. Schematic illustration of treatment head geometries for external and internal wedges. The external wedge will be positioned below the secondary collimator while the internal wedge between the flattening filter and secondary collimator
2. 실험 방법
1) Mapcheck에서의 기하학적 변화에 따른 선량분 포 측정
본 연구 사용된 Mapcheck는 IMRT 계획의 빠르고 정확한 QA를 위해 2차원의 치료 방사선을 측정하는 이온전리함으로써 detector의 우수한 안정성, 고민감도 및 높은 공간해상도를 나타낸다[10].
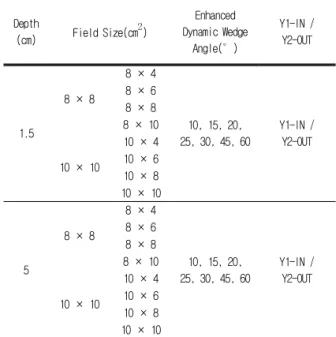
Table 1. The accuracy evaluation of Mapcheck using 6 MV photon beam (Asymmetric field Y1- IN direction, Asymmetric field Y2- OUT direction)
Depth
(cm) Field Size(cm
2)
Enhanced Dynamic Wedge
Angle(°)
Y1-IN / Y2-OUT
1.5
8 × 8
8 × 4
10, 15, 20, 25, 30, 45, 60
Y1-IN / Y2-OUT 8 × 6
8 × 8 8 × 10
10 × 10
10 × 4 10 × 6 10 × 8 10 × 10
5
8 × 8
8 × 4
10, 15, 20, 25, 30, 45, 60
Y1-IN / Y2-OUT 8 × 6
8 × 8 8 × 10
10 × 10
10 × 4 10 × 6 10 × 8 10 × 10
또한 1020개의 평행 평판형 전리함(직경: 0.45 cm, 높이: 0.5 cm, 배열간격: 0.7 cm, 체적: 0.08 cm3)이 격자 안에 일정한 간격으로 배열되어 있다.
Mapcheck 위에 30 × 30 × 0.5 cm3 고체팬텀을 올려 놓고 고정된 상태에서의 EDW angle, field size, depth 변화에 따라 6 MV, 10MV X-Ray를 이용하여 100MU를 각각 조사하였다. 최대 24.4 × 24.4 cm2 범위의 영상 획 득이 가능하며 Omnipro IMRT Software를 이용하여 Mapcheck 에서 얻은 선량분포를 실시간으로 isodose curve로 획득하였다[11].
실험 방법으로는 Mapcheck 위에 depth 1.5 cm의
25°, 30°, 45°, 60°)에 Y1-IN/Y2-OUT 으로 조사하였으 며, Table 1.과 같이 다른 field size에서도 동일한 조건 으로 조사하였다.
깊이에 따른 변화에서는 Depth 5 cm에서도 위와 동일한 조건으로 방사선을 조사한다.
Fig. 2 The peripheral dose was measured by using solid phantom with mapcheck
Fig. 3. Top down view Beam’s eye view of the diode showing the normalized diode position in 4D CT
2) Omnipro IMRT Software통한 선량분포 확인 EDW의 heel방향( Y1-IN )과 toe방향(Y2-OUT)이 조 사야 주변부의 선량이 주는 영향을 평가하기 위하 여 각각의 깊이 및 방향에서 선량을 측정하였다. 조사 야 주변부에서 측정된 선량은 조사야 내 최대선량깊이 에서의 선량으로 나누어 선량백분율로 표현하였다. 측 정시 선원표면간 거리는 100 cm이었고 1.5 cm 깊이에
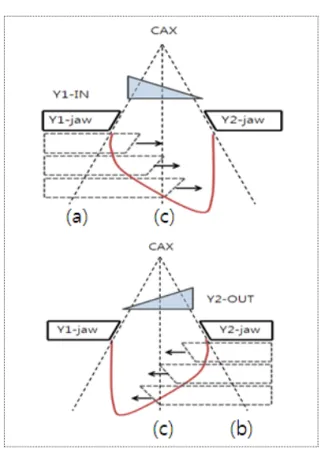
Fig. 4. Diagram illustrates for wedge orientation Y1-IN, Y2-OUT (a) Y1-collimator jaw was set to move across the treatment beam (b) Y2-collimator jaw was set to move across the treatment beam (c) Wedge isodose distribution will be created as the wedge orientation Y1-IN
, Y2-OUT
Ⅲ. 연구결과
1. Mapcheck(Omnipro IMRT Software) 통한 선량분포에서의 기하학적 변화에 따른 선량분포
6MV, 10MV의 에너지를 사용하여 기하학적변화에 따라 1.5 cm(최대선량깊이)와 5 cm 깊이에서 심부선량 백분율을 측정하였고(Table 1), Fig 5, 6 에 나타내었다.
측정치 계산값의 차이가 최대 0.6%로 1% 미만으로 나 타났다.
또한 심부선량백분율(percentage depth dose; PDD)은 깊이에 따른 선량분포를 나타내는 측정량으로 본 실 험의 변화인자들을 통해 동일 깊이에서 PDD는 field size가 증가할수록 증가하였고, depth가 증가할수록 감
“Journal of the Korean Society of Radiology, Volume 6, Number 5”
소함을 알 수 있었다. 그리고 angle의 변화에 따라 beam profile의 경사가 가파르게 나타났다.
Fig. 5. Measured dose profiles for 6 MV photons at an asymmetric field size of (8 × 6 cm2, 8 × 10 cm2, 10 × 6 cm2, 10 × 10 cm2, 20 × 10 cm2 off central -axis
distance 5 cm)
Fig. 6. Measured dose profiles for 6MV photons at an asymmetric field size of (10 × 6 cm2, off central -axis distance 1.5 cm) (a) 10°, 15°, 20°, 25°, 30°, 45°, 60°
EDW Y1-IN (b)10°, 15°, 20°, 25°, 30°, 45°, 60° EDW Y2-OUT
Fig. 7. Measured dose profiles for 6MV photons at an asymmetric field size of (10 × 6 cm
2, off central -axis distance 5 cm) (a)10°, 15°, 20°, 25°, 30°, 45°, 60° EDW Y1-IN (b) 10°, 15°, 20°, 25°, 30°, 45°, 60° EDW Y2-OUT
Y1-IN Y2-OUT
F⦁S
(cm
2) 15˚ 45˚ 60˚ F⦁S
(cm
2) 15˚ 45˚ 60˚
8*8 95.8 94 91 8*8 96.1 94.4 92.1
8*10 97.1 94.3 91.2 8*10 99.7 97.0 96.1 10*6 97.7 94.8 91.8 10*6 98.8 96.1 94.1 10*10 99.1 95.4 94.6 10*10 100.3 97.4 96.6 Table 2. The differences absolute doses measured mapcheck maximum dose(cGy) of 1.5 cm
Y1-IN Y2-OUT
F⦁S
(cm
2) 15˚ 45˚ 60˚ F⦁S
(cm
2) 15˚ 45˚ 60˚
8*6 81.8 78.7 76.3 8*6 81.9 79.2 77.0
8*10 83.4 79.6 76.9 8*10 83.4 79.9 77.4
10*6 82.7 79.6 77.1 10*6 82.5 80.0 77.7
10*10 82.5 80.3 77.7 10*10 84.4 80.7 78.2
Table 3. The differences absolute doses measured mapcheck
maximum dose(cGy) of 5 cm
그 중 depth 1.5cm, field size 10 × 6 cm2에서 Y1-IN 과 Y2-OUT은 다음과 같은 값을 보였으며, 측정값을 비교하였을 때 평균적으로 1.5%의 오차를 보였다. 또 한 depth 5cm, field size 10 × 6 cm2에서 Y1-IN과 Y2-OUT의 측정값을 비교하였을 때 평균적으로 0.4%
의 오차를 보였다.
본 실험의 결과 모든 측정값을 비교, 분석 하였을 때, 심부선량백분율은 조사야 중앙에서 최대선량깊이 의 선량을 100%로 보았을 경우, 2.4%에서 7.2%의 범위 에 있다. 또한 심부선량백분율 차이의 최대값은 Y2-OUT 방향에서 4.1%로 나타났고 Y1-IN 방향으로 1.7%로 나타났다.
Ⅳ. 고찰
Mapcheck(Omnipro IMRT Software)에서의 결과를 살 펴보면 Y1-IN(toe)방향의 조사야 주변부 심부선량백분 율이 Y2-OUT방향의 심부선량 백분율보다 높게 나타 났다. 박종민, 김희정 등[8]은 쐐기의 Heel 방향의 심부 선량백분율이 Toe방향의 심부선량백분율보다 평균적 으로 0.9% 낮았으며 toe쪽의 심부선량백분율과 heel 쪽 의 심부선량백분율의 차이는 쐐기의 각도가 커질수록 증가함을 입증한 바 있어 본 논문과 거의 차이가 없음 을 확인하였다.
그리고 쐐기의 특성상 실제 환자 혹은 Phantom에 전달되는 선량이 Y2-OUT 방향보다 Y1-IN(toe) 방향이 높다. 특히 콜리메이터가 Y2-OUT에서 Y1-IN(toe) 방향 으로 움직이며 닫히기 때문에 조사야 주변부로 Y1-IN(toe)방향의 산란되는 선량이 Y2-OUT 보다 높아 서 Y2-OUT 방향의 조사야 주변부 선량이 상대적으로 낮게 나타났다고 사료된다.
비대칭 조사야의 중심축에서 콜리메이터를 5 mm씩 이동하여 측정한 결과 조사야 및 측정 깊이가 깊을수 록 편평성이 평탄하지 않아 동일한 평면에서의 정확 한 선량측정이 요구된다. 또한 field size의 변화에 따라 OAD(off axis ratio)도 달라지게 됨을 알 수 있다. 하지 만 EDW의 angle의 변화에 따른 선량분포도의 차이는
Ⅴ. 결론
본 논문의 실험 결과 비대칭 조사야에서 조사야가 커지고 측정 깊이가 깊어질수록 선량의 감소가 두드 러지게 나타나므로 큰 조사야에서의 정확한 선량 계 산이 요구된다. 또한 등선량곡선은 차폐되는 중심축 쪽으로 가까이 갈수록 심부선량의 감소로 곡선의 형 태가 불균등하여 중심축 지점에 대한 선량 보정이 필 요하다.
EDW를 사용하여 환자를 치료할 경우, 조사야 주변 부의 불필요한 피폭을 유발하여 산란되는 선량을 줄 이기 위하여 기능 강화 동적쐐기를 사용하는 것이 바 람직할 것으로 사료되며 특히 임상에서 환자를 치료 할 경우, 쐐기의 toe 방향 선량이 heel 방향 선량보다 높다는 것을 염두에 두고 치료를 수행해야 할 것으로 사료된다.
Reference