Comparison of Slowness Profiles of Lamb Wave with Elastic Moduli and Crystal Structure in Single Crystalline Silicon Wafers
Youngjae Min*,**, Gyeongwon Yun*,**, Kyung-Min Kim*,***, Yuji Roh*,** and Young H. Kim*✝
Abstract Single crystalline silicon wafers having (100), (110), and (111) directions are employed as specimens for obtaining slowness profiles. Leaky Lamb waves (LLW) from immersed wafers were detected by varying the incident angles of the specimens and rotating the specimens. From an analysis of LLW signals for different propagation directions and phase velocities of each specimen, slowness profiles were obtained, which showed a unique symmetry with different symmetric axes. Slowness profiles were compared with elastic moduli of each wafer. They showed the same symmetries as crystal structures. In addition, slowness profiles showed expected patterns and values that can be inferred from elastic moduli. This implies that slowness profiles can be used to examine crystal structures of anisotropic solids.
Keywords: Silicon Single Crystal, Crystal Structure, Slowness, Lamb Wave, Elastic Constants
[Received: October 28, 2015, Revised: January 10, 2016, Accepted: January 25, 2016] *Applied Acoustics Lab, Korea Science Academy of KAIST, Busan 47162, Korea, **Korea Advanced Institute of Science and Technology, Daejeon, 34141, Korea, ***Seoul National University, Seoul 08826, Korea ✝Corresponding Author: [email protected]
ⓒ 2016 Korean Society for Nondestructive Testing
1. Introduction
Lamb wave (LW) is generated when an acoustic wave propagates inside solid plates.
Waves reflected and incident to the boundary surface combine to form different modes of the plate waves. LW is one of these plate waves.
When mode conversion of shear vertical waves and longitudinal waves occurs and both waves combine at the boundary of the plate, LW is formed.
Unlike bulk waves, LW has dispersive property, which causes the phase velocities to be dependent on the product of the frequency and the thickness of the (isotropic) plate. Infinitely many modes exist all over the frequency. LW can be detected using immersion ultrasonic testing [1].
When an acoustic wave of certain frequency is directed toward plates immersed in water, phase matching takes place at a certain incident angle, and LW is generated. While propagating along the plate, energy leakage occurs.
Adopting previous research results on back reflection of ultrasound obliquely incident to solid surface in water was observed [2], one can acquire pulse-echo responses from the liquid/
solid boundary due to a phenomenon called the ultrasonic backward radiation of propagating Rayleigh surface wave [3]. Backward radiations were classified into backscattering, leaks of microstructural scattering, and edge reflected radiations [4]. Backscattered LLWs have been measured for isotropic plates [5], and for anisotropic fibrous composite laminates [6].
When a LW propagates inside an anisotropic
plate, phase velocity is not only affected by the
thickness of the plate and the frequency of the
propagating LW, but also by the propagation
direction. Material anisotropy has a strong
influence on the velocities, attenuation, and
acoustic energy of the LW [7]. Rayleigh angle
of backward radiation was measured in a single
crystalline nickel [8], and phase velocities were
determined at each of the various incident
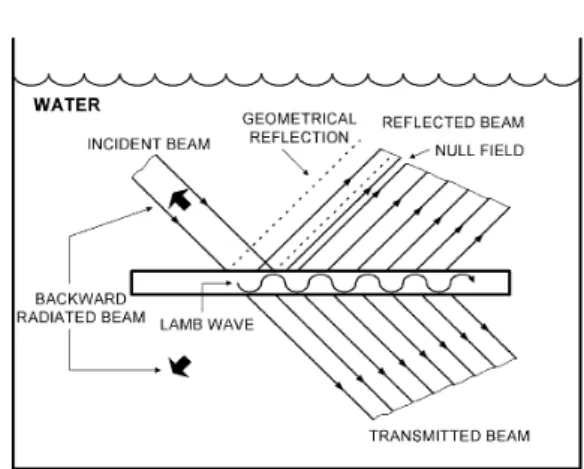
Fig. 1 Schematic diagram for LLW generation
silicon wafers [10]. A proper coordinate trans- formation to the known stiffness tensor gives the elastic constants for a given propagation direction.
In the present work, immersion ultrasonic testing was used as a method to investigate slowness profiles of LW in (100), (110), and (111) direction of silicon wafers. The slowness profiles were compared with elastic moduli and crystal structures.
2. Theoretical Background
2.1. Leaky Lamb Wave
Fig. 1 shows schematic diagram of how LLW is generated and detected. In the present work, edge reflected radiations were employed.
When an ultrasound of a single frequency is obliquely incident to the plate, phase matching takes place at specific angles at which the specific modes of LW are generated within the plate, propagated along the plate and reflected at the edge. During the propagation, the energy leaks to the water at the same angle as the incident beam. Some of them can be detected by the same transducer, allowing the pulse-echo setup to detect LLWs reflected at the edge of the specimen. The phase velocity can be calculated by Snell's law with refracted angle being 90º as
sin
(1)
where
is the phase velocity of the LW,
is the incident angle of acoustic wave generated
from the transducer, and
is the speed of acoustic wave inside water, which is approximately 1500 m/s (or 1.5 mm/μs).
2.2. Elastic Moduli
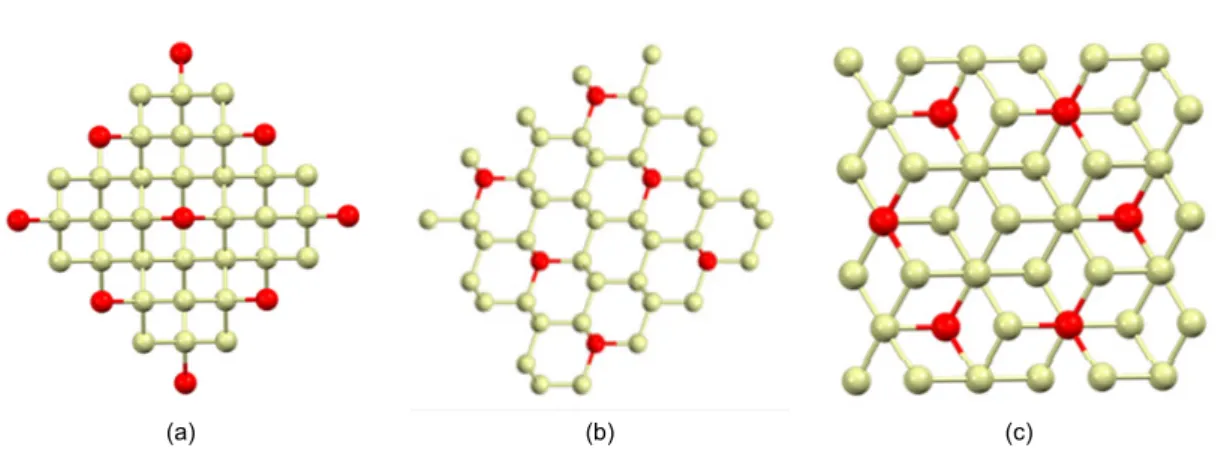
The silicon single crystal has a diamond structure, however it can be considered as a simple cubic crystal which is consisted of 8 silicon atoms [11]. (100), (110), and (111) shown in Fig. 2 are the most common crystal orientations of silicon crystals [10], and these orientations were considered in the present work.
The red spheres in the figures are atoms at corner in unit cell of silicon crystal.
For an isotropic material, Young's modulus is defined as the ratio of stress and strain in the direction of the stretching. That is
(2) where stretching direction is
. The Poisson's ratio is defined as ratio of length extension to sideways contraction, that is
(3)
For an anisotropic material such as silicon,
Young's modulus depends on which crystal
direction the material is being stretched to. To
account for anisotropy, tensor formalism is
required. The general relationship between stress
(a) (b) (c) Fig. 2 Crystal structures of (a) (100), (b) (110) and (c) (110) silicon single crystal
(a) (b) (c)
Fig. 3 Elastic moduli of (a) (100), (b) (110) and (c) (111) direction silicon wafers
and strain is [12]
(4) where
is the stiffness tensor,
is the strain and
is the stress tensor. Stiffness tensor of silicon single crystal in (100) direction is given by
GPa. (5)
Young's modulus in [100] direction can be obtained as [13]
130 GPa, (6)
and the Poisson's ratio can similarly be obtained as
0.28 (7)
The elastic moduli in any direction can be obtained by calculating the stiffness tensor by rotating coordinates. Rotated stiffness, is obtained by [14]
, (8)
where is the rotation matrix, and is given by
cos sin sin cos
(9)
when specimen rotates by the angle
around
the axis.
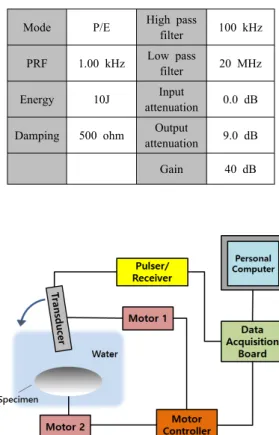
Gain 40 dB
Fig. 4 Experimental apparatus for the measurement of leaky Lamb wave
3. Experimental Details
3.1. Measurement Setup
(100), (110), and (111) direction silicon wafers were employed. Details of specifications of wafers are as follows:
• Diameter: 100 mm
• Thickness: 525 ± 25 μm
• Type / Dopant: P / B
• Resistivity: 1 ~ 20 ohm·cm
• Surface: one side polished
The effect of doping on elastic behavior is typically a 1~3% decrease for heavy doping levels and usually ignored for engineering calculations [15].
10 MHz single transducer of 15 mm diameter was used to generate and detect the ultrasound in pulse-echo setup. Detailed settings of pulser and receiver are indicated in Table 1.
A fully automated system used for the measurement of edge reflected LLW is shown in Fig. 4. Motor 1 and Motor 2 were employed to change propagation direction and incident angle, respectively. Motor 1 was employed to change the propagation direction from 0º to 360º with 0.5º increment by rotating the specimen while motor 2 was used for controlling the incident angle from 0º to 30º with 0.5º increment by rotating the transducer.
The LW was designated to propagate in the radial direction, so that it is reflected back at the circumference of wafer. The reflected ultra-
sound was digitized at 200 MHz sampling rate by 12 bit A/D converter, and stored in personal computer.
3.2. Data Analysis
For each wafer, 61×721 waveforms were
stored in personal computer. Fig. 5 shows the
procedure to obtain slowness of LW in (111)
silicon wafer. Maximum amplitude of signal was
extracted for a given incident angle and a
propagation direction. As shown in Fig. 5(a),
angular profile of edge reflected LLW can be
obtained from the maximum amplitude as a
function of incident angle [16]. Some waveforms
at certain incident angles showed large amplitude
compared to other waveforms. It implies that
phase matching occurred at those incident angles.
(a) (b)
(c) (d)
Fig. 5 Procedure to obtain angular profile of LW slowness. (a) angular profile of edge-reflected leaky Lamb wave, (b) slowness profiles for various propagation directions, (c) three dimensional profile of slowness, and (d) slowness profile as a function of propagation direction
Since phase velocity is given by Eq. (1), slowness (inverse of phase velocity) is determined from incident angle. Using this equation, the horizontal axis of Fig. 5(a) is converted into slowness, and this is repeated for various propagation directions. Integrating every graph of each propagation direction makes a three dimensional profile of slowness as shown in Fig. 5(c). By representing height in the three dimensional profile as gray-scaled color, slowness profile shown in Fig. 5(d) is obtained.
4. Results and Discussions
On the polar plane of and , each data was plotted with representing slowness and representing propagation direction. Maximum
amplitude was displayed by brightness of points
as shown in Fig. 5(d). Applying this process to
each data of (100), (110), and (111) direction
silicon wafers, final slowness profiles were
obtained as shown in Fig. 6. Moreover, phase
velocities of LW in a few modes were also
obtained by using computer simulation program,
DISPERSE [17]. With the reciprocals of the
calculated velocities, theoretical values were
marked on the figures. Different colors and
different shapes were used to separate each
mode of LW. Unfortunately, the DISPERSE
program did not work for (111) direction silicon
wafer, so it was impossible to compare the
slowness profile of (111) direction silicon wafer
with theoretical values.
(a) (b) (c) Fig. 6 Slowness profiles of (a) (100), (b) (110) and (c) (110) direction silicon wafers