Res. Plant Dis. 18(4) : 381−386 (2012) © The Korean Society of Plant Pathology http://dx.doi.org/10.5423/RPD.2012.18.4.381
독도의 토양 선충상
김동근*·박병용1·류영현
경북농업기술원 신물질연구소, 1국립농업과학원 작물보호과
Soil Nematode Fauna in Dokdo Island of Korea
Dong-Geun Kim, Byung-Yong Park1 and Young-Hyun Ryu Institute for Natural Products Research, Euiseong, Gyeongbuk 769-803, Korea
1Crop Protection Division, Rural Development Administration, Suwon 441-707, Korea (Received on April 10, 2012; Revised on December 20, 2012; Accepted on December 20, 2012)
Nematode fauna in Dokdo island was investigated for two years between 2008 and 2009. Population density and biomass were 239,500 m2 (26,000−836,000) and 103.9 mg/m2 (3.0−388.6), respectively. Total of 31 species of nematodes were identified : Acrobeloides is the most important genus with prominence value (PV) of 117.8, followed by Rhabditidae (PV = 81.9), Prismatolaimus (PV = 39.0), and Aphelenchoides (PV = 31.4). Among feeding group, bacteriovorus nematode composed 77% of density and 62% of biomass followed by plant- parasitic and fungivorus nematodes. A species of Pratylenchus having distinctive tail terminus is under study as a new species. Biological indices, Shannon and Wiener index (2.46), Simpson’s diversity index (0.86), Species evenness (0.73), Species richness (1.30) indicate that nematode fauna in Dokdo island is diverse and unique. This study may give a general idea of nematode fauna at the Dokdo island.
Keywords : Diversity index, Dokdo island, Feeding group, Species evenness, Nematodes
독도는 위도 37.25, 경도 131.867에 위치하는 대한민국 영토의 섬이다. 그러나 최근 일본 교과서의 독도영토표기 파문과 미국지명위원회가 독도를 ‘주권미정지역’으로 표 기하는 문제로 인하여 독도 문제가 전 국민적인 관심사 로 떠올라 정부와 지방자치단체 등 각계의 범국민적인 독 도수호운동이 전개되고 있다. 우리나라가 실효적으로 지 배하고 있는 독도에 대한 국내학자들에 의한 생태학적 연 구는 국제사회에서 독도에 대한 학술적 지배권을 확보할 있는 초석이 될 것이다.
선충은 지구상 거의 모든 환경에서 서식 가능하며 지 금까지 약 20,000여종이 기록되었다. 이들은 단위 면적당 밀도가 높고, 종류가 다양하며 식이습성(feeding group)도 식물기생성(plant parasitic), 동물기생성(animal parasitic), 포식성(predatory), 식세균성(bacteriovorus), 식균성(fungivorous), 잡식성(omnivorous) 등 다양하다(Yeates, 1993).
토양 선충의 활동에 의하여 세균, 곰팡이, 유기물질 등 이 분해되고 식물이나 다른 생명체에 양분으로 공급된다 고 하며(McSorley, 2004), 선충이 없으면 유기체는 분해 되지 않을 것이며 토양 양분공급 체계에 불균형이 올 것 이다(Yeates, 1979). 지금까지의 선충 연구는 주로 농작물 에 피해를 미치는 식물기생성선충에 대한 연구가 주를 이 루었으나 최근에는 토양생태계의 먹이사슬을 연구하기 위 해 토양선충을 지표로 이용하고 있다. 따라서 어떤 특정 지역의 선충상을 분석하면 그 지역 토양 생태계 구성에 대한 파악이 가능하다(De Ruiter 등, 2005).
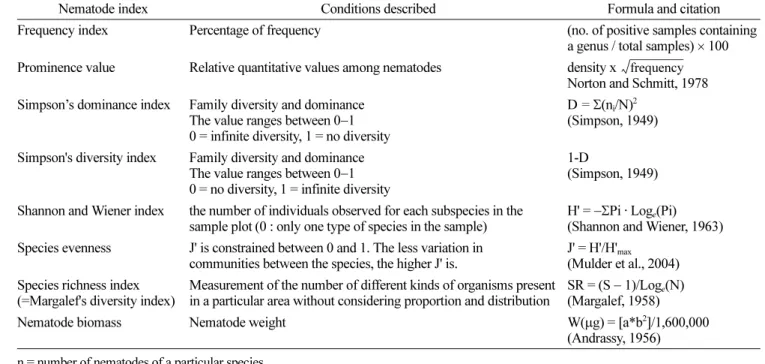
어느 지역의 생물상을 다른 지역의 생물상과 비교하기 위해서는 생태학적 지수(index)가 이용되는데, 선충학에서 주로 사용되는 생태학적 지수는 선충 생체량(Biomass), 빈 도(frequency), 종의 중요도(Prominence Index), 우점도 (Dominance, Simpson's index), 다양성 지수(Diversity, Shannon and Wiener index), 종 균일도(Species evenness), 종 풍부성(Species Richness) 등이 있다(Norton and Schmitt, 1978).
이번 현황조사는 독도에 서식하는 선충에 대한 종류와
*Corresponding author
Phone)+82-54-832-9669, Fax) +82-54-833-1359 Email) [email protected]
Note Open Access
생태를 조사 기록함으로서 앞으로 독도의 생태적 보존과 생태계 모니터링에 기초자료가 될 것이다.
재료 및 방법
토양 시료 채집 및 분리. 2008년부터 2009년까지 2개년에 걸쳐 독도에 선박 출입이 가능한 7−8월경에 독
도를 방문하여 동도, 서도로 나누어 총 11개의 토양 시료 를 채취하였다(Fig. 1). 또한 이 시기는 선충류의 밀도가 높아지는 시기이다. 토양 채집 방법은 식물이 군락을 이 루는 지점을 중심으로 표토 약 5 cm를 걷어내고 뿌리가 주로 분포하는 5−15 cm 깊이의 토양을 채집하였다. 채집 된 토양은 실험실로 운반하여 잘 섞은 다음 직경 1 mm 채로 쳐서 굵은 돌은 골라 버리고 남은 흙에서 300 cm3 를 취하여 Baermann's 깔데기법을 이용하여 선충을 분리 하였다(Southey, 1986). 약 24시간 후 선충을 채취하여 해 부현미경과 광학현미경을 이용하여 선충의 속까지 분류 하고 각 선충의 밀도를 조사하였다. 시료의 양이 많을 경 우에는 FG41 고정액(Southey, 1986)으로 고정한 후 검경 하였다.
선충상 및 생태적 분석. 선충의 식이습성(feeding group) 은 Yeates 등(1993)의 방법을 따랐는데, 1 = plant feeders, 2 = fungal feeders, 3 = bacterial feeders, 4 = substrate ingestion, 5 = animal predators, 6 = unicellular eucaryote feeders, 7 = dispersal or infective stages of animal parasites, 8 = omnivorous이다.
Fig. 1. Soil sampling sites at Dokdo island.
Table 1. Summary of nematode ecological indices used in this study
Nematode index Conditions described Formula and citation
Frequency index Percentage of frequency (no. of positive samples containing a genus / total samples)× 100 Prominence value Relative quantitative values among nematodes density x
Norton and Schmitt, 1978 Simpson’s dominance index Family diversity and dominance
The value ranges between 0−1 0 = infinite diversity, 1 = no diversity
D = Σ(ni/N)2 (Simpson, 1949) Simpson's diversity index Family diversity and dominance
The value ranges between 0−1 0 = no diversity, 1 = infinite diversity
1-D
(Simpson, 1949) Shannon and Wiener index the number of individuals observed for each subspecies in the
sample plot (0 : only one type of species in the sample)
H' = −ΣPi · Loge(Pi) (Shannon and Wiener, 1963) Species evenness J' is constrained between 0 and 1. The less variation in
communities between the species, the higher J' is.
J' = H'/H'max
(Mulder et al., 2004) Species richness index
(=Margalef's diversity index)
Measurement of the number of different kinds of organisms present in a particular area without considering proportion and distribution
SR = (S− 1)/Loge(N) (Margalef, 1958)
Nematode biomass Nematode weight W(µg) = [a*b2]/1,600,000 (Andrassy, 1956)
n = number of nematodes of a particular species N = the total number of nematodes of all species D = Simpson's dominance index
Pi = proportion of total sample belonging to the ith species (Ni/N) Loge = natural log
H' = Shannon and Wiener index H'max = Loge(S)
S = total number of species in the sample a = nematode length (µm)
b = the greatest body diameter of nematode (µm)
frequency
선충의 biomass는 동정된 선충에 대한 형태적 측정치 를 참고하였고 필요시 광학현미경(Olympus AX70)에 부 착된 디지털카메라(Nikon DXM1200F)를 이용하여 선충 을 촬영하고 software로 선충의 길이와 폭을 측정하였다.
생태학에서는 약 60개의 지수가 사용되어지고 있는데 여기에 사용되어진 지수는 출현빈도(Frequency Index):
Frequency = (검출 지점 수/총 조사 지점 수) × 100 [각 종 이 발견된 지점수를 총 채집된 지점수로 나누어 %로 표 시], Simpson's dominance index: D = Σ(ni/N)2 [n은 i번째 선충 종의 밀도, N은 전체 선충 밀도], Simpson's 다양성 지수: 1−D [D = Simpson's dominance index], Shannon and Wiener index(다양성 지수): H' = −ΣPi · Loge(Pi) [Pi = i 번째 종의 상대적 밀도(ni/N)], 균일도(Species evenness):
J' = H'/H'max [H' = Shannon and Wiener index, H'max= Loge(S);
S =전체 종 수], 중요도(Prominence value): PV = density
x [선충 밀도 X ], 풍부도(Species
Richness): SR = (S− 1)/Loge(N) [S =종수, N = 총 개체수]이 다(Table 1) (Norton and Schmitt, 1978).
결과 및 고찰
독도에서 발견된 선충류. 독도에서 총 31종의 선충이 발견되었으며 평균 밀도는 m2당 239,500마리(26,000−
836,000)였다. 식물 군락지별로는 왕호장근, 도깨비쇠고비, 쇠무릎 군락지(서도 4번 지점)에서 가장 밀도가 높은 836,000
마리/m2이었으며 가장 밀도가 낮은 지역은 돌피군락지(서 도 1지점) 26,000마리/m2이었다(Table 2). 각 지점별 선충 의 생체량은 3.0−388.6 mg/m2로 평균 103.9 mg/m2이었다 (Table 2).
국내에서 선충의 생태에 대한 연구는 많지 않은데, Lee 와 Choi(1982)에 의하면 지리산 피아골 극상림에서 선충 의 밀도는 219,720마리/m2, 생체량은 203 mg/m2, 식이 습 성 그룹 별로는 식물기생성이 91,541, 포식성 선충이 4,041, 기타 선충이 124,138마리/m2이었다. 독도 선충의 밀도는 지리산 극상림과 비슷한 수준이며 생체량은 독도가 낮은 경향이다.
외국의 조사에 의하면 선충 밀도가 가장 낮은 곳은 Pueto Rico 열대우림으로 8,100마리/m2, 밀도가 가장 높 은 곳은 툰드라지대의 3,900,000마리/m2이었다(Yeates, 1979). 일반적으로 온대 초원지대는 1,919,000(204,000−
3,695,000)마리/m2 정도인데 독도의 토양의 선충 밀도는 초원지대에 비하여 전체적으로 밀도가 낮은 편이다.
식이 습성 그룹에 따른 선충 조사에서 식세균성 선충 이 전체 선충 중에서 밀도로는 77%, 생체량으로는 62%
를 차지하여 가장 중요한 그룹이었다. 다음으로는 식물기 생성 선충의 밀도가 높았고 식균성 선충류는 생체량이 많 았다(Table 3). 포식성 선충류는 가장 밀도가 낮고 생체량 도 적었다(Table 3).
이를 미루어볼 때, 독도 토양생태계에서 에너지 흐름은 대부분이 식세균성 선충에 기인한다고 하겠으며 따라서
frequency 빈도
Table 2. Plant flora and nematode densities in Dokdo island
Sampling sitea Plant flora at collection site No. of nematodesb per m2
Biomass (mg/m2)
West 1 Echinochloa crusgalli (Dolpi) 26,000 3.0
West 2 Aster sphathulifolius (Haegook) 140,000 83.0
West 3 Liriope platyphylla (Maekmoondong) 166,500 81.1
West 4 Fallopia sachalinensis (Wanghojanggeun), Cyrtomium falcatum(Dokaebisoegobi), Achyranthes japonica (Soemooreup)
836,000 388.6 West 5 Fallopia sachalinensis (Wanghojanggeun) 77,000 53.9
West 6 Elaeagnus macrophylla (Boribabnamu) 52,000 4.1
West 7 Cyrtomium falcatum (Dokaebisoegobi) 256,000 97.0
East 1 Sedum polytrichoides (Bawichaesonghwa), Rumex japonicus (Chamsorijaengii) 76,000 32.4 East 2 Fallopia sachalinensis (Wanghojanggeun) 400,000 208.7 East 3 Agropyron tsukushiense var. transiens (Gaemill), Achyranthes japonica
(Soemooreup)
440,000 124.9
East 4 Echinochloa crusgalli (Dolpi) 165,000 65.7
Average 239,500 103.9
aSampling site= see Fig. 1.
bNumber of nematodes was calculated based on soil depth 15 cm.
독도 토양에는 세균의 밀도가 높고 상당히 역할이 있을 것으로 추정해본다. Biederman과 Boutton(2009)에 의하면 숲 생태계에서는 세균을 먹이로 하는 선충이 우점하고 초 원 생태계에서는 식물기생성, 식세균성, 식균성 선충이 비 슷하다고 하였음으로 독도 생태계는 숲의 생태계와 비슷 하다고 하겠다. 이번 조사에서 식이 습성 그룹 4의 substrate ingestion, 6의 단세포 진핵생물 포식자 그리고 7의 동물 기생성 선충은 발견되지 않았다.
독도에서는 총 31종의 선충이 발견되었다(Table 4, Fig.
3). 종별로 가장 밀도가 높은 종은 Acrobeloides sp. 속으 로 m2당 61,773마리였으며, 다음이 Rhabditidae로 m2당 51,363마리였다. 이 두 종 모두 세균성 선충이었다. 중요 도 분석에서도 Acrobeloides 속은 중요도(PV) 117.8로 가 장 높았고 다음으로 Rhabditidae(PV = 81.9), Prismatolaimus (PV = 39.0), Aphelenchoides(PV = 31.4) 순이었다. 반면 밀 도가 낮은 종은 m2 당 242마리로 Alaimus sp., Ditylenchus sp., Macroposthonia sp.이었다. 그 중 Macroposthonia sp.
와 Mesocriconema는 주름선충과에 속하는 선충이다. 주 름선충과에 속하는 선충은 활동성이 낮아 깔데기법으로 는 잘 분리가 되지 않고 주로 원심분리법에 의하여 분리 가 되는 종이다. 그러므로 이 종의 실제 밀도는 지금보다 약 10배 정도 높을 것으로 예상된다(Viglierchio와 Schmitt, 1983).
식물기생성 선충 중에서는 뿌리썩이선충(Pratylenchus sp.)의 중요도가 높았는데, 동도 참소리쟁이에서 꼬리 끝 이 곤봉형의 뿌리썩이선충이 발견되었다. 이러한 꼬리 형 태는 기존의 기록된 선충과 달라 신종으로 생각되며 추 가적인 DNA연구를 수행중이다(Table 4, Fig. 2).
독도 선충상에 대한 생태적 분석. 독도 선충 생태에
관한 분석 결과는 Table 5와 같은데, Shannon and Wiener index(2.46), Simpson's diversity index(0.86) 등으로 미루 어 매우 다양한 선충이 서식하는 것으로 생각된다. 이러 한 다양한 선충은 미개발된 자연 상태 토양의 특징이다.
또한 높은 종 균일도 수치(0.73)와 낮은 종 풍부성(1.30) Table 3. Nematode density and biomass of feeding group in
Dokdo island Feeding
groupa
Nematode densityb Biomass (mg)c per m2 Frequency per m2 Frequency
1 26,318 11% 4.9 5%
2 19,864 8% 27.9 27%
3 185,182 77% 64.6 62%
5 3,636 2% 0.8 1%
8 4,500 2% 5.7 5%
aFeeding group: 1 = plant feeders, 2 = fungal feeders, 3 = bacterial feeders, 4 = substrate ingestion, 5 = animal predators, 6 = unicellular eucaryote feeders, 7 = dispersal or infective stages of animal parasites, 8 = omnivorous (Yeates et al., 1993).
bNumber of nematodes was calculated based on soil depth 15 cm.
cNematode Biomass: W (µg) = [a*b2]/1,600,000 [a = nematode length (µm), b = the greatest body diameter (µm)].
Table 4. Nematode species, frequency, prominence value and their feeding habitats in Dokdo island
Species
No. of nematodesa
per m2
Frequencyb (%)
Prominence valuec
Feeding groupd Acrobeloides 61,773 91% 117.8 3
Alaimus 364 9% 0.2 3
Aphelenchoides 18,409 73% 31.4 2
Aphelenchus 1,091 27% 1.1 2
Cervidellus 1,818 9% 1.1 3
Coslenchus 5,091 9% 3.1 1
Diplogasteridae 818 9% 0.5 3 Diploscapter 3,091 27% 3.2 3
Ditylenchus 364 9% 0.2 2
Ecphyadophora 1,091 9% 0.7 1 Eucephalobus 6,045 45% 8.2 3
Geomonhystera 364 9% 0.2 3
Helicotylenchus 909 18% 0.8 1 Macroposthonia 364 9% 0.2 1
Malenchus 1,091 18% 0.9 1
Mesocriconema 727 9% 0.4 1
Microdorylaimus 1,091 9% 0.7 8 Monhysteridae 2,545 9% 1.5 3 Panagrolaimus 5,136 27% 5.4 3
Plectus 727 18% 0.6 3
Pratylenchus 12,727 36% 15.3 1 Prismatolaimus 21,545 82% 39.0 3 Qudsianematidae 2,182 27% 2.3 5 Rhabditidae 51,364 64% 81.9 3 Rhabdolaimus 17,091 18% 14.6 3
Seinura 1,455 45% 2.0 5
Teratocephalus 4,318 36% 5.2 3
Thonus 3,409 45% 4.6 8
Tylenchus 2,864 27% 3.0 1
Wilsonema 8,182 45% 11.0 3
Xiphinema 1,455 9% 0.9 1
a Number of nematodes was calculated based on 15cm soil depth.
b Frequency Index = percentage of frequency
c Prominence value = density x .
d See Table 3.
frequency
을 볼 때 독도의 동도, 서도에 유사한 선충들이 서식하 고 있다는 것을 알 수 있겠다. 이러한 사실들로 미루어 독도의 선충상은 종이 풍부하고, 다양한 것이 특징이며, 독도만의 독특한 생태계를 유지하고 있다고 하겠고 이것 은 경작되지 않고 자연 그대로 보존된 원시적 환경의 특 징이다.
앞으로 독도는 방문객 증가, 개발 등에 의하여 환경이 영향을 받을 수 있음으로 이번의 조사 결과는 독도의 생 태적 보존과 모니터링에 기초자료로 활용되어질 수 있을 것이다.
적 요
독도 생태 연구의 일환으로 2008−2009년 2개년간 독도 의 토양을 채집하고 선충의 종류, 밀도, 식이습성군, 생태 지수 등의 연구를 수행하였다. 독도에서 총 31종의 선충 이 발견되었으며 평균 밀도는 m2당 239,500마리(26,000−
836,000)였고 biomass는 103.9 mg/m2(3.0−388.6)였다. 중요 도는 Acrobeloides 속이 Prominence value(PV) 117.8로 가 장 높았고 다음으로 Rhabditidae(PV = 81.9), Prismatolaimus (PV = 39.0), Aphelenchoides(PV = 31.4) 순이었다. Feeding Group별로는 세균성선충이 전체 선충 중에서 밀도로는 77%, biomass로는 62%를 차지하여 가장 중요한 그룹이 었고 다음으로는 식물기생성선충과 식균성선충류였다. 동 도 참소리쟁이에서 발견된 뿌리썩이선충은 신종으로 추 정된다. 독도 선충의 생태적 분석 결과 Shannon and Wiener 지수(2.46), Simpson's diversity 지수(0.86), 종 균일도(0.73), 종 풍부성(1.30)을 볼 때 독도의 선충상은 종이 풍부하 고, 다양한 것이 특징이며, 독도만의 독특한 생태계를 유 지하고 있다고 하겠고 이것은 경작되지 않고 자연 그대 로 보존된 원시적 환경의 특징이다. 이번의 조사 결과는 독도의 생태적 모니터링에 기초자료로 활용되어질 수 있 을 것이다.
References
Andrassy, I. 1956. The determination of volume and weight of nematodes. Acta Zool. Hung. 2: 1−15.
Fig. 2. Pratylenchus n. sp. from Dokdo island has characteristic clavate tail shapes. A: whole, B: head, C: tail.
Fig. 3. Various species of nematodes isolated from Dokdo island.
Table 5. Ecological indices of nematodes in Dokdo island Ecological index Value
Species richness 1.30
Species evenness 0.73
Shannon and Wiener index 2.46 Simpson's dominance index 0.14 Simpson’s diversity index 0.86 Number of species identified 31
Species richness index (=Margalef's diversity index) : SR = (S−1)/
Loge(N) [S = number of species recorded, N = total number of species in the sample]; Species evenness : J' = H'/H'max [H' = Shannon and Wiener index, H'max = Loge(S); S = total number of species in the sample]; Shannon and Wiener index : H' = −ΣPi · Loge(Pi) [H' = index of species diversity, Pi = proportion of total sample belonging to the ith species, Loge = natural log]; Simpson's dominance index : D
= Σ(ni/N)2 [n = number of nematodes of a particular species, N = the total number of nematodes of all species]; Simpson's diversity index : 1-D [D = Simpson's dominance index].
Bernard, E. C. 1992. Soil nematode biodiversity. Biol. Fert. Soils 14: 99−103.
Biederman, L. A. and Boutton, T. W. 2009. Biodiversity and trophic structure of soil nematode communities are altered following woody plant invasion of grassland. Soil Biol.
Biochem. 41: 1943−1950.
Lee, B. H. and Choi, Y. E. 1982. The density and biomass of the small soil animals in the climax forest of Piagol valley in Mt.
Chiri. Rep. Korean Assoc. Conser. Nature 21: 163−177.
Margalef, D. H. 1958. Information theory in ecology. General Systematics 3: 36−71.
McSorley, R. 2004. Soil-Inhabiting Nematodes. The University of Florida. http://creatures.ifas.ufl.du/nematode/soul_nematode.
html.
Mulder, C. P. H., Bazeley-White, E., Dimitrakopoulos, P. G., Hector, A., Scherer-Lorenzen, M. and Schmid, B. 2004.
Species evenness and productivity in experimental plant communities. Oikos 107: 50−63.
Niblack, T. L. and Bernard, E. C. 1985. Plant-parasitic nematode
communities in dogwood, maple, and peach nurseries in Tennessee. J. Nematol. 17: 132−139.
Norton, D. C. 1978. Ecology of plant parasitic nematodes. New York: Willey-Interscience. 268 pp.
Norton, D. C. and Schmitt, D. P. 1978. Community analyses of plant-parasitic nematodes in the Kalsow prairie, Iowa. J.
Nematol. 10: 171−176.
Shannon, C. E. and Weaver, W. 1998. The mathematical theory of communication. University of Illinois Press, Urbana, USA.
144 pp.
Simpson, E. H. 1949. Measurement of diversity. Nature 163: 688.
Southey, J. F. 1986. Laboratory methods for work with plant and soil nematodes. London: Her Majesty's Stationery Office.
202 pp.
Viglierchio, D. R. and Schmitt, R. V. 1983. On the methodology of nematode extraction from field samples: Comparison of methods for soil extraction. J. Nematol. 15: 450−454.
Yeates, G. W. and Bongers, T. 1999. Nematode diversity in agroecosystems. Agr. Ecosyst. Environ. 74: 113−135.