─ 22 ─
ⓒ The Korean Society of Limnology. All rights reserved.
This is an open-access article distributed under the terms of the Creative Commons Attribution Non-Commercial License(http://creativecommons.org/licenses/by-nc/3.0/), which permits unrestricted non-commercial use, distribution, and reproduction in any medium, provide the original work is properly cited.
INTRODUCTION
Freshwater ecosystems possess high biodiversity, encom- passing nearly 6% of all species identified up to now(Dud- geon et al., 2006). However, freshwater biodiversity is more severely deteriorated than terrestrial and marine biodiversity as the result of anthropogenic disturbances(e.g., climate change, irrigation water, chemical pollution, physical habi- tat destruction, and invasive species settlement(Ormerod et
al., 2010). According to Living Planet Report 2012(WWF, 2012), living planet index(LPI) of freshwater ecosystems surveyed from 1970 to 2010 decreased by 76% in average, indicating the highest decrease compared with those of marine or terrestrial habitat. Despite the various threats of loss of freshwater biodiversity, there is a lack of studies on headwater and small streams, which are the source of the river environment and occupy an important position in the local freshwater environment.
Benthic macroinvertebrates form a taxonomically diverse group of animals with a wide variety of life history traits (Wallace and Webster, 1996), including a significant varia- tion in habitat preference. These characteristics support the
The Relationships between Benthic Macroinvertebrate and Environmental Factors in Iancheon and
Bukcheon Streams, Korea
Mi-Jung Bae*(0000-0003-4286-1119), Seon-Min Park(0000-0002-5953-2277), Ja-Kyung Kim(0000-0001-5058-0187), Jeong-Gi Hong(0000-0002-5450-8331) and Shi Hyun Ryu(0000-0003-3951-9419)
Nakdonggang National Institute of Biological Resources, 137, Donam 2-gil, Sangju-si, Gyeongsangbuk-do 37242, Republic of Korea
Abstract In this study, we investigated the relationships between benthic macroinvertebrate assemblages and various environmental factors in Iancheon(NIA) and Bukcheon(NBC) streams, Korea. We collected benthic macroinvertebrates and 33 environmental factors in April 2017 at 9 sites(5 sites in NIA and 4 sites in NBC).
We identified 93 species(5 phyla, 9 classes, 16 orders, and 53 families) and 69 species(5 phyla, 9 classes, 17 orders, and 47 families) in NIA and NBC streams, respectively. Considering benthic macroinvertebrate index (BMI), NIA(88.2) and NBC(80.2) streams were in “very good” status. Upstream areas showed the highest scores, 95.5(NIA1) and 94.2(NBC1), whereas BMI score was the lowest in downstream areas of both streams, especially in NBC4(51.0 “bad” status). Cluster analysis and non-metric multidimensional scaling analysis represented the differences of benthic macroinvertebrate assemblages according to spatial and anthropogenic gradients. Our findings provide reference data and highlight the need for the continued monitoring to maintain the good status and manage macroinvertebrate diversity in these two streams, in Sangju-si, Korea.
Key words: community indices, freshwater biodiversity, headwater, non-metric multidimensional scaling
Manuscript received 8 September 2019, revised 9 March 2020, revision accepted 9 March 2020
* Corresponding author: Tel: +82-54-530-0831, Fax: +82-54-530-0839 E-mail: [email protected]
Original article
widespread use of benthic macroinvertebrates as environ- mental indicator species(Hellawell, 1986; Rosenberg and Resh, 1993; Wright et al., 2000). Therefore, the diversity of benthic macroinvertebrates is an important issue for the in- tegrated assessment of living organisms and freshwater en- vironments(Barbour et al., 1999; Courtney and Clements, 2002; Dalu et al., 2017).
Iancheon(NIA) and Bukcheon(NBC) streams are rep- resentative streams in Sangju-si, Gyeongsangbuk-do, Ko- rea. NIA stream originates from Gallyeong, Donggwan-ri, Hwanam-myeon, Sangju-si, Gyeongsangbuk-do, flows in Oeseo-myeon, Euncheok-myeon, and Ian-myeon, and merg- es into Yeonggang River. The stream length is 38.5km and the basin area 241.21km2 (WAMIS, http://wamis.go.kr).
The Taemaek Coal Mine, the only anthracite mine in the Yeongnam region, is located near the upstream region of the NIA stream and ceased its operations in December 2005.
After a summer flooding in 2007, the outflow of acidic water from the mine reached some sections upstream of the NIA stream. This event and the proximity to a coal mine under- score the need for constant monitoring of water quality and biodiversity. However, few studies have been conducted on this area and only one study(data from 2005) on the diver- sity of benthic macroinvertebrate was performed there(Sim, 2007). NBC stream originates from the Baekhak Mountain at the border between Moseo-myeon and Naeseo-myeon, and flows through Naeseo-myeon and Sangju-eup to the Na-
kdong River. The downstream of NBC is an important place to the Sangju population as a place for resting and leisure.
For example, in downstream of NBC, Sangju city operates a water playground every summer since 2008, and the Buk- cheon Civic Park provides resting and working out places for residents. Noteworthy, some sections of both streams(NIA, 3.3km; NBC, 5.5km) have been designated as water source protection area since 1981.
Therefore, in this study, we surveyed the biodiversity of benthic macroinvertebrates-bioindicators of the status of freshwater ecosystems-in NIA and NBC streams. Then, we analyzed the relationships between benthic macroinvertebrate assemblages and various environmental factors to identify factors influencing the benthic macroinvertebrate assemblage in two streams located in Sajngju-si, Korea.
MATERIALS AND METHODS
1. Ecological dataWe collected benthic macroinvertebrates with a Surber net(30cm×30cm, 250μm mesh) at 9 sampling sites in two streams, 4 sites in NBC and 5 sites in NIA in spring season, 2017 usually when no heavy rain and/or no severe drought (Fig. 1). In each site, three replicates were conducted within the riffle zone representing the characteristics of the sam- pling area within a 50-meter range(Bae et al., 2016). In the Fig. 1. Location of the sampling sites in Iancheon and Bukcheon streams, Korea.
laboratory, the collected macroinvertebrates were sorted and preserved in 70% ethanol. Under a microscope(Z10, Nikon, Tokyo, Japan), individuals were identified mainly into the species level(except for some taxa, such as Chironomidae)
based on Quigley(1977), Pennak(1978), Brighnam et al.
(1982), Yun(1988), and Merritt and Cummins(2006).
We collected data on 33 environmental factors within 5 different categories, including geography, land use, hydrol- Abbreviation
Iancheon Stream Bukcheon Stream
NIA1 NIA2 NIA3 NIA4 NIA5 NBC1 NBC2 NBC3 NBC4
Geography
Altitude(m) 400 293 180 110 70 229 120 100 60
Distance from source(km) DFS 1.2 3.4 16.6 31.9 45.7 2.2 6.6 10.3 23.7
Slope(°) 6.3 6.6 3.2 7.1 0.0 13.6 3.7 1.6 0.0
Land use(%)
Urban 0.0 0.3 0.8 14.1 9.6 1.1 3.4 1.8 37.4
Agriculture 0.0 5.6 22.9 46.3 49.4 20.7 72.8 33.2 43.2
Forest 100.0 93.2 67.7 30.6 35.3 75.2 14.6 62.1 0.0
Grassland 0.0 1.0 0.0 3.0 0.0 2.9 1.0 0.0 3.2
Wetland 0.0 0.0 2.0 3.5 0.0 0.0 8.3 0.4 7.5
Bareland 0.0 0.0 6.6 2.3 5.7 0.0 0.0 2.5 8.7
Hydrology
Water depth(cm) 10.7 11.0 31.7 33.0 53.3 8.7 20.0 9.3 14.0
Water velocity(m s-1) 0.54 0.40 0.48 0.30 0.01 0.27 0.47 0.22 0.01
Substrate composition(%)
<0.063mm 0.0 0.0 0.0 0.0 0.0 0.0 1.1 0.4 1.3
0.063~2mm 2.0 0.8 0.7 0.9 1.3 0.4 2.9 2.8 2.9
2~4mm 8.1 1.2 0.7 0.9 2.7 0.6 1.7 3.3 3.4
4~8mm 5.0 2.2 0.7 1.4 4.2 0.8 2.6 2.6 2.4
8~16mm 2.8 2.8 1.3 5.0 6.8 2.3 4.3 3.8 7.7
16~32mm 5.0 5.0 3.7 11.8 10.1 5.9 5.5 12.8 15.3
32~64mm 10.0 7.9 9.9 8.5 23.5 9.5 25.1 18.3 21.2
64~128mm 15.2 17.9 20.8 20.9 41.4 25.1 40.3 42.9 27.7
128~256mm 26.4 37.2 32.7 45.6 9.9 41.6 16.5 13.1 18.1
>256mm 25.4 25.0 29.4 5.0 0.0 13.6 0.0 0.0 0.0
Water quality
Dissolved oxygen(mg L-1) DO 10.6 10.5 10.8 10.9 10.6 6.9 9.9 10.3 9.3
Dissolved oxygen(%) DO_% 91.7 93.5 106.6 108.0 103.1 73.3 88.2 96.3 91.1
pH 8.2 8.1 8.4 8.5 8.1 7.0 8.3 8.3 9.1
Conductivity(μS cm-1) 66.4 67.8 134.4 137.0 183.2 119.1 119.7 143.0 191.5
Turbidity(NTU) 1.3 2.8 2.6 1.7 3.3 0.0 1.3 1.5 2.9
Biological Oxygen Demand (mg L-1) BOD 3.0 1.5 2.8 2.5 3.7 4.0 1.3 2.2 1.6
Ammonia nitrogen(mg L-1) NH3-N 0.011 0.004 0.012 0.013 0.021 0.014 0.005 0.017 0.009
Nitrate nitrogen(mg L-1) NO3-N 1.16 0.77 1.04 1.08 1.01 0.80 1.23 1.18 0.76
Total nitrogen(mg L-1) TN 1.86 1.02 1.25 1.30 1.20 0.99 1.62 1.44 0.89
Phosphate-phosphorus(mg L-1) PO4-P 0.003 0.004 0.004 0.003 0.003 0.005 0.004 0.003 0.004 Total Phosphate(mg L-1) TP 0.007 0.011 0.006 0.007 0.007 0.01 0.008 0.006 0.008
Chlorophyll a(mg L-1) Chl-a 0.8 0.7 0.7 0.5 0.5 0.5 0.6 0.8 0.6
ogy, substrate, and physicochemical water quality which can be generally considered to influence the biodiversity of benthic macroinvertebrates(Table 1). Altitude, slope, stream order, distance from source(DFS), and land cover(%) were extracted from a digital map using ArcGIS 10.6(ESRI, Red- lands, CA, USA). Land cover(%), categorized as urban, pad- dy field, dry field, forest, grass, wetland, and bare soil, was extracted from a delimited buffer zone(1km long and 200 m wide) at each site(Bae et al., 2014). Water velocity was measured using a current meter(Model 2100, Swoffer Instru- ments, Federal Way, WA, USA). Substrate composition was measured based on Cummins and Lauff(1969). Dissolved oxygen, pH, conductivity, and turbidity were measured in situ using a multi-probe meter(YSI 2100, YSI, Yellow Springs, OH, USA). Biological oxygen demand(BOD), total nitrogen (TN), ammonia(NH3), nitrate(NO3-), total phosphorus(TP), ortho-phosphate(PO43-), and Chlorophyll-a(Chl-a) levels were measured in samples(4L of water) collected in sterile plastic bottles in each site and directly transferred to the labo- ratory on ice.
2. Data analysis
Community indices such as species richness, abundance (individuals m-2), Shannon diversity index(Shannon and Weaver, 1948), evenness(Pielou, 1975), dominance index (McNaughton, 1967), benthic macroinvertebrate index(BMI) (Kong et al., 2018), and functional feeding groups(FFGs) were calculated to interpret the basic characteristics of ben- thic macroinvertebrate assemblages in two streams. Five FFGs were used to classify behavioral mechanisms of food acquisition: collector-gatherers(CG), collector-filterers(CF), predators(PR), parasites(PI), scrapers(SC), and shredders (SH) based on a previous study(Merritt and Cummins, 2006).
Then, we analyzed patterns in spatial differences of benthic macroinvertebrate assemblages using multivariate analyses.
First, we applied a hierarchical cluster analysis(CA) using the Ward’s linkage method with the Bray-Curtis distance.
Then, we applied multi-response permutation procedures (MRPP) to evaluate whether or not there were significant differences among the defined clusters from CA. Lastly, a non-metric multidimensional scaling(NMS) was used to fig- ure out the distribution pattern of benthic macroinvertebrate assemblage based on the Bray-Curtis distance as the dissim- ilarity measure. All analyses were conducted in R(R Core Team, 2016).
RESULTS AND DISCUSSION
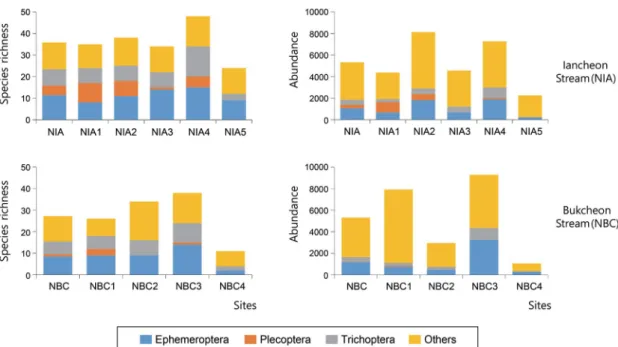
Regarding richness, 93 species(5 phyla, 9 classes, 16 or- ders, and 53 families) were found in the NIA stream and 69 species(5 phyla, 9 classes, 17 orders, and 47 families) were found in the NBC stream. The highest number of species was observed in NIA4(48 species) and NBC3(38 species) sites, whereas the downstream area showed the lowest species richness in both streams: 24 species in NIA5 and 11 species in NBC4(Fig. 2). Similarly, abundance was the lowest in NIA5(2,263 individuals m-2) and NBC4(1,067 individual m-2) whereas it was the highest in NIA2(7,263 individuals m-2) and NBC3(9,293 individuals m-2) sites.
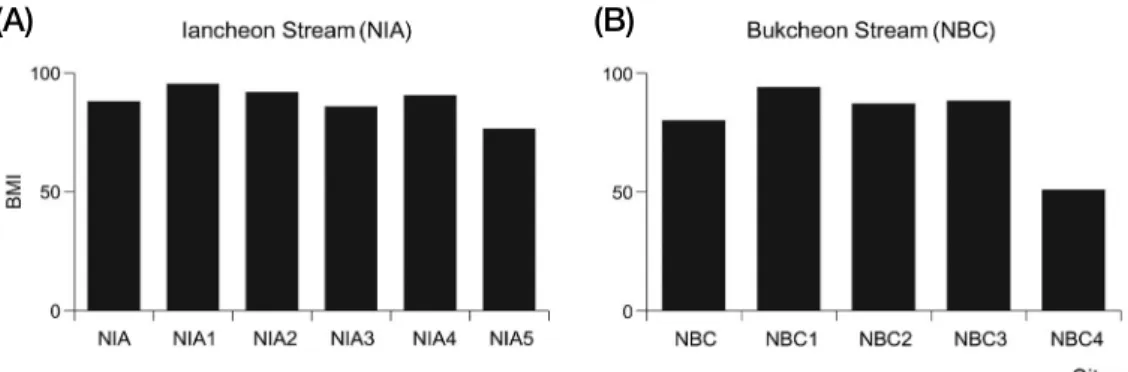
Considering community indices, dominance index was the highest(0.87) in the NIA5 downstream area, whereas the index was the lowest(0.55) in NBC4(Table 2). Except for NBC4, the most dominant species were Chironomidae spp. Sub-dominant species in the upstream area included Amphinemura KUa(Plecoptera) in NIA1 and Serratella se- tigera(Ephemeroptera) in NBC1. In the downstream areas, sub-dominant species were Elmidae sp.(NIA5) and Ephem- era orientalis(NBC4). The status of both NIA and NBC streams was “very good” with BMI scores 88.2 and 80.2, respectively(Fig. 3). The upstream areas showed the highest score as 95.5(NIA1) and 94.2(NBC1) whereas BMI scores were low in the downstream area in both streams, especially in NBC4(51.0 BMI, classified as “bad”).
The analysis of relative ratio of FFGs based on abundance revealed that the ratio of CG was the highest(42.57%) in NIA, followed by CF(18.53%), SC(16.40%), PR(12.20%), SH(10.29%), and PA(0.02%)(Fig. 4). In the case of NBC, the ratio of CG(44.16%) was also the highest, followed by SC(24.09%), CF(21.64%), PR(8.96%), SH(1.14%), and PA(0.02). For the relative ratio of FFGs based on species richness, CG also showed the highest ratio in both NIA (30.54%) and NBC(27.38%). The second highest ratio in NIA was that of PR(26.33%), followed by SC(22.13%), CF(10.59%), SH(9.98%), and PA(0.43%). In NBC, the second highest ratio was that of SC(24.73%), followed by PR(22.49%), CF(19.26%), SH(5.47%), and PA(0.68%).
Considering FFGs in each site, the ratio of SH was the highest in NIA1(the upstream of NIA), and the ratio of CG increased from upstream to downstream, ranging from 23.34% to 65.00%. In NBC1 and 2(upstream sites in NBC), the ratio of SC was 39.39% and 36.28%, respectively. The ratio of CG increased from upstream to downstream, from
14.63%(NBC2) to 74.47%(NBC4). Based on species rich- ness, the ratios of PR(30.30%) and SH(24.24%) were the highest in NIA1. Similar with FFGs based on abundance, the ratio of CG was higher in mid to downstream than up- stream ranging from 31.91%(NIA4) to 42.42%(NIA3). In NBC1, the ratio of PR was also the highest(25.00%) and the ratio of CG was higher in mid to downstream than up- stream ranging from 30.00%(NBC4) to 37.84%(NBC3).
Cluster analysis grouped the sites into three clusters based on the similarities in macroinvertebrate assemblage com-
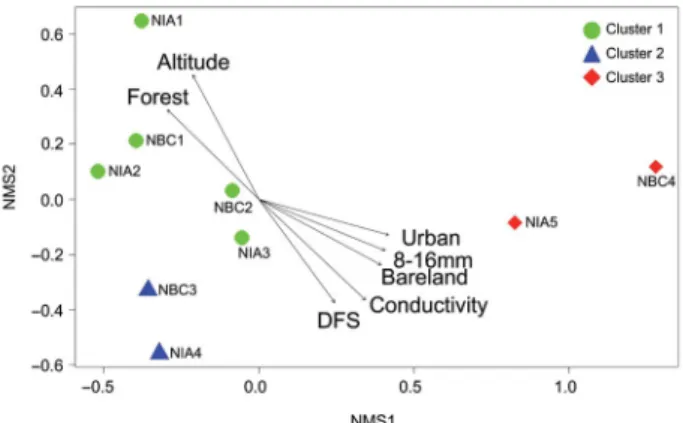
position; MRPP showed significant differences in benthic macroinvertebrate assemblage among the three clusters (A=0.08, P<0.05). Similarly, NMS also showed differenc- es in the composition of the macroinvertebrate assemblages (stress value=4.9 for the first two axes; Fig. 4, Table 3).
Sites with high values for altitude and forest land cover(%) (i.e. upstream sites in NIA and NBC) were located on the up- per-left part of the NMS ordination(mainly the sites included in cluster 1), whereas sites with high values of urban land cover, conductivity, and DFS(i.e. downstream sites in NIA Fig. 2. Species richness and abundance in Iancheon and Bukcheon streams, Korea(NIA and NBC represent the average values of species richness or abundance in each stream).
Table 2. Community indices at each sampling site in Iancheon and Bukcheon streams, Korea.
Streams Sites
Shannon diversity index
Richness
index Evenness Dominant
index(DI) Dominant species Sub-dominant species
Iancheon Stream
NIA1 2.92 18.4 0.40 0.63 Chironomidae spp. Amphinemura KUa
NIA2 3.24 17.1 0.45 0.53 Chironomidae spp. Paraleptophlebia chocorata
NIA3 2.78 18.3 0.38 0.64 Chironomidae spp. Simulium sp.
NIA4 3.24 17.3 0.45 0.62 Chironomidae spp. Uracanthella rufa
NIA5 1.28 19.9 0.18 0.87 Chironomidae spp. Elmidae sp.
Bukcheon Stream
NBC1 1.20 17.2 0.17 0.88 Chironomidae spp. Serratella setigera
NBC2 2.54 19.3 0.35 0.67 Chironomidae spp. Cincticostella levanidovae
NBC3 3.04 16.9 0.42 0.63 Chironomidae spp. Uracanthella rufa
NBC4 2.66 22.1 0.37 0.55 Limnodrilus gotoi Ephemera orientalis
and NBC) were located on the lower-right part based on axis 1(mainly the sites included in cluster 3). The most influential factor on macroinvertebrate assemblage in both NIA and NBC was conductivity(0.89), followed by altitude(0.88), bareland land cover(0.76), DFS(0.71), 8~16mm substrate composition(0.71), urban land cover(0.69), and forest land cover.
The composition of benthic macroinvertebrate assemblag- es can be affected by various factors, such as latitudinal gra- dients, stream segmentation, and microhabitat(Bae et al., 2016). In this study, we monitored the diversity of benthic
macroinvertebrates in two representative streams in Sangju- si, Korea. These two streams have been rarely surveyed up to now and our research provides the basic information to understand the status of freshwater habitats, as well as biodiversity, in the river basin. The upstream areas of both streams(NIA and NBC), including the headwater region, presented various habitat conditions with good water quality and high biodiversity of benthic macroinvertebrates. In our research, CA and NMS showed the spatial differences of benthic macroinvertebrate assemblages. For example, NIA5 and NBC4, which are downstream areas exposed to various Fig. 3. Benthic macroinvertebrate index in Iancheon(A) and Bukcheon(B) streams, Korea(NIA and NBC represent the average values of benthic macroinvertebrate index in each stream).
(A) (B)
Fig. 4. Composition of functional feeding groups at each sampling site in Iancheon and Bukcheon streams, Korea. SH: Shredder, SC:
Scraper, CF: Collector-filterer, CG: Collector-gatherer, PR: Predator, PA: Parasite(NIA and NBC represent the average values of functional feeding group in each stream).
anthropogenic disturbances, such as high ratios of urban and agriculture land cover and poor water quality(i.e., high conductivity), were grouped into the same cluster. On the other hand, the sites located in upstream areas of NIA and NBC showed high biodiversity with various FFGs and were ordinated oppositely to NIA5 and NBC4(i.e. downstream areas). Generally, the land use conversion in the riparian area from high ratio of forest to agriculture and/or urban can severely influence the biodiversity of benthic macroin- vertebrate assemblages(here, upstream to downstream area in NIC and NBC)(Genito et al., 2002; Shieh et al., 2003).
Species richness of the macroinvertebrate generally de- crease(Zhang et al., 2013), the ratio of CG in both case of abundance and species richness increase. In our study, the ratio of agriculture(%) in land cover increased from 0.0%
to 46.3% in NIA and from 20.7% to 43.2% in NBC. In addition, in NBC, the ratio of urban area(%) in land cover was the highest as 37.4% in the downstream. Thus, spe- cies richness and BMI were lower mainly downstream in both streams and especially, BMI in NBC4 was the lowest among all study sites. This indicates a healthier freshwater biodiversity in upstream areas with heterogeneous environ- mental conditions than that in downstream areas(Vannote et al., 1980). Biodiversity in the upstream can influence downstream sites, mainly by allowing the re-establishment of freshwater species in downstream areas that might be strongly deteriorated due to anthropogenic and natural dis- turbances(Callanan et al., 2014). However, in spite of the importance of headwater ecosystems to support the resil- macroinvertebrate assemblage.
Factors
NMS axis
R2 P
NMS1 NMS2
Geography
Altitude (m) - 0.43 0.91 0.88 0.00
Distance from source (km) 0.55 - 0.84 0.71 0.03
Slope(°) - 0.84 0.54 0.51 0.12
Land use(%)
Urban 0.96 - 0.30 0.69 0.03
Agriculture 0.43 - 0.90 0.45 0.17
Forest - 0.67 0.74 0.68 0.03
Grassland 0.60 - 0.80 0.06 0.85
Wetland 0.88 - 0.48 0.22 0.47
Bareland 0.86 - 0.52 0.76 0.01
Hydrology
Water depth(cm) 0.46 - 0.89 0.36 0.25 Water velocity (m s-1) - 0.82 0.57 0.66 0.04 Substrate composition(%)
<0.063mm 0.99 0.12 0.31 0.30
0.063~2mm 0.90 0.44 0.15 0.63
2~4mm 0.07 1.00 0.39 0.24
4~8mm 0.24 0.97 0.29 0.35
8~16mm 0.91 - 0.41 0.71 0.03
16~32mm 0.57 - 0.82 0.53 0.10
32~64mm 0.98 - 0.21 0.43 0.19
64~128mm 0.46 - 0.89 0.24 0.44
128~256mm - 0.97 - 0.24 0.32 0.33
>256mm - 0.53 0.85 0.43 0.19
Water quality
Dissolved oxygen(mg L-1) - 0.01 - 1.00 0.09 0.71 Dissolved oxygen(%) 0.13 - 0.99 0.38 0.25
pH 0.69 - 0.72 0.34 0.30
Conductivity (μS cm-1) 0.69 - 0.73 0.89 0.00 Turbidity(NTU) 0.86 - 0.52 0.41 0.21 Biological Oxygen
Demand(mg L-1) - 0.19 0.98 0.02 0.94 Ammonia nitrogen(mg L-1) 0.36 - 0.93 0.14 0.64 Nitrate nitrogen(mg L-1) - 0.65 - 0.76 0.12 0.67 Total nitrogen(mg L-1) - 0.69 0.72 0.21 0.49 Phosphate-phosphorus
(mg L-1) - 0.09 1.00 0.08 0.76
Total Phosphate(mg L-1) - 0.29 0.96 0.16 0.59 Chlorophyll a(mg L-1) - 0.53 0.85 0.22 0.48 P values lower than 0.05 are indicated in bold.
Fig. 5. Non-metric multidimensional scaling ordination based on benthic macroinvertebrate community. Environmental factors with P<0.05 are represented in the figure. Different colors and symbols indicate the result of cluster analysis: green square, cluster 1; blue, cluster 2; and red diamond, cluster 3.
ience of species diversity up to downstream, little attention has been given to monitoring benthic macroinvertebrate assemblages in headwater streams. Maintaining the healthy freshwater habitats and high biodiversity is essential, es- pecially for NIA and NBC streams, which are important to provide resting and leisure places for the local population.
Therefore, the continuous monitoring of freshwater organ- isms is needed to preserve their high biodiversity and evalu- ate the effects of environmental changes and disturbances in future.
Author information Mi-Jung Bae(Nakdonggang Nat- ional Institute of Biological Resources, Senior Reseacher), Seon-Min Park(Nakdonggang National Institute of Biolo- gical Resources, Researcher), Ja-Kyung Kim(Nakdonggang National Institute of Biological Resources, Associate Res- earcher), Jeong-Gi Hong(Nakdonggang National Institute of Biological Resources, Associate Researcher), Shi Hyun Ryu(Nakdonggang National Institute of Biological Reso- urces, Principal Researcher)
Author contribution statement Conceptualization:
M.J. Bae, J.K. Kim, J.G. Hong, S.H. Ryu, Field survey and data collection: M.J. Bae, S.M. Park, J.K. Kim, J.G. Hong, Data analysis and writing: M.J. Bae, Review and editing:
M.J. Bae.
Conflict of interest The authors declare no conflict of interest. The sponsors had no role in the design, execution, interpretation, or writing of the study.
Funding This work was supported by a grant from the Nakdonggang National Institute of Biological Resources (NNIBR), funded by the Ministry of Environment(MOE) of the Republic of Korea(NNIBR202001108).
REFERENCES
Bae, M.J., F. Li, Y.S. Kwon, N. Chung, H. Choi, S.J. Hwang and Y.S. Park. 2014. Concordance of diatom, macroinverte- brate and fish assemblages in streams at nested spatial scales: Implications for ecological integrity. Ecological Indicators 47: 89-101.
Bae, M.J., J. Chun, T.S. Chon and Y.S. Park. 2016. Spatio-tem- poral variability in benthic macroinvertebrate communi- ties in headwater streams in South Korea. Water 8: 99.
Barbour, M.T., J. Gerritsen, B.D. Snyder and J.B. Stribling. 1999.
Rapid bioassessment protocols for use in streams and wadeable rivers: periphyton, benthic macroinvertebrates and fish(Vol. 339). Washington, DC: US Environmental Protection Agency, Office of Water.
Brighnam, A.R., W.U. Brighnam and A. Gnika. 1982. Aquatic Insects and Oligochaetes of North and South Carolina.
Midwest Aquatic Enterprise. Mahomet: Illinois.
Callanan, M., J.R. Baars and M. Kelly-Quinn. 2014. Macroin- vertebrate communities of Irish headwater streams: Con- tribution to catchment biodiversity. Biology and Environ- ment: Proceedings of the Royal Irish Academy 114: 143- 162.
Courtney, L.A. and W.H. Clements. 2002. Assessing the influence of water and substratum quality on benthic macroinverte- brate communities in a metal-polluted stream: An experi- mental approach. Freshwater Biology 47: 1766-1778.
Cummins, K.W. and G.H. Lauff. 1969. The influence of substrate particle size on the microdistribution of stream macroben- thos. Hydrobiologia 34: 145-181.
Dalu, T., R.J. Wasserman, J.D. Tonkin, M.E. Alexander, M.T.
Dalu, S.N. Motitsoe, K.I. Manungo, O. Bepe and T. Dube.
2017. Assessing drivers of benthic macroinvertebrate community structure in African highland streams: an ex- ploration using multivariate analysis. Science of the Total Environment 601: 1340-1348.
Dudgeon, D., A.H. Arthington, M.O. Gessner, Z.I. Kawabata, D.J.
Knowler, C. Leveque, R.J. Naiman, A.H. Prieur-Richard, D.
Soto and M.L.J. Stiassny. 2006. Freshwater biodiversity:
importance, threats, status and conservation challenges.
Biological Reviews 81: 163-182.
Genito, D., W.J. Gburek and A.N. Sharpley. 2002. Response of stream macroinvertebrates to agricultural land cover in a small watershed. Journal of Freshwater Ecology 17(1):
109-119.
Hellawell, J.M. 1986. Biological indicators of freshwater pol- lution and environmental management. Elsevier Applied Science Publishers, London, England. 546pp.
Kong, D.S., S.H. Son, S.J. Hwang, D.H. Won, M.C. Kim, J.H.
Park, T.S. Jeon, J.E. Lee, J.H. Kim, J.S. Kim, J.H. Park, I.S. Kwak, Y.C. Jun, Y.S. Park, S.A. Ham, J.K. Lee, S.W.
Lee, C.H. Park, J.S. Moon, J.Y. Kim, H.K. Park, S.J.
Park, Y.J. Kwon, P.J. Kim, A.R. Kim. 2018. Development of Benthic Macroinvertebrates Index(BMI) for Biological Assessment on Stream Environment. Journal of Korean Society on Water Environment 34: 183-201.
McNaughton, S.J. 1967. Relationship among functional proper- ties of California Grassland. Nature 216: 168-169.
Merritt, R.W. and K.W. Cummins. 2006. An introduction to the aquatic insects of North America. Dubuque(IA): Hunt Publishing Company. Dubugue.
Ormerod, S.J., M. Dobson, A.G. Hildrew and C.R. Townsend.
2010. Multiple stressors in freshwater ecosystems. Fresh- water Biology 55: 1-4.
States. John Wieley and Sons, Inc: New York.
Pielou, E.C. 1975. Ecological Diversity. Wiley, New York.
Quigley, M. 1977. Invertebrates of Streams and Rivers: A Key to Identification. Edward Arnold: London.
R Core Team, 2016. R: A Language and Environment for Statis- tical Computing. R Foundation for Statistical Computing, Vienna, Austria.
Rosenberg, D.M. and V.H. Resh, 1993. Freshwater biomonitor- ing and benthic macroinvertebrates. Chapman and Hall, New York. 488pp.
Shannon, C.E. and W. Weaver. 1948. A Mathematical Theory of Communication. University of Illinois Press: Urbana.
Shieh, S.H., J.V. Ward and B.C. Kondratieff. 2003. Longitudinal changes in macroinvertebrate production in a stream affect- ed by urban and agricultural activities. Archiv für Hydrobi- ologie 157: 483-503.
Sim, Y.J. 2007. Evaluation of water quality and analysis of ben- thic macroinvertebrate community in Iancheon Stream.
Hanyang Uniersity(Mater thesis).
Vannote, R.L., G.W. Minshall, K.W. Cummins, J.R. Sedell and
dian Journal of Fisheries and Aquatic Sciences 37: 130- 137.
Wallace, J.B. and J.R. Webster. 1996. The role of macroinver- tebrates in stream ecosystem function. Annual Review of Entomology 41: 115-139.
Wright, J.F., D.W. Sutcliffe and M.T. Furse. 2000. Assessing the biological quality of fresh waters: RIVPACS and other techniques. Freshwater Biological Association, Ambleside, UK, p. 400.
WWF, 2012. Living Planet Report 2012. World Wide Fund for Nature, Gland.
Yun, I.B. 1988. Illustrated Encyclopedia of Fauna and Flora of Korea. Aquatic Insects, vol. 30. Ministry of Education:
Seoul.
Zhang, Y., R. Zhao, W. Kong, S. Geng, C.N. Bentsen and X. Qu.
2013. Relationships between macroinvertebrate communi- ties and land use types within different riparian widths in three headwater streams of Taizi River, China. Journal of Freshwater Ecology 28: 307-328.