Ansan P.O. Box 29, Seoul 425-600, Korea
2Physical Oceanography Division, FIO Qingdao 266-061, China
Abstract : Semi-diurnal internal tides and near-inertial waves are investigated using moored current meter measurements at four sites along the shelf break of the East China Sea during August 1987 and May-June 1988. Each mooring is equipped with four current meters spanning from near surface to near bottom.
Spectral analyses of all current data reveal dominant spectra at the semi-diurnal frequency band, where the upper and lower current measurements show out-of-phase relationship between them with significant coherences. These are consistent with typical characteristics of the first-mode semi-diurnal internal tide.
Strong intensification of the near-bottom baroclinic currents is observed only at one site, where the ratio of the bottom slope to the slope of the internal-wave characteristics at the semi-diurnal frequency is close to unity. An energetic near-inertial wave event is observed during the first half of May-June 1988 observation at two mooring sites. Rotary spectra reveal that the most dominant signal is clockwise rotating motion at the near-inertial frequency band. Upward phase and downward energy propagations, shown in time-depth contour plots of near-inertial bandpass filtered currents, are confirmed by cross correlations between the upper- and lower-layer current measurements. The upward-propagating phase speed is estimated to be about 0.13 cm s−1 at both sites. Significant coherences and in-phase relationships of near-inertial currents at the same or similar depths between the two sites are observed in spite of their long distance of about 110 km.
Key words : semi-diurnal internal tide, near-inertial wave, East China Sea, current mooring
1. Introduction
The East China Sea (ECS) is a marginal sea located between Korea, China, and Japan. It has a wide contin- ental shelf in the northwestern side which connects to a deep trough in the southeastern side through a steep continental slope (Fig. 1). In the ECS, semi-diurnal tides are stronger than diurnal tides with predominance of the onshore tidal currents (Choi 1980; Larsen et al. 1985).
Baines (1982) predicted that the ECS continental slope is one of the energetic internal tide generation regions in the global ocean. Using full three-dimensional numerical simulations, Niwa and Hibiya (2004) showed that ener-
getic barotropic-to-baroclinic conversion of M2 tidal energy distributes along the continental shelf break in the ECS.
Using data from an underwater sliding vehicle and a shipboard acoustic Doppler current profiler (ADCP), Kuroda and Mitsutera (1995) investigated the structures of internal tides near the ECS shelf break. Matsuno et al.
(1997) studied the small scale internal waves near the ECS shelf break and turbulent fluctuations near the bottom from current data collected for a few days. How- ever, internal wave studies using relatively long-term cur- rent moorings (> 2 weeks) are rare in the ECS probably because of the frequent fishing activity which prevents moorings from being safely retrieved.
Near-inertial waves (NIWs) are a ubiquitous physical
*Corresponding author. E-mail : [email protected]
process which can be observed in continental shelf re- gions, open oceans, enclosed basins and large lakes widely in the world (e.g., Kunda 1976; Millot and Crepon 1981; Baines 1986; Lie 1988; Park and Watts 2005; Park et al. 2010). The characteristics of NIWs are summarized briefly as follows: 1) The spectral peak is very close to the local inertial frequency, but generally slightly above (blue shift). 2) The horizontal velocity vector rotates clock- wise in the Northern Hemisphere. 3) Vertical coherence scales are of the order of a few tens of meters, whereas the horizontal coherence scales are of the order of a few
tens of kilometers. 4) The oscillations are intermittent and last only a few periods. 5) There is a correspondence between the passage of storms and the NIW events in the surface layer. 6) Wind-induced NIWs show upward (down- ward) propagation of phase (energy).
In this study, we present current measurements dom- inated by semi-diurnal and diurnal variations from four moorings deployed along the ECS shelf break. Each mooring is equipped with four current meters spanning from near surface to near bottom. We show the semi- diurnal current variations agree with characteristics of the first-mode baroclinic internal tide, and diurnal current variations are caused by NIWs. Vertical and horizonal scales of NIWs and their possible energy source will be discussed.
2. Data and Methods
Moored current meter measurements were conducted at four sites along the ECS shelf break during August 1987 and May-June 1988 (Fig. 1). At each site, the current data were recorded every 30 minutes at four depths.
Locations, depths, and mooring periods are summarized in Table 1. During the current measurements, conductiv- ity-temperature-depth (CTD) surveys were also conducted along several sections across the shelf break, and some of them coincide with mooring sites. Temperature and salin- ity profiles collected on July 24 and August 2, 1987, and May 4 and June 6, 1988 are used to estimate the buoy- ancy frequency (N) profiles at the four mooring sites.
Details on the mooring and CTD survey data are found in Song et al. (1989) and Guo et al. (1989).
Holloway (1983; 1984; 1985) estimated the barotropic and baroclinic currents using current data measured at three or four depths in the Australian North-West Shelf and showed the major characteristicsof semi-diurnal internal tides. To estimate the baroclinic currents we here utilize the method of Holloway as follows. First the Fig. 1. Locations of four current meter moorings indicated
by open red circles for C2 and C3 and blue pluses for C6 and C7. A black cross indicates the NCEP wind data position. Bottom topography is color contoured using 30-second high resolution SRTM 30 PLUS global topography data obtained from web site http://topex.ucsd.edu/WWW html/srtm30 plus.html
Table 1. Depths, locations, and observation periods of current meter moorings Mooring (current meter depth: m) Location
Observation period (interval)
Lat. Lon.
C2 (20,50,90,125) 29o21'N 127o09'E 08/04-08/22/1987 (30 min) C3 (20,50,80,135) 30o05'N 127o34'E 08/05-08/26/1987 (30 min) C6 (20,50,80,118) 30o05'N 127o32'E 05/18-06/06/1988 (30 min) C7 (20,50,90,145) 31o00'N 128o00'E 05/19-06/06/1988 (30 min)
barotropic currents are estimated by depth average of the observed currents at four depths. After that, the baroclinic currents are obtained by the residuals from the estimated barotropic currents. In addition, we use a natural coordin- ate system (cross-slope and along-slope) for the velocity components by rotating the coordinates 40 degrees clockwise. Thus, positive values of u and v denote south- eastern cross-slope and northeastern along-slope currents, respectively.
Spectral analysis including rotary spectra is applied to the current records using block averaging in the fre- quency domain to increase the confidence of spectral esti- mations (Emery and Thomson 2001). Time series of cur- rents were divided into equal-length blocks, each block having 128 data points, corresponding 2.67 days. The final result is expressed as the ensemble-average spectra of all blocks. All spectral analyses in this study are carried out using the same procedure. The coherences and phase differences are computed for pairs of current measure- ments at different depths at each mooring and for pairs of current measurements at the same or similar depth between C2 and C3 and between C6 and C7.
It is difficult to differentiate diurnal tidal currents and NIWs from our short-period current measurements, because the inertial frequencies at C6 and C7 (0.0417
and 0.0429 cph, respectively) and the frequencies of diurnal tides (0.0418 and 0.0387 cph for K1 and O1, respectively) are too close to be resolved in our spectral analysis. Two frequency bands centered at 1/(12.8 h) (0.078 cph) and 1/(25.6 h) (0.039 cph) are picked as the semi-diurnal and inertial frequency bands, respectively.
We carry out a filtering procedure to extract the oscil- lating variabilities of currents at the inertial frequency band. We use a third-order bandpass Butterworth filter with cutoffs at 22 and 26 h. The filtering is carried out in the forward direction, and then the filtered sequence is reversed and run again through the filter in order to eliminate all phase shifts (Emery and Thomson, 2001).
Wind stress data from the NCEP/DOE AMIP-II Reanalysis (Reanalysis-2) product with 6-hour interval and ~2-degree resolution are used to investigate the NIW generation forcing. Inertial currents in the mixed layer are computed using a damped slab model applying correction for the finite sampling interval of wind stress (Niwa and Hibiya, 1999). For this computation, the decay time scale of inertial currents and the mixed-layer depth are set to constant values of 4 days and 30 m, respectively.
3. Results
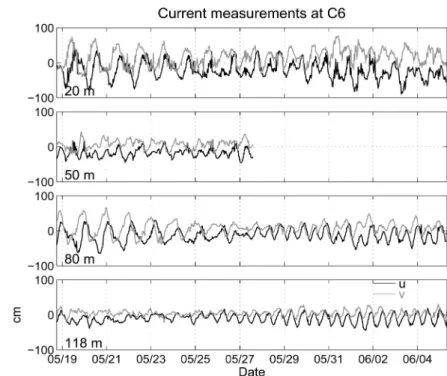
Fig. 2. Time series of currents at four level (20, 50, 80, and 118 m) observed at mooring C6. u-and v-components are plotted by black and gray lines, respectively
Semi-diurnal barotropic tidal currents are more domin- ant than diurnal barotropic tidal currents in the ECS as mentioned above. However, current records at C6 shown in Fig. 2 reveals interesting features. The currents at 20 and 80 m reveal energetic semi-diurnal and diurnal fluc- tuations, while those at 50 and 118 m show much smaller ones. The first half of current records during May 18-28 show predominance of diurnal variations at 20 and 80 m, but not at 50 and 118 m. During May 28-June 6, the diurnal variations reduce significantly at 20 and 80 m.
Current records at C7 also show dominant diurnal vari- ations at 20 and 90 m during the first half like C6 (not shown). These results indicate that the vertical structure of the observed currents is dominated by baroclinic vari- ations, and the diurnal fluctuations are not caused by diurnal tides.
Semi-diurnal internal tides
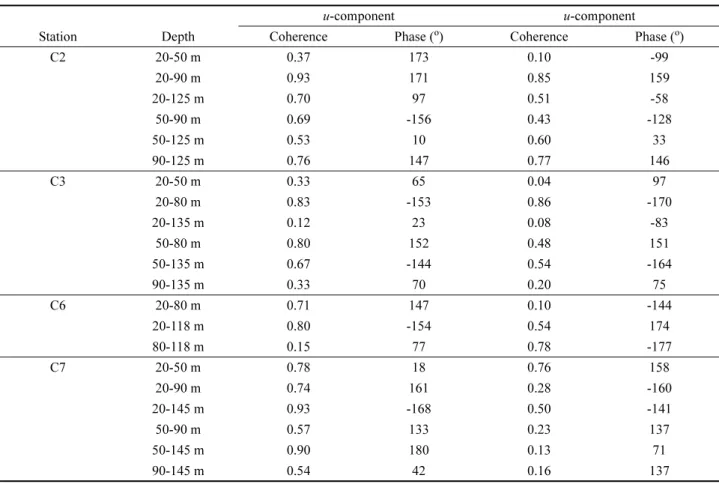
Table 2 lists coherences and phase lags at the semi- diurnal frequency band (1/12.8 cph) between two different
depths at each current mooring site. Coherences of cross- slope currents between 20 and 90 m at C2 and 20 and 145 m at C7 show the maximum values of 0.93. Coher- ences of cross-slope currents between the upper and lower layers at C3 and C6 are equal or larger than 0.8. All of these highly coherent pairs show out-of-phase relation- ships. Overall, coherences of cross-slope currents show higher values than those of along-slope currents, and coherences between upper and intermediate or intermedi- ate and lower layers are relatively low.
From boussinesq momentum equation, a well-known propagating internal wave equation can be obtained (Phillips 1977; Munk 1981). For propagating internal waves of the form (z)ei(kx−σt), the vertical displacements are described by
(1) where k is the horizontal wave number, σ the frequency of internal wave, f the Coriolis parameter, z the vertical
d2ζ dz2
--- k2 N2( ) σz – 2 σ2–f2 ---
⎝ ⎠
⎜ ⎟
⎛ ⎞
ζ
+ = 0
Table 2. Coherences and phases of the baroclinic currents between two different depths at the semi-diurnal frequency band (1/12.8 cph). Coherence larger than 0.45 fulfills 95% confidence level. Positive value of phase indicates the first one leads the second one
u-component u-component
Station Depth Coherence Phase (o) Coherence Phase (o)
C2 20-50 m 0.37 173 0.10 -99
20-90 m 0.93 171 0.85 159
20-125 m 0.70 97 0.51 -58
50-90 m 0.69 -156 0.43 -128
50-125 m 0.53 10 0.60 33
90-125 m 0.76 147 0.77 146
C3 20-50 m 0.33 65 0.04 97
20-80 m 0.83 -153 0.86 -170
20-135 m 0.12 23 0.08 -83
50-80 m 0.80 152 0.48 151
50-135 m 0.67 -144 0.54 -164
90-135 m 0.33 70 0.20 75
C6 20-80 m 0.71 147 0.10 -144
20-118 m 0.80 -154 0.54 174
80-118 m 0.15 77 0.78 -177
C7 20-50 m 0.78 18 0.76 158
20-90 m 0.74 161 0.28 -160
20-145 m 0.93 -168 0.50 -141
50-90 m 0.57 133 0.23 137
50-145 m 0.90 180 0.13 71
90-145 m 0.54 42 0.16 137
coordinate and N the buoyancy frequency, defined as
where g is the gravity and ρ the water density. The solutions of equation (1) can be obtained by solving the eigenvalue problem with boundary conditions defined as ζ = 0 at z = 0 and z = −H, where H is the water depth.
From the solution of (1), the horizontal velocity is obtained as
Fig. 3 shows an example of the modal structures of vertical displacements and horizontal currents for the first three modes computed using a CTD profile collected at C7 on June 6, 1988, the last day of current measurements.
The modal structures computed using hydrocasts at other moorings are similar to those shown in Fig. 3 (not shown).
The observed out-of-phase relationships of semi-diurnal baroclinic currents between upper and lower layers is consistent with the estimated first baroclinic-mode struc- ture. This suggests that the first baroclinic-mode semi- diurnal internal tides are dominant in this region.
Harmonic analysis of baroclinic currents at M2 tidal
N g
ρ--- ∂ρ ---∂z
⎝– ⎠
⎛ ⎞1 2⁄
=
u σ
---kdζ dz---
=
Fig. 3. Left panel shows a temperature profile obtained at C7 on June 6, 1988. Right three panels show the first three dynamic modes for vertical displacements and horizontal currents computed at C7
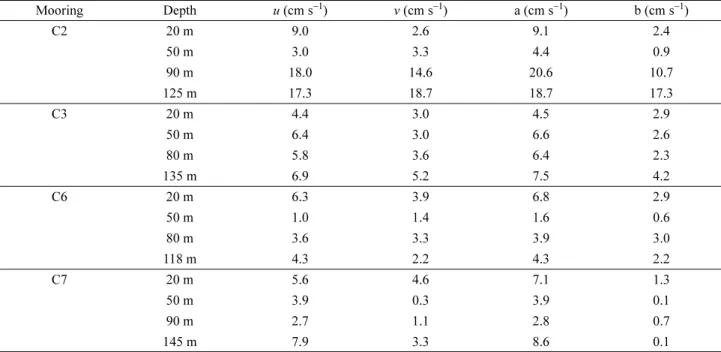
Table 3. Harmonic constants of baroclinic currents at M2 tidal frequency (1/12.42 cph). Here the u-and v-components of currents indicate the south-northward and east-westward,respectively.a and b is the major and minor axes of tidal ellipses (from Lie et al. 1996)
Mooring Depth u (cm s−1) v (cm s−1) a (cm s−1) b (cm s−1)
C2 20 m 9.0 2.6 9.1 2.4
50 m 3.0 3.3 4.4 0.9
90 m 18.0 14.6 20.6 10.7
125 m 17.3 18.7 18.7 17.3
C3 20 m 4.4 3.0 4.5 2.9
50 m 6.4 3.0 6.6 2.6
80 m 5.8 3.6 6.4 2.3
135 m 6.9 5.2 7.5 4.2
C6 20 m 6.3 3.9 6.8 2.9
50 m 1.0 1.4 1.6 0.6
80 m 3.6 3.3 3.9 3.0
118 m 4.3 2.2 4.3 2.2
C7 20 m 5.6 4.6 7.1 1.3
50 m 3.9 0.3 3.9 0.1
90 m 2.7 1.1 2.8 0.7
145 m 7.9 3.3 8.6 0.1
frequency (1/12.42 cph) conducted by Lie et al. (1996) reveals the strongest amplitudes in the lower layer (90 and 125 m) at C2 (Table 3), which are larger than that of 20 m at the same site and those of near-bottom currents at other sites by factors of about two to five on average.
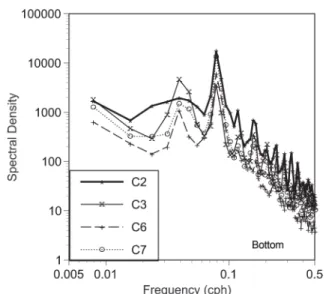
Correspondingly, the spectral density of near-bottom cross-slope baroclinic currents at C2 reveals the highest peak at the semi-diurnal frequency band as shown in Fig.
4. These results imply that the semi-diurnal internal tides at C2 are intensified in the lower layer.
The intensification of near-bottom internal tidal currents occurs in a region where the internal wave characteristics agrees with the local bottom slope (e.g., Huthnance and Baines 1982; Holloway 1985; Kuroda and Mitsudera 1995; Park and Watts 2006). The internal wave charac- teristics, the slope of internal wave energy propagation direction, is defined as (Baines 1982)
(2)
At each mooring site, the bottom slope (s) is calculated using the 30-second high-resolution global topography data (SRTM30 PLUS obtained from http://topex.ucsd.edu/
WWW_html/srtm30_plus.html). The near-bottom N, s, c and s/c are summarized in Table 4. Fig. 1 shows that the site C2 is located near the steepest bottom slope among
c σ2–f2 N2–σ2 ---
⎝ ⎠
⎜ ⎟
⎛ ⎞1 2⁄
±
= Fig. 4. Spectral density of cross-slope near-bottom cur-
rents observed at all four sites. The 95% con- fidence factors are (0.59, 2.09)
Table 4. Buoyancy frequency(N) near bottom, bottom slope(s), and slope of the semi-diurnal internal wave characteristics(c) calculated at C2, C3, C6, and C7
Mooring N s c s/c
C2 0.0177 0.0064 0.0068 0.94
C3 0.0166 0.0046 0.0072 0.64
C6 0.0129 0.0040 0.0093 0.43
C7 0.0134 0.0028 0.0090 0.31
Fig. 5. Clockwise (thick line) and counterclockwise (thin line) spectra of current velocities at (a) 20; (b) 80; (c) 118 m of mooring C6. The 95% confidence factors are (0.59, 2.09)
the four mooring sites, and hence it has the largest s. The s/c values are less than unity at all sites, yet the ratio s/c at C2 is 0.94 close to unity. This accounts for the observed intensification of semi-diurnal internal tides in the lower layer at C2.
Near-inertial waves
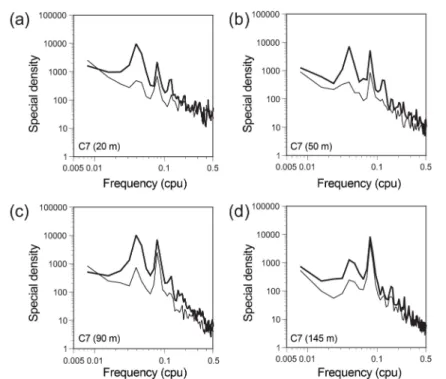
Rotary spectra of currents at C6 and C7 show signifi- cant spectral peaks at the diurnal frequency band (Figs. 5 and 6). They reveal predominant energy density in the clockwise rotational component than in the counterclock-
wise one. The clockwise peaks at the diurnal frequency are higher than those at the semi-diurnal frequency except near-bottom current spectra. Diurnal tidal currents in the ECS shelf break is less than 10 cm s−1 (Choi 1980;
Larsen et al. 1985) and should be less energetic than the semi-diurnal tidal currents. Therefore, the remarkable clockwise spectra at the diurnal frequency are most prob- ably caused by the NIWs.
In order to assess the existence of NIWs, we examine the coherences and phases of the baroclinic currents at the diurnal frequency. Table 5 shows the results between Fig. 6. Clockwise (thick line) and Counterclockwise (thin line) spectra at (a) 20; (b) 50; (c)90; (d)145 m of mooring C7.
The 95% confidence factors are (0.59, 2.09)
Table 5. Coherences and phases of baroclinic currents between two different depths of C6 and C7 at the diurnal frequency band (1/25.6 cph). Coherence larger than 0.45 fulfills 95% confidence level. Positive value of phase indicates the first one leads the second one
u-component u-component
Station Depth Coherence Phase (o) Coherence Phase (o)
C6 20-80 m 0.97 170 0.97 173
20-118 m 0.68 -145 0.61 -151
80-118 m 0.46 51 0.39 46
C7 20-50 m 0.09 157 0.17 -117
20-90 m 0.80 146 0.66 136
20-145 m 0.57 -137 0.39 -134
50-90 m 0.27 156 0.27 -124
50-145 m 0.53 -147 0.47 177
90-145 m 0.17 79 0.01 91
two different depths at C6 and C7. The coherences are significantly high for pairs of 20-80 m at C6 and 20-90 m at C7 with out-of-phase relationships. This corresponds to a baroclinic first-mode structure, one of the typical NIW characteristics in the continental shelf region when a seasonal thermocline is well developed there (e.g., Baines 1986; Jacobs et al. 2001). The currents at the same or similar depths between C6 and C7 also show signifi- cantly high values (Table 6). Unlike the vertical compari- sons, the phase lags are small at the same or similar depths between C6 and C7 though their distance is about 110 km. These results support that an energetic NIW event with a horizontal scale larger than 110 km co- existed at C6 and C7 during the observational period.
The phase of wind-induced NIWs propagates upward
and their energy propagates downward throughout the water column (e.g., Kundu 1976; Leaman 1976; Lie 1988).
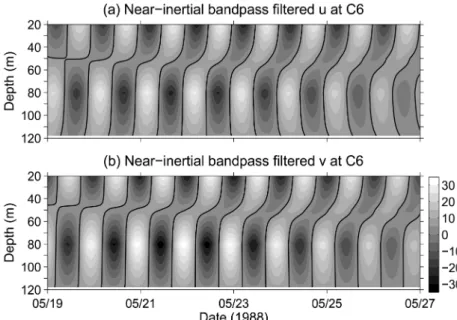
In order to examine the properties of vertical propagation, contour plots of near-inertial bandpass filtered u and v at C6 are constructed during the first half of observation using the four-depth records (Figs. 7a and 7b). The plots in Fig. 7 show the evolution of the horizontal current fields at the near-inertial frequency as time progresses.
They show clear features of upward-propagation of phase with time. In addition, a downward propagation of wave packet is also seen in both contour plots, which indicates the downward energy propagation of NIWs.
The downward (upward) energy (phase) propagation indicates that the energy source of the NIWs is the upper ocean, which means the observed NIWs were generated by winds (e.g., Pollard 1970; Gonella 1971; Kundu 1976;
Anderson et al. 1983; Chen et al. 1996). Time series of wind stress near C6 from the NCEP/DOE Reanalysis-2 product reveal that a sudden wind event occurred on May 18-19, 1988 (Fig. 8a), when the currents at C6 and C7 showed an NIW development. Time series of the predicted mixed-layer NIWs using a damped slab model show a corresponding NIW event staring from May 19 (Fig. 8b). The amplitudes of predicted NIWs are com- parable with those of observed NIWs at 20 m of C6 (dashed line in Fig. 8b), which supports that the sudden wind event can be the energy source of the NIWs observed at C6 and C7.
Table 6. Coherences and phases of the baroclinic currents between C6 and C7 at the diurnal frequency band (1/25.6 cph). Coherence larger than 0.45 fulfills 95% confidence level. Positive value of phase indicates the first one leads the second one
u-component u-component Series Coherence Phase (o) Coherence Phase (o) C6-20 m &
C7-20 m 0.71 36 0.84 -3
C6-80 m &
C7-90 m 0.62 0 0.68 -39
C6-118 m &
C7-145 m 0.81 105 0.75 9
Fig. 7. Time-depth contour plots of the near-inertial bandpass filtered currents of (a) u-and; (b) v-components.
Superimposed thick contours indicate u and v = 0
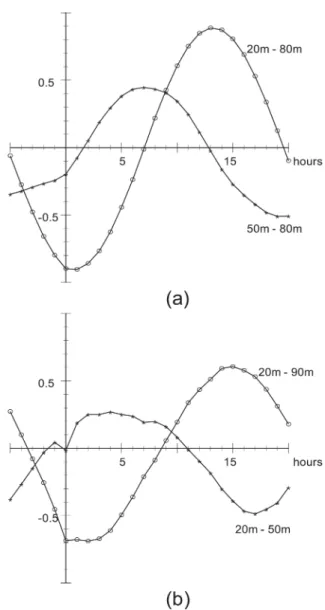
Lagged cross-correlation functions between two differ- ent depths are calculated using the first half of current records to estimate the phase speed of upward phase propagation according to
(3)
where τ indicates the time lag between two time series of currents, u1 and u2. Fig. 9 shows the cross correlation functions between the upper three depths at C6 and C7.
The time lags between 20 and 50 m at C6 and C7 are about 7 and 4 hours, respectively. However, maximum values of the cross correlations are smaller than 0.5 at both sites. Between 20 and 80 m at C6, and between 20 and 90 m at C7, the cross correlations show maximum values of 0.9 and 0.6 with the time lags of about 13 and 15 hours, respectively. The positive time lag indicates that the deeper current in each pair leads the shallower one, consistent with the contour plots shown in Fig. 7. The vertical phase speeds of NIWs at C6 and C7 show almost the same values of about 0.13 cm s−1.
4. Summary
Semi-diurnal internal tides were observed at the ECS
shelf break from current measurements during August 1987 and May-June 1988. The cross-slope baroclinic cur- rents in the upper and lower layers were highly correl- ated with out-of-phase at the semi-diurnal frequency, which is explained by the first baroclinic modal structure. The ratio was between the bottom slope and internal wave characteristics at C2 was close to unity and consistently a strong bottom intensification was observed there.
Energetic NIWs were detected in current observations at C6 and C7 during late-May 1988. Rotary spectra revealed that the currents were dominated by clockwise rotation at the diurnal frequency. High coherences and out-of-phase relations were estimated at both u- and v- components between 20 and 80 m at C6 and between 20 and 90 m at C7. Currents at the same or similar depths between C6 and C7 showed high coherences and in- phase relationships at the near-inertial frequency in spite of their long distance of about 110 km. Contour plots of near-inertial bandpass filtered currents and lagged correl- ation functions showed upward phase propagation with phase speed of about 0.13 cm s−1. A damped slab model predicted that a sudden wind event at the beginning of current observations would be the energy source of the observed NIWs.
In the ECS, distinct fronts are formed by abundant C( )τ
∑
u1(t+τ)u2( )tu1( )t 2
∑ ∑
u2( )t 2---
=
Fig. 8. (a) Time series of wind stress at 29.5oN, 129.5oE from the NCEP/DOE Reanalysis-2 product; (b) Time series of inertial currents in the mixed layer predicted using the wind stress data. Dashed line represents u-component of inertial currents observed at 20 m of C6
land-origin fresh waters discharged from China and the salty Kuroshio waters (Lie and Cho 2002). The observa- tions discussed in this study suggests that high-frequency perturbations caused by such as semi-diurnal internal tides and NIWs are expected to make significant influences on exchanges between the shelf and Kuroshio waters in this region.
Acknowledgements
This work is supported by KORDI grant PE98561, PE98563, and PE98652.
References
Anderson I, Huyer A, Smith RL (1983) Near-inertial motions off the oregon coast. J Geophys Res 88:5960- 5972.
Baines PG (1982) On internal tide generation models. Deep- Sea Res 29:307-338
Baines PG (1986) Internal tides, internal waves, and near inertial motions. In: Mooers C (ed) Baroclinic processes on continental shelves. American Geophysical Union, Washington DC, pp 19-32
Chen C, Reid RO, Nowlin WD (1996) Near-inertial oscillations over the Texas-Louisiana shelf. J Geophys Res 101:3509-3524
Choi BH (1980) A tidal model of the Yellow Sea and the Eastern China Sea. KORDI, Ansan, 72 p
Emery WJ, Thomson RE (2001) Data analysis methods in physical oceanography, 2nd edn. Elsevier, Amsterdam, 638 p
Gonella J (1971) Alocal study of inertial oscillations in the upper layers of the ocean. Deep-Sea Res 18:775-788 Guo BS, Xiu H, Ishii H, Nakamura Y (1989) Kuroshio
warm filament and source of warm water of the Tsushima Current. In: Proceedings of Japan China joint symposium of the cooperative study on the Kuroshio, Tokyo, 14-16 Nov 1989, pp 112-127
Holloway PE (1983) Internal tides on the australian north- west shelf: a preliminary investigation. J Phys Oceanogr 13:1357-1370
Holloway PE (1984) On the semidiurnal internal tide at a shelf-break region on the australian northwest shelf. J Phys Oceanogr 14:1787-1799
Holloway PE (1985) A comparison of semidiurnal internal tides from different bathymetric locations on the australian northwest shelf. J Phys Oceanogr 15: 240-251 Huthnance JM, Baines PG (1982) Tidal currents in the
northwest African upwelling region. Deep-Sea Res 29:
285-306
Jacobs GA, Book JW, Perkins HT, Teague WJ (2001) Inertial oscillations in the Korea Strait. J Geophys Res 106(26):943-958
KORDI (1996) Ocean circulation and material flux of the East China Sea (2nd Year) -Eastern East China Sea-.
KORDI report, BSCN 00278-901-1, 378 p
Kundu PK (1976) An analysisof inertial oscillations observed near oregon coast. J Phys Oceanogr 6:879-893 Kuroda Y, Mitsudera H (1995) Observation of internal tides
in the East China Sea with an underwater sliding vehicle. J Geophys Res 100:10801-10816
Fig. 9. (a) Cross correlation functions between 20 and 80 m, and between 50 and 80 m at C6; (b) between 20 and 90 m, and 50 and 90 m at C7 for the u- component currents.
internal waves and turbulent fluctuations near the continental shelf break in the East China Sea. J Oceanogr 53:259-269
Millot C, Crepon M (1981) Inertial oscillations on the continental shelf of the Gulf of lions: observations and theory. J Phys Oceanogr 11:639-657
Niwa Y, Hibiya T (1999) Response of the deep ocean internal wave field to traveling midlatitude storms as observed in long-term current measurements. J Geophys Res 104:10981-10989
Niwa Y, Hibiya T (2004) Three-dimensional numerical simulation of M2 internal tides in the East China Sea. J Geophys Res 109:C04027. doi:10.1029/2003JC001923
Kuroshio extension. J Oceanogr 66:709-717
Phillips OM (1977) The dynamics of the upper ocean, 2nd edn. Cambridge University Press, London, 344 p Pollard RT (1970) On the generation by winds of inertial
waves in the ocean. Deep-Sea Res 17:795-812
Song W, Lin K, Guo B (1989) A study on the source of the Tsushima warm current water. In: Proceedings of Japan China joint symposium of the cooperative study on the Kuroshio, Tokyo, 14-16 Nov 1989, pp 99-111
Received Jul. 18, 2011 Revised Sep. 22, 2011 Accepted Oct. 7, 2011