http://dx.doi.org/10.7848/ksgpc.2014.32.4-1.299
PLEIADES 영상을 활용한 비접근지역의 1/5,000 수치지형도 제작 가능성 평가
Possibility Estimating of Unaccessible Area on 1/5,000 Digital Topographic Mapping Using PLEIADES Images
신진규1)·이영진2)·최해진3)·이준혁4)
Shin, Jin Kyu ·Lee, Young Jin·Choi, Hae Jin·Lee, Jun Hyuk
Abstract
This paper evaluated the possibility for 1/5,000 digital topographic mapping by using PLEIADES images of 0.5m GSD(Ground Sampling Distance) resolution that has recently launched. Those results of check points by applying the initial RPC(Rational Polynomial Coefficient) of PLEIADES images came out as; RMSE of those were X=±1.806m, Y=±2.132m, Z=±1.973m. Also, if we corrected geometric correction using 16 GCP(Ground Control Point)s, the results of RMSE became X=±0.104m, Y=±0.171m, Z=±0.036m, and the RMSE of check points were X=±0.357m, Y=±0.239m, Z=±0.188m; which of those results indicated the accuracy of standard adjustment complied in error tolerances of the 1/5,000 scale. Additionally, we converted coordinates of points, obtained by TerraSAR. for comparing with measurements from GPS(Global Positioning System) surveying. The RMSE of comparing converted and GPS points were X=±0.818m, Y=±0.200m, Z=±0.265m, which confirmed the possibility for 1/5,000 digital topographic mapping with PLEIADES images and GCPs. As method of obtaining GCPs in unaccessible area, however, the outcome evaluation of GCPs extracted from TerraSAR images was not acceptable for 1/5,000 digital topographic mapping. Therefore, we considered that further researches are needed on applicability of GCPs extracted from TerraSAR images for future alternative method.
Keywords : PLEIADES Image, Unaccessible Area, Digital Topographic Map, TerraSAR, Control Point
초 록
본 연구에서는 최근 서비스화 된 PLEIADES의 GSD 0.5m 영상을 이용하여 1/5,000 수치지형도 제작의 가능 성을 평가하였다. PLEIADES 영상의 초기 RPC 계수를 적용한 결과, 검사점에 대한 RMSE가 X=±1.806m, Y=±
2.132m, Z=±1.973m이며, 초기 RPC 계수와 지상기준점 16점으로 기하보정한 결과, RMSE가 X=±0.104m, Y=±
0.171m, Z=±0.036m이며, 검사점에 대한 RMSE는 X=±0.357m, Y=±0.239m, Z=±0.188m로 1/5,000 수치지형 도 제작에 대한 허용오차의 기준에 부합하는 것을 확인할 수 있었다. 또한, TerraSAR 기준점을 평가하여 활용 가 능성 여부를 확인하기 위해 좌표 변환하여 GPS 측량성과와 비교한 결과, RMSE가 X=±0.818m, Y=±0.200m, Z=
± 0.265m의 결과를 도출하였다. 본 연구 결과로 PLEIADES 영상과 정확한 지상기준점을 이용하면 1/5,000 수 치지형도 제작이 가능하다는 것을 확인하였으며, 비접근 지역의 수치지형도 제작을 위한 기준점 확보 방안으로 TerraSAR 기준점을 평가한 결과, 1/5,000 수치지형도를 제작하기 위한 기준점에는 부합하지는 않았지만, 향후 대 안으로써 TerraSAR 기준점을 활용하는 방안에 대하여 추가 연구가 필요하다고 사료된다.
핵심어 : PLEIADES 영상, 비접근 지역, 수치지형도, TerraSAR, 기준점
Received 2014. 04. 18, Revised 2014. 05. 19, Accepted 2014. 06. 22
1) Member, Topography Information Dept., ChungAng AeroSurvey co., LTD (E-mail:[email protected])
2) Corresponding Author, Member, School of Construction Engineering, Kyungil University (E-mail:[email protected]) 3) Member, Woori Gangsan System co., LTD (E-mail:[email protected])
4) Member, Topography Information Dept., ChungAng AeroSurvey co., LTD (E-mail:[email protected])
This is an Open Access article distributed under the terms of the Creative Commons Attribution Non-Commercial License (http://
Original article
1. 서 론
1.1 연구배경
1990년대 중반 이후 고해상도 위성영상의 해상도 규제가 완화됨에 따라 첩보위성기술이 민간으로 이전되어 지상 관 측용 고해상도 위성영상을 상용화하기 시작하였다(Sung et
al., 2004). 특히, 인공위성은 일정한 궤도로 지구의 어떠한지역이라도 제약 없이 영상을 촬영할 수 있어서, 비접근 지 역에 공간정보의 획득을 위한 유용한 자료로 다양하게 이 용되고 있다.
국내에서는 다양한 고해상도 위성영상에 대한 연구가 2000년대 초반 이후 활발하게 진행되어 왔으며, 위성영상의 기하보정 정확도 분석에 대한 연구는 IKONOS 영상이 제공 하는 RPC 계수를 활용한 3차원 지상좌표 추출 알고리즘개 발 (Kang et al., 2003)과 위성영상의 전처리용 RPC 기하보정 모듈개발 (Seo and Lee, 2005), 다른 두 종류의 위성센서인 GeoEye-1과 WorldView-2로부터 RPC 기반의 블록조정 모 델을 구성하여 3차원 위치결정의 정확도를 분석하였다(Choi and Kang, 2012). 고해상도 위성영상을 활용하는 측면의 연 구는 IKONOS 단 영상으로 소축척 수치지형도, 주제도 제작 및 갱신이 가능하고, 입체영상을 활용하여 국가기본도 갱신 이 가능하다고 분석하였으며(Kang et al., 2002), 접경지역의 IKONOS 입체영상과 GPS 측량으로 획득한 지상기준점으 로 정밀기하보정을 수행하고, 입체영상과 디지털해석도화기 를 이용하여 1/5,000 수치지형도 제작이 가능하다고 연구하 였으며 (Sung et al., 2004), QuickBird 단영상과 수치지형도 를 이용하여 건물정보 추출 및 갱신을 위한 방법을 연구하였 다 (Byun et al., 2008).
특히 , 우리나라는 세계적으로 마지막 남은 분단국가로 서 비접근 지역의 지형자료 제작을 2007년부터 2009년까 지 3년간 2.5m급 위성영상을 이용하여 북한 전 지역에 대 해 1/25,000 축척의 지형도 및 정사영상을 제작하였다 (NGII, 2007~2009). 또한, IKONOS, SPOT-5, QuickBird, Kompsat-2 위성영상에 적절한 센서모델링 기법을 적용한 후 영상정합방식으로 DEM을 생성하는 연구를 수행하였으 며 (Jeong et al., 2008), IKONOS-2 영상을 활용하여 세밀한 DEM 제작을 위해 토지피복의 특성에 따른 혼합정합방법을 제시하였다 (Lee et al., 2012).
국외에서는 사진측량 수행을 위한 RFM(Rational Function Model)의 활용에 있어 포괄적인 연구(Tao and Hu, 2001)와 IKONOS 영상에 RFM을 적용하여 오차보정에 관 한 연구(Fraser and Hanley, 2003), 고해상 위성영상에서 발
생하는 편위의 제거를 위해 RPC 기반의 블록조정에 관한 연구 (Grodecki and Dial, 2003)가 수행되었다. 2012년 이후 PLEIADES 영상의 품질분석과 정확도 평가에 대한 연구가 시작되었으며 , 터키의 Zonguldak 테스트지역 영상에 RFM 기법으로 보정한 후 22개 지상기준점에 대한 정확도 평가를 IKONOS, OrbView-3, QuickBird 영상과 비교하였다(Topan
et al., 2013).본 연구에서는 서울지역의 고해상도 PLEIADES 영상과 기준점을 활용하여 기하보정 및 정확도 평가를 수행하고, TerraSAR 영상에서 획득한 기준점에 대해 평가하여, 향후 비접근 지역의 1/5,000 수치지형도 제작에 기준점으로 활용 할 수 있는지 확인하고자 한다.
1.2 연구목적 및 방법
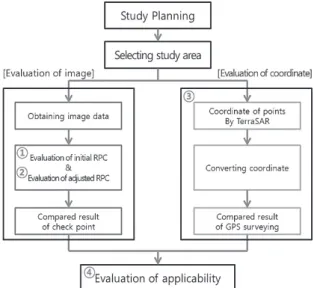
2011년 말부터 0.5m급 고해상도 PLEIADES 영상을 소개 한 후, 정확도 평가를 통하여 연구대상 지역의 1/5,000 수치 지형도 제작의 가능성을 확인하고자 하였고, 향후 비접근 지 역에 대한 수치지형도 제작을 위해 TerraSAR 영상에서 획득 된 기준점에 대하여 정확도 평가를 수행하였다. Fig. 1은 연 구흐름도이며 , 서울시 일원에 대하여 확보된 PLEIADES 영 상과 TerraSAR 영상에서 획득된 기준점에 대하여 평가 및 분석을 하였다.
영상획득 당시의 초기 RPC 계수와 지상기준점 16점으로 기하보정한 후 각각의 입체모델에 대하여 정확도 평가를 수 행하였으며 , 기준점은 GRS80 TM좌표, 정표고로 변환하여
Fig. 1. Flow chart of study
정확도 평가를 수행하였다. 본 연구의 구체적인 방법은 다음 과 같다.
① PLEIADES 영상의 정확도를 평가하기 위하여 영상획 득 당시에 생성된 초기 RPC 계수를 적용하여 입체모델 을 형성한 후 절대정확도 평가 수행.
② 대상지역에 지상기준점 16점을 4×4로 배치하여 기하 보정을 수행하고 입체모델을 형성한 후 절대정확도 평 가 수행.
③ TerraSAR 영상에서 획득한 기준점을 비교하기 위해 GRS80 TM좌표, 정표고로 변환하고, 동일 지점에 대하여 GPS 측량을 수행하여 절대정확도 평가 수행.
④ 정확한 지상기준점으로 기하보정된 PLEIADES 영상 을 이용한 1/5,000 수치지형도 제작 가능성 여부를 평 가하고 , 비접근 지역의 기준점 확보 방안의 대안으로써 TerraSAR 기준점의 활용 가능성 평가.
2. PLEIADES 영상의 소개
PLEIADES 프로젝트는 2001~2003년에 프랑스와 이
탈리아의 ORFEO(Optical and Radar Federated Earth Observation) 조직에 의해 계획되었다.
2003년 10월 프랑스의 국립우주연구센터(CNES; Center National d’Etudes Spatiales)에서 전체 시스템 관리를 수행하 고 있으며, 우주부문은 EADS(European Aeronautic Defence and Space company) ASTRIUM사에서 관리하고 있다.
이는 고해상도의 지구관측위성으로 PLEIADES-1A와 PLEIADES-1B로 구성되어 있으며, 두 위성은 26일 주기로 지구를 관측한다. 영상은 0.5m×0.5m 해상도의 전정색 영상 과 2.0m×2.0m 해상도의 다중분광 영상을 촬영한다. 단 영 상 촬영의 경우 Strip mapping 모드로 100㎞×100㎞, Stereo 영상은 최대 20㎞×280㎞이다.
국제영상판독가능척도 (NIIRS; National Imagery Inter- pretability Rating Scale)의 영상의 판독력을 설명하는 품 질지표 중 NIIRS 6에 해당하며(ASTRIUM, An EADS Company, 2012), 이는 해상도 0.4~0.75m로써 로켓, 군 밀집 부대 등의 식별이 가능하여, 상업용 및 유럽의 방위 목적으로 이용되고 있다. PLEIADES 영상의 제원은 Table 1에 나타내 고 있다(ASTRIUM, An EADS Company, 2012).
Number of Satellites 2, PLEIADES-1A and PLEIADES-1B
Launch PLEIADES-1A(2011.12.16.), PLEIADES-1B(2012.12.02.)
Altitude 694㎞
Type Sun-synchronous
Inclination 98.2°
Cycle 26days
Optical System Aperture diameter of telescope : 65cm focal length : 12.905m, f/20, TMA optics Ground Sample Distance(nadir) Panchromatic : 0.7m / Multispectral : 2.8m Product Resolution Panchromatic : 0.5m / Multispectral : 2.0m
Spectral Bands Pan:0.47-0.83㎛, Blue:0.43-0.55㎛, Green:0.50-0.62㎛, Red:0.59-0.71㎛, NearInfrared::0.74-0.94㎛(NIR)
Swath Width 20㎞ at nadir
Dynamic Range at Acquisition 12bit per pixel
NIIRS Class 6
Viewing Angle Standard : ±30°, Maximum : ±47°
Revisit rate daily(constellation)
Tasking Work plan updated every 8 hours
Processing levels Primary(1A), Ortho(automatic), Tailored Ortho Mission Lifetime Minimum of 5 years~Maximum of 10 year
Table 1. Specifications of PLEIADES images
3. 연구대상 지역 및 자료
3.1 연구대상 지역의 선정
연구대상 지역은 매년 항공사진 촬영을 수행하고, GPS 측 량으로 지상기준점의 확보가 용이한 서울지역이며, 그 영역 은 약 20㎞ × 20㎞로 Fig. 2와 같다.
3.2 영상자료
1/5,000 수치지형도 제작 가능성을 판단하기 위하여 PLEIADES 해상도 0.5m의 Panchromatic 영상을 활용하였 다. Table 2에 영상의 제원을 정리하였으며, Fig. 3은 1개의
위성으로 스테레오영상을 촬영하는 방법과 그 영역을 나타 내고 있다.
3.3 지상기준점 자료
고해상도 PLEIADES 영상의 기하보정 및 정확도 평가를 위해 GPS 측량으로 획득한 지상기준점 16점과 검사점 14점 을 활용하였다. 검사점은 기하보정된 영상의 정확도를 평가 하기 위하여 지상기준점과 중복되지 않도록 배치하여 성과 를 확보하였다. Fig. 4는 지상기준점조서와 점 배치도이며, Table 3은 RFM 보정을 위해 사용할 지상기준점의 좌표를 나타내고 있다.
Sensor PLEIADES
Acquisition date 2013-03-23
Image Type PAN
Spatial Resolution 0.5m
Bits per Pixel per Band 12 bits per pixel Processing Level Primary product
File Format TIFF
Area 20㎞×20㎞
Table 2. Used specifications of PLEIADES images on this study
Fig. 2. Location of study area
Fig. 3. Shooting method and location of PLEIADES images
Fig. 4. Location sheets and GCP layout
4. 실험 및 평가
4.1 PLEIADES 영상의 기하보정 정확도 평가
4.1.1. 초기 RPC 계수 적용
PLEIADES 영상에 대한 기하보정을 위하여 BAE Systems 사의 DPW(Digital Photogrammetric Workstation) 인 SOCET SET 5.4.1을 활용하였다. RFM은 영상촬영 당시
의 대상 공간상에 존재하는 지형지물의 3차원좌표와 이에 대응하는 영상좌표간의 기하관계를 비례다항식의 형태로 표 현하는 모델로 초기 RPC 계수가 제공된다.
Fig. 5는 획득된 영상의 초기 RPC 계수이며, 영상 Import 는 Tiff-RPC 방식을 적용하였다. 초기 RPC 계수를 적용하 여 입체모델을 형성한 후 수치도화기로 검사점의 좌표를 획 득하였으며, Table 4는 검사점의 위치 및 좌표에 대한 예시이
NO X(m) Y(m) Z(m) NO X(m) Y(m) Z(m)
1 ***123.840 ***000.880 91.840 9 ***630.156 ***723.745 37.570 2 ***019.575 ***310.954 183.110 10 ***672.509 ***003.181 9.769 3 ***302.390 ***010.650 42.090 11 ***514.084 ***408.940 18.767 4 ***815.311 ***041.231 21.167 12 ***156.627 ***129.207 28.960 5 ***365.014 ***813.680 39.399 13 ***724.300 ***478.450 11.190 6 ***902.811 ***410.290 106.249 14 ***687.304 ***799.872 40.451 7 ***429.314 ***671.701 18.925 15 ***205.300 ***556.610 13.770 8 ***902.755 ***442.856 19.868 16 ***842.491 ***336.424 38.993
Table 3. Coordinate of GCPs
Check point
x : ***921.108m y : ***828.915m z : 61.249m
x : ***799.87m y : ***687.30m z : 40.45m
x : ***202.20m y : ***681.32m z : 60.38m Table 4. Location of check point and coordinate outcome
Fig. 5. Initial RPC of PLEIADES images
Fig. 6. Error vector of geometric correction using initial RPC
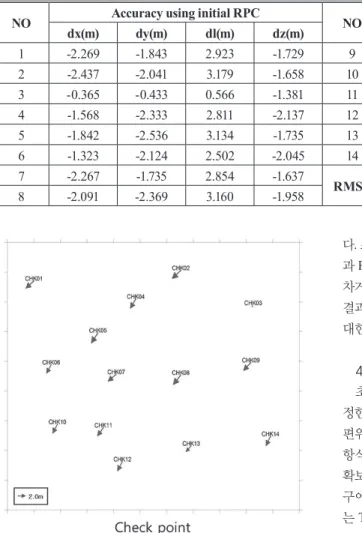
다. 초기 RPC 계수를 적용하여 검사점의 정확도를 평가한 결 과 RMSE가 X방향으로 ±1.806m, Y방향으로 ±2.132m, 오 차거리로 ±2.794m, Z방향으로 ±1.973m로 Table 5와 같은 결과를 얻었으며, Fig. 6은 초기 RPC 계수를 적용한 영상에 대한 검사점의 오차벡터를 나타내고 있다.
4.1.2. 지상기준점을 활용한 기하보정
초기 RPC 계수만을 적용한 결과는 검사점에 대하여 일 정한 방향으로 편위(bias)가 발생하였다. 본 연구에서는 이 편위(∆p,∆r)를 보정하기 위해서 RPC 분수함수다항식에 다 항식 2차식을 사용한 Eq. (1)과 Fig. 7과 같이 GPS 측량으로 확보된 16점을 이용하여 편위를 제거하였다. Eq. (1)은 본 연 구에서 사용한 관측방정식이며(Sung, et al., 2014), 그 결과 는 Table 6과 같이 RMSE가 X방향으로 ±0.104m, Y방향으 로 ±0.171m, 오차거리로 ±0.200m, Z방향으로 ±0.036m로 나타났다.
NO Accuracy using initial RPC
NO Accuracy using initial RPC
dx(m) dy(m) dl(m) dz(m) dx(m) dy(m) dl(m) dz(m)
1 -2.269 -1.843 2.923 -1.729 9 -2.016 -1.967 2.817 -1.941 2 -2.437 -2.041 3.179 -1.658 10 -1.294 -2.261 2.605 -1.805 3 -0.365 -0.433 0.566 -1.381 11 -1.659 -2.091 2.669 -2.327 4 -1.568 -2.333 2.811 -2.137 12 -1.383 -2.329 2.709 -1.974 5 -1.842 -2.536 3.134 -1.735 13 -1.451 -1.484 2.075 -1.985 6 -1.323 -2.124 2.502 -2.045 14 -1.242 -2.310 2.623 -2.104 7 -2.267 -1.735 2.854 -1.637
RMSE 1.806 2.132 2.794 1.973
8 -2.091 -2.369 3.160 -1.958
Table 5. Check point accuracy evaluation of geometric correction using initial RPC
Fig. 7. Step of geometric correction using GCPs
(a) Image import (b) Observation GCPs (C) Result
l
․
․
․
․
(1)
Where, l
․
․
,
․
․
, l, s : normalized
image coordinate,
․
․
: line offset, sample offset,
․
․
: line scale, sample scale U, V, W: normalized ground coordinate(latitude, longitude, height), Line, Sample : image coordinate, ∆p = a
0 + a1 Line2 +a2 Line·Sample+ a3 Sample2 +a4 Line+ a5 Sample, ∆r = b0 + b1 Line2 +b2 Line·Sample+ b3 Sample2 +a4 Line+ b5 Sample, a1, a
2, a
3, a
4, a
5: image adjustment parameter.
NO Accuracy for Geometric correction
NO Accuracy for Geometric correction
dx(m) dy(m) dl(m) dz(m) dx(m) dy(m) dl(m) dz(m)
1 0.046 0.286 0.290 -0.011 10 -0.036 -0.152 0.156 0.009
2 0.129 -0.304 0.330 -0.028 11 0.143 0.263 0.299 -0.032
3 0.009 0.021 0.023 0.007 12 -0.086 -0.068 0.110 0.013
4 -0.033 -0.153 0.157 0.002 13 -0.159 -0.089 0.182 0.058
5 0.159 -0.146 0.216 -0.061 14 -0.047 0.080 0.093 0.055
6 0.022 0.037 0.043 0.009 15 0.088 0.195 0.214 -0.010
7 -0.058 -0.043 0.072 0.011 16 -0.119 -0.188 0.222 0.040
8 -0.157 0.118 0.196 0.045 RMSE 0.104 0.171 0.200 0.036 9 0.095 0.141 0.170 -0.058
Table 6. Result of geometric correction using GCPs
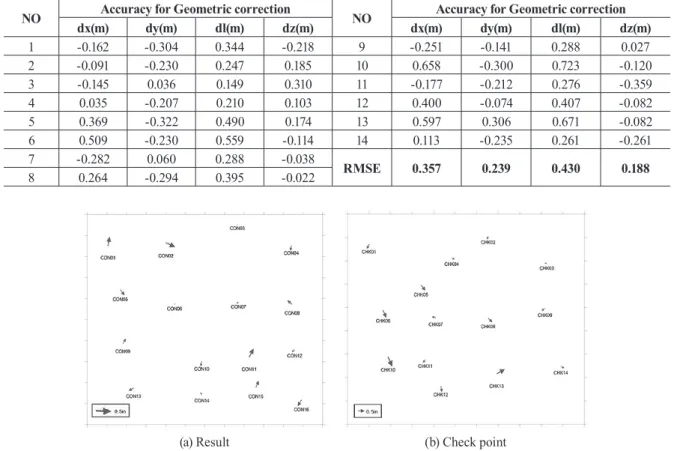
NO Accuracy for Geometric correction
NO Accuracy for Geometric correction
dx(m) dy(m) dl(m) dz(m) dx(m) dy(m) dl(m) dz(m)
1 -0.162 -0.304 0.344 -0.218 9 -0.251 -0.141 0.288 0.027 2 -0.091 -0.230 0.247 0.185 10 0.658 -0.300 0.723 -0.120 3 -0.145 0.036 0.149 0.310 11 -0.177 -0.212 0.276 -0.359 4 0.035 -0.207 0.210 0.103 12 0.400 -0.074 0.407 -0.082 5 0.369 -0.322 0.490 0.174 13 0.597 0.306 0.671 -0.082 6 0.509 -0.230 0.559 -0.114 14 0.113 -0.235 0.261 -0.261 7 -0.282 0.060 0.288 -0.038 RMSE 0.357 0.239 0.430 0.188 8 0.264 -0.294 0.395 -0.022
Table 7. Check point accuracy evaluation of geometric correction using GCPs
(b) Check point (a) Result
Fig. 8. Error vector of geometric correction using GCPs
보정된 RPC 계수를 적용하여 입체모델을 형성한 후 검 사점 14점에 대하여 정확도 평가를 수행한 결과, RMSE가 X방향으로 ±0.357m, Y방향으로 ±0.239m, 오차거리로
± 0.430m, Z방향으로 ±0.188m로 Table 7과 같은 결과를 얻 었으며 , Fig. 8은 기준점을 활용하여 기하보정한 결과와 검사 점에 대한 오차벡터를 나타내고 있다.
4.2 TerraSAR Point 평가
고해상도 위성영상으로 비접근 지역의 1/5,000 수치지형 도를 제작하기 위해서는 기하보정에 이용할 정확한 기준점 의 확보가 중요하나, 비접근 지역에서는 직접 측량을 수행할 수 없기 때문에 대안으로써 TerraSAR 영상에서 획득된 점 을 지상기준점으로 활용하는 방안에 대해 검토하고자 한다.
Fig. 9와 같이 독일의 TerraSAR 영상에서 간접 방법으로 5 개의 지상기준점을 획득하였다. TerraSAR 영상의 촬영 시기 는 2013년 9~10월, 해상도는 1m급, 최종 좌표 획득은 2013년 10월이다. Table 8은 간접 방법으로 획득한 지상기준점의 좌표 이며 , 수평좌표 x, y는 UTM(Universal Transverse Mercator), 수직좌표 z는 타원체고(ITRF 2008 Ellipsoid)이다.
간접 방법으로 산출된 지상기준점의 좌표를 평가하기 위하 여 조서를 참고하여 동일한 지점에 GPS 측량을 수행하였다.
Fig. 10은 제공된 조서와 GPS 측량을 수행하는 현장사진이다.
TerraSAR 영상에서 획득된 기준점을 현지 GPS 측량성과 와 비교하기 위하여 Fig. 11과 같이 국토지리정보원의 좌표변 환 도구를 이용하였다. 수평위치 x, y는 NGI Pro 2.54 좌표변 환 프로그램으로 GRS80 TM 좌표로 변환하였으며, 수직위 치 z는 수직기준변환서비스로 지오이드고(N)를 산출한 후 Fig. 9. Sample image of TerraSAR
NO E(X) N(Y) Z(h)
1 ***052.388 ***8601.851 43.961 2 ***359.968 ***1691.372 71.749 3 ***215.555 ***1755.839 39.315 4 ***945.207 ***8868.841 48.455 5 ***138.225 ***0033.463 44.637 Table 8. Reference points obtained by TerraSAR
Fig. 10. A GCP location sheet of TerraSAR and a field photo of GPS surveying
Fig. 11. Coordinate transformation tools
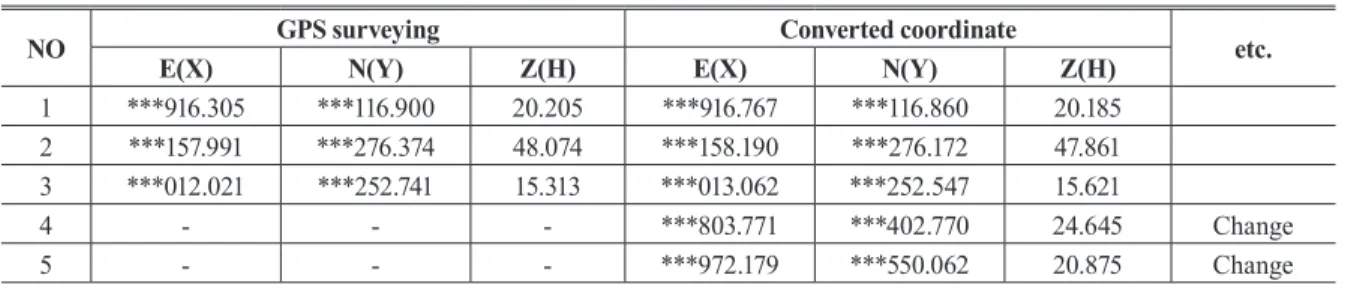
정표고 (H)를 구하였다. Table 9는 TerraSAR 기준점에 대한 GPS 측량성과와 좌표변환성과이다.
TerraSAR에서 획득된 5개의 위치 중 2개의 지점은 지형변 화로 인하여 GPS 측량을 수행할 수 없었으며, 나머지 3개 지 점에 대해 GPS 측량을 수행하여 산출된 성과와 국내에 활용 하고 있는 좌표변환 프로그램을 적용하여 변환한 성과와 비 교분석하였다 . 그 결과는 Table 10과 같이 RMSE가 X방향으 로 ±0.818m, Y방향으로 ±0.200m, 수평거리로 ±0.842m, Z방향으로 ±0.265m의 결과를 얻었다.
4.3 활용성 평가
국내의 1/5,000 수치지형도 제작에 대한 오차범위는 국토 지리정보원의 항공사진측량작업규정(NGII, 2013)의 ‘제5장 항공삼각측량 제56조(조정계산 및 오차의 한계)’에서 항공삼 각측량을 수행한 조정계산 후의 기준점 및 검사점의 허용오 차를 Table 11과 같이 정하고 있다.
PLEIADES 영상의 초기 RPC 계수를 적용한 결과는 1/5,000 수치지형도 제작의 오차범위를 벗어났으며, 명확한 지점에 GPS 측량으로 좌표를 획득한 지상기준점으로 기하 보정한 결과는 오차범위 이내에 있는 것을 확인하였다. 이 결과로 비접근 지역에 정확한 지상기준점이 확보된다면, 1/5,000 수치지형도 제작이 가능할 것이라 판단된다. 또한, TerraSAR 기준점을 평가한 결과, 1/5,000 수치지형도를 제 작하기 위한 기준점으로 적합하지는 않았으나, 향후 비접근 지역의 지상기준점 확보의 대안으로써 TerraSAR 기준점 활 용에 대한 지속적인 연구가 필요할 것으로 판단된다.
5. 결 론
본 연구는 2011년 이후 프랑스 ASTRIUM사에서 서비스 되는 0.5m급 고해상도 위성영상 PLEIADES의 초기 RPC 계수를 적용한 성과와 보정된 RPC 계수를 적용한 성과 및 TerraSAR 영상으로부터 획득한 지상기준점 좌표의 정확도 를 평가하였다. 1/5,000 수치지형도 제작 가능성을 확인하기 위한 실험을 통하여 다음과 같은 결론을 얻었다.
1. PLEIADES 영상의 초기 RPC 계수를 적용한 결과에 대하여 GPS 측량을 수행하여 획득한 검사점 14점으 로 정확도 평가를 수행한 결과, RMSE가 X방향으로
± 1.806m, Y방향으로 ±2.132m, Z방향으로 ±1.973m 의 결과를 얻었다.
2. 초기 RPC 계수와 지상기준점 16점을 활용하여 기하보
NO GPS surveying Converted coordinate
E(X) N(Y) Z(H) E(X) N(Y) Z(H) etc.
1 ***916.305 ***116.900 20.205 ***916.767 ***116.860 20.185 2 ***157.991 ***276.374 48.074 ***158.190 ***276.172 47.861 3 ***012.021 ***252.741 15.313 ***013.062 ***252.547 15.621
4 - - - ***803.771 ***402.770 24.645 Change
5 - - - ***972.179 ***550.062 20.875 Change
ID Compared result
dx(m) dy(m) dl(m) dz(m)
1 -0.462 0.040 0.464 0.020
2 -0.198 0.202 0.283 0.213
3 -1.041 0.194 1.059 -0.308
RMSE 0.818 0.200 0.842 0.265
Table 9. The result of GPS surveying and converted coordinate of TerraSAR
Table 10. Compared result of GPS surveying with converted coordinate
Scale RMSE(m) Max.(m)
1/500~1/600 0.14 0.28
1/1,000~1/1,200 0.20 0.40 1/2,500~1/3,000 0.36 0.72
1/5,000 0.72 1.44
1/10,000 0.90 1.80
1/25,000 1.00 2.00
Table 11. Tolerance error of horizontal and vertical
accuracy after adjustment
정을 수행한 결과는 RMSE가 X방향으로 ±0.104m, Y 방향으로 ±0.171m, Z방향으로 ±0.036m 임을 확인하 였으며 , 입체모델을 형성하여 수치도화기로 검사점을 평가한 결과 RMSE는 X방향으로 ±0.357m, Y방향으 로 ±0.239m, Z방향으로 ±0.188m로 항공사진측량작 업규정의 도화축척 1/5,000 조정계산 및 오차의 한계범 위인 표준편차 0.72m, 최대값 1.44m 이내 임을 확인할 수 있었다.
3. TerraSAR 영상에서 획득하여 확보한 기준점에 대하 여 좌표변환을 수행한 후 현지 GPS 측량성과와 비교 한 결과, RMSE는 X방향으로 ±0.818m, Y방향으로
± 0.200m, Z방향으로 ±0.265m 임을 확인하였다.
본 연구 결과로 PLEIADES 영상과 정확한 지상기준점을 이용하면 1/5,000 수치지형도 제작이 가능하다는 것을 확 인할 수 있었다. 또한, 비접근 지역의 수치지형도 제작을 위 한 기준점확보 방안으로 TerraSAR 기준점을 평가한 결과, 1/5,000 수치지형도를 제작하기 위한 기준점에 적합하지 않 았으며 , 오차거리 1m 이내의 정확도를 확인하였다. 그러나 직 접측량을 수행할 수 없는 비접근 지역의 기준점 확보 방안 으로 TerraSAR 기준점의 활용에 대한 추가 연구가 필요하 다고 사료된다.
References