www.jpis.org
pISSN 2093-2278 eISSN 2093-2286 Copyright © 2010 Korean Academy of PeriodontologyThis is an Open Access article distributed under the terms of the Creative Commons Attribution Non-Commercial License (http://creativecommons.org/licenses/by-nc/3.0/).
A clinical study of alveolar bone quality using the fractal dimension and the implant stability quotient
Dae-Hyun Lee1, Young Ku1,*, In-Chul Rhyu1, Jeong-Ug Hong1, Cheol-Woo Lee1, Min-Suk Heo2, Kyung-Hoe Huh2
1 Department of Periodontology and Dental Research Institute, Seoul National University School of Dentistry, Seoul, Korea
2 Department of Oral and Maxillofacial Radiology and Dental Research Institute, Seoul National University School of Dentistry, Seoul, Korea
Purpose: It has been suggested that primary implant stability plays an essential role in successful osseointegration. Resonance frequency analysis (RFA) is widely used to measure the initial stability of implants because it provides superior reproducibility and non-invasiveness. The purpose of this study is to investigate whether the fractal dimension from the panoramic radiograph is related to the primary stability of the implant as represented by RFA.
Methods: This study included 22 patients who underwent dental implant installation at the Department of Periodontology of Seoul National University Dental Hospital. Morphometric analysis and fractal analysis of the bone trabecular pattern were performed using panoramic radiographs, and the implant stability quotient (ISQ) values were measured after implant installa- tion using RFA. The radiographs of 52 implant sites were analyzed, and the ISQ values were compared with the results from the morphometric analysis and fractal analysis.
Results: The Pearson correlation showed a linear correlation between the ISQ values of RFA and the parameters of morpho- metric analysis but not of statistical significance. The fractal dimension had a linear correlation that was statistically signifi- cant. The correlation was more pronounced in the mandible.
Conclusions: In conclusion, we suggest that the fractal dimension acquired from the panoramic radiograph may be a useful predictor of the initial stability of dental implants.
Keywords: Dental implantation, Fractals, Panoramic radiography.
INTRODUCTION
The key factors for successful implant treatment are a series of patient-related and procedure-dependent parameters, in- cluding general health, the biocompatibility of the implant material, the microscopic and macroscopic nature of the im- plant surface, the surgical procedure, and the quality and quan- tity of the local bone.
It has been suggested that primary implant stability plays an essential role in successful osseointegration [1]. Stability is determined by the quality and quantity of the bone, the sur- gical technique, and the design of the implant [2]. If primary
stability is good when the implants are placed in dense corti- cal bone, for instance, healing periods are usually shorter than when implants have poor primary stability. The primary sta- bility prediction would, therefore, be a great help for clinicians in determining the healing period. Additionally, it would make the implant treatment safer, more effective, and less time-con- suming. The success rates of the implant would also increase.
Recently, the resonance frequency analysis (RFA) method was presented by Meredith et al. [3] This method uses a small L-shaped transducer that is fastened by a screw to the implant or to the mucosa-penetrating abutment. Two piezoceramic elements are attached to the vertical beam. Using a personal
Received: Dec. 5, 2009; Accepted: Jan. 29, 2010
*Correspondence: Young Ku
Department of Periodontology, Seoul National University School of Dentistry, Yeongeon-dong, Jongno-gu, Seoul 110-749, Korea E-mail: [email protected], Tel: +82-2-2072-3182, Fax: +82-2-744-0051
ware, the vertical beam of the transducer is vibrated over a range of frequencies, typically 5 kHz to 15 kHz, through one of the piezoceramic elements. The other element analyzes the response of the transducer to the vibration.
The first flexural resonance frequency is identified as a peak on a plot of amplitude against frequency. The resonance fre- quency is determined by the stiffness of the bone-implant interface and by the distance from the transducer to the first bone implant contact [4]. Using these standards, many stud- ies have shown higher implant success rates [3]. Torque and RFA could also be a useful method for postoperative implant planning.
The quality of the bone is another predisposing factor for successful implant treatment. Recently, there have been stud- ies evaluating bone quality using fractal dimensions. Man- delbrot [5] brought the concept of ‘fractals’ to the attention of a general audience in 1977. He identified families of shapes comprising curves, surfaces, disconnected ‘dusts’, and odd shapes. He coined the term ‘fractal’ from the Latin adjective
‘fractus’, meaning ‘broken’. Fractal dimensions have since made a major contribution to the description and measure- ment of morphology in the natural world. They have been applied to describe cell outlines, pulmonary branching, heart beats, dripping taps, stock exchange prices, and temporoman- dibular joint sounds [6,7]. The fractal dimension of a radio- graph has also been found to be associated with changes in bone density [8-10]. These changes have been observed after increasing loads to osteoarthritic surfaces of the knee joint and after immobilization of the heel. The fractal dimension of radiographs has also been found to reflect the partial de- mineralization of bone [11].
In brief, RFA may be a useful method in predicting the prog- nosis of the implant after surgery. On the other hand, the frac- tal dimension may be a useful method of prediction before surgery. Figuring out the correlation between these two pa- rameters would be clinically meaningful. The purpose of this work is to investigate whether the fractal dimension from a panoramic radiograph is related to the primary stability of an implant represented by the implant stability quotient (ISQ) value.
MATERIALS AND METHODS
Patient data
This human clinical trial was designed to measure implant stability using an RFA measuring device (OsstellTM, Integra- tion Diagnostics, Savedalen, Sweden) at the time of implant placement. The study population consisted of dental patients actively seeking treatment at the Department of Periodontol-
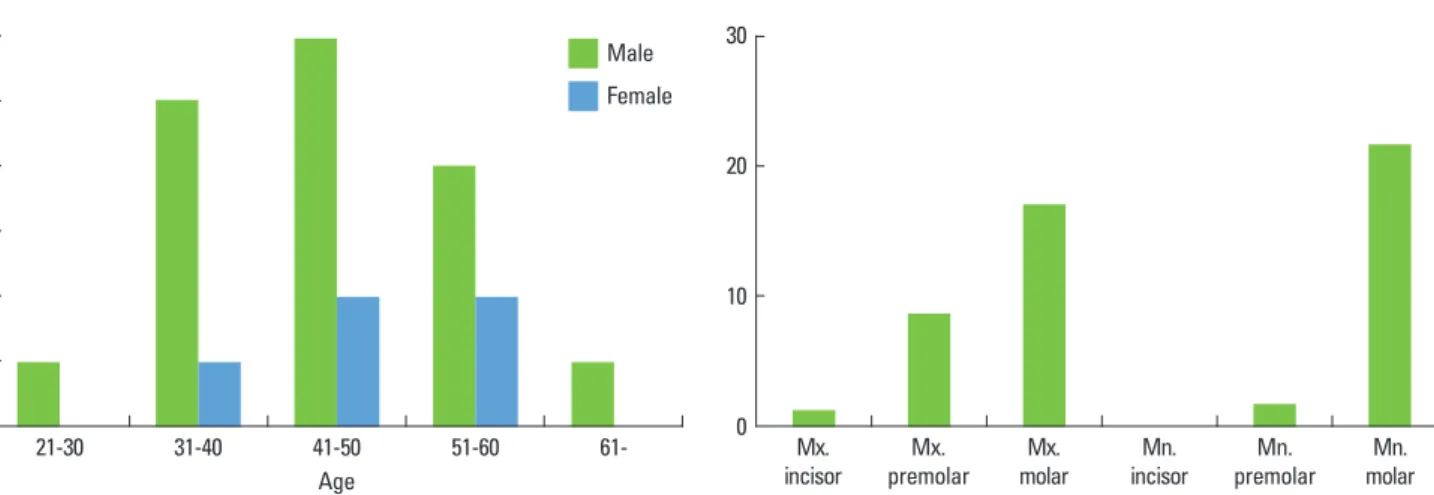
was exempted from the approval of the institutional review board because it was is conducted in 2005 which is not appli- cable to the deliberation of the ethics committee. However, the study was performed according to the principle outlined in the Declaration of Helsinki on experimentation involving human subjects. The population consisted of 22 patients be- tween the ages of 22 and 67 years (14 men, 8 women). Only patients requiring standard, external hex implants (diameter 4.0 mm) were accepted. Patients requiring bone graft or si- nus elevation were excluded.
Clinical protocol
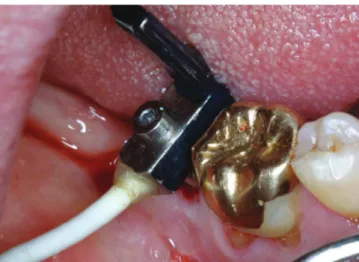
Most implants were placed using the non-submerged tech- nique (50/52), according to a strict surgical protocol following the manufacturer’s instructions. Immediately after the im- plant was placed, the RF analyzer was used for a direct mea- surement of implant stability. This methodology uses a small transducer that is designed as a simple offset cantilever beam and screwed onto an implant (Fig. 1). The transducer has 2 piezoceramic elements attached. The transducer is vibrated by exciting one of the elements with a sinusoidal signal of increasing frequency. The second piezoceramic element mea- sures the response of the beam and the signal generated is amplified and compared to the original frequency by the fre- quency response analyzer. The captured data are displayed as an RF versus amplitude graph. The RF values, calculated from the peak amplitude, are represented in a quantitative unit called the ISQ on a scale from 1 to 100. ISQ values are derived from the stiffness (N/µm) of the transducer / implant / bone system and the calibration parameters of the transducer. A higher ISQ value indicates greater stability, whereas lower values indicate lesser implant stability.
Figure 1. A small L-shaped transducer that is fastened by a screw to the implant transmitted vibrations to the fixture.
Radiographic examination
For radiographic examination, the radiographs were taken twice, i.e. before the first surgery (within a month) and just after implant installation. Using a radiographic device (PaX- 300CTM, Value Added Technologies Co., Hwaseong, Korea), panoramic radiographs were taken at settings of 70 kVp, 6 mA.
Using image software (Adobe PhotoshopTM, Adobe System Inc., San Jose, USA), the preoperative radiograph and postop- erative radiograph were superimposed to identify the loca- tion of the implants on the preoperative radiograph. Then, the region of interest (ROI) was set to a width of 60 pixels and a height of 90 pixels around the implant installation area. Ra- diographic images of 52 implants installed on 22 patients were analyzed (Figs. 2 and 3).
The analysis of digital images
Computer image software (Scion ImageTM, Scion Co., Fred- erick, USA) was used to analyze the digitally acquired images.
The average gray level was ascertained from the original im- ages of the ROI. Then, applying a Gaussian filter (kernel size = 1 × 41), the microstructure was removed, and a blurred image was produced. After removing the blurred images from the original images, the gray value of each pixel was increased by a value of 128. Finally, with an eroding and dilating procedure, the skeletonized image was obtained (Fig. 4). From the staged, converted image the mean gray level, trabecular area, periphery length, and number of terminal points were measured. Frac- tal analysis was performed using the tile-counting method.
Statistical analysis
Statistical software (SPSSTM, SPSS Inc., Chicago, USA) was used for statistical analysis. A Pearson correlation analysis was carried out to evaluate the relationship between the fractal dimensions and the ISQ values and between the morpho- metric parameters and the ISQ values.
RESULTS
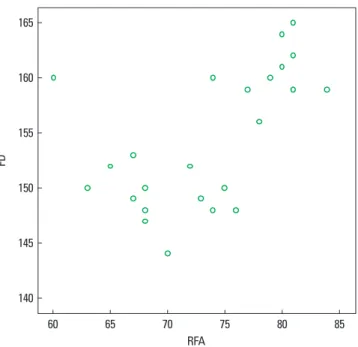
Table 1 shows the average value and standard deviation of the ISQ. A statistically significant (P < 0.01) correlation be- tween the fractal dimension from panoramic radiography and the ISQ value of RFA (Fig. 5) was clearly established (cor- relation coefficient, 0.400). In the case of the maxillary im- plants, a lower correlation was observed (correlation coeffi- cient, 0.350) (Fig. 6) and it was not statistically significant (P >
0.01). In the case of mandibular implants, a higher correla- tion was observed (correlation coefficient, 0.571) (Fig. 7) and it was statistically significant (P < 0.01).
5
4
3
2
1
0 21-30 31-40 41-50
Age
51-60 61-
Female
Figure 2. Age distribution of study subjects.
20
10
0 Mx.
incisor Mx.
premolar Mx.
molar Mn.
incisor Mn.
premolar Mn.
molar Figure 3. The location where the implants were installed.
A B C
Figure 4. Transformation of the radiographic bone image prior to calculation of the fractal dimension. (A) original panoramic radio- graph of the bone (B) transformation of the digitized image into a binary image, and (C) transformation of the binary image into an outline image from which the fractal dimension is calculated.
Table 1. The average and standard deviation of RFA in each group.
Average Standard deviation
All 72.62 5.941
Maxilla 71.96 5.392
Mandible 73.38 6.560
RFA: resonance frequency analysis.
The ISQ value and the number of terminal points, and num- ber of terminal points/trabecular area had a clear correlation but it was not statistically significant (P > 0.01).
DISCUSSION
One of the key factors that determine the long-term suc- cess of an implant is the density of the bone where the im-
plant is installed [12]. To evaluate the density of the bone di- rectly, Trisi and Rao [13] and Friberg et al. [14] performed bone biopsies and evaluated the bone quality through histomor- phometric analyses. These methods, however, are difficult to apply in a clinical environment.
The most common method for estimating bone quality is X-ray evaluation. Quantitative computed tomography [15] or dual photon X-ray absorptiometry [16] could be used to mea- sure the bone density but in the clinical circumstance of the dental clinic, their usefulness is limited due to a lack of prop- er equipment and the difficulty of carrying out the procedures.
It is also possible to measure bone density in the region of interest with the Hounsfield Unit using conventional CT [17].
In spite of these various options, most clinicians still prefer panoramic radiographic imaging for evaluating bone quality.
However, when panoramic or periapical radiography is used to take images of identical objects, large differences in the radiographic density can be seen that are the result of condi- tions under which the radiograph was taken or the process- ing method. Due to these problems, a morphologic evalua- tion method for bone trabecular morphologic character was introduced.
According to White et al. [18], morphometric analysis within the valid diagnosed standard level should not be affected by the irradiation angle or the contrast of the original image.
They also used periapical radiographic images to perform morphometric analysis in order to observe changes to bone trabecular patterns in patients with osteoporosis.
In the field of oral and maxillofacial radiology, fractal analy-
FD
160
150
140
130
60 65 70 75 80 85
RFA
Figure 5. The correlation between resonance frequency analysis (RFA) and the fractal dimension (FD).
FD
152.5
150.0
147.5
145.0
142.5
140.0
137.5
135.0
132.5
60 65 70 75 80 85
RFA
Figure 6. The correlation between resonance frequency analysis (RFA) and the fractal dimension in the maxilla (FD).
FD
160
155
150
145
140
60 65 70 75 80 85
RFA
Figure 7. The correlation between resonance frequency analysis (RFA) and the fractal dimension in the mandible (FD).
Southard et al. [19], there is a positive relationship between the fractal dimension and the density of alveolar bone. As the bone density increases so does the fractal dimension. By us- ing the fractal dimension of a section from infants’ maxillas, Wojtowicz et al. [20] showed the increasing complexity of trabecular patterns as the bone grew, and Nair et al. [21] and Heo et al. [22] reported that the fractal dimension increased during the bone recovery process.
It is known that the conditions surrounding radiography, such as irradiation angle or irradiation quantity, do not affect the fractal dimension of the trabecular pattern within clini- cally acceptable standards. Nevertheless, factors such as noise and image processing methods produced significant effects in fractal dimensions [23]. The fractal analysis also showed different results under various conditions. It should, there- fore, be used with certain restrictions. The results of fractal dimensions differ because of the differences in bone anato- my in subjects and experimental designs. Southard et al. [19]
indicated that results could vary as a result of the different ways fractal analysis could be used in individual studies. More- over, Lee et al. [24] proposed that fractal analysis could pro- duce differing values depending on the position and size of the region of interest.
In most articles, the periapical radiographic images were used to obtain the fractal dimensions [25]. Although periapi- cal radiography can accurately observe and analyze the actual bone trabecular patterns, there are limitations to panoramic radiography due to dispersions and distortions. Wilding et al.
[26], however, mentioned that one could evaluate bone re- modeling after the installation of implants with the fractal dimension by using panoramic radiography. Bollen et al. [27]
performed fractal analysis using both periapical and pan- oramic radiographic images for evaluating the bone quality of maxilla and obtained significant results in both images.
Our study was also able to obtain significant results by per- forming fractal analysis using only the panoramic radiogra- phy. When establishing the region of interest, areas such as the anterior region were excluded from the study due to blurring of the image.
A fractal analysis using a panoramic radiograph would be possible if the region of interest is established under strict conditions. Still, compared with periapical radiography, pan- oramic radiography should be used with restrictions. As the evaluating parameter of initial stability, in this study, the ISQ value was measured to compare it with the fractal dimen- sion. Many authors have reported that the RFA is useful as the evaluating parameter of initial stability [28] but there is some controversy as to the reliability of ISQ values for this purpose. Rasmusson et al. [29] reported that the ISQ value did
plants with distinct bone to implant contact (25.5% vs. 52.3%) might lead to a similar implant stability. In addition, they suggested that the ISQ value did not reflect implant anchor- age because implants of similar anchorage may display dis- tinct implant stability values. In this way, many researchers doubted the reliability of RFA in evaluating implant stability.
Because it is useful and non-invasive, however, it has been broadly used for estimating implant stability.
In this study, a statistically significant relationship was shown between implant primary stability and the fractal di- mension. Within the limits of these results, the fractal di- mension could help in the prediction of the initial stability of the implant. Such an assumption, however, would have the following two limitations: first, there are many factors con- tributing to the initial stability of the implant besides bone density, and, second, fractal analysis is sensitive to its pro- cessing methods and noise. In spite of such limitations, it is possible to conjecture the initial stability of implants through fractal analysis using panoramic radiographic imaging.
It was interesting to witness the clearer correlation at the mandible (correlation coefficient, 0.571). Because the clear trabecular pattern could be seen in the dense bone, it might be a more advantageous environment for morphological analysis. It could, therefore, be said that there is greater sig- nificance to the fractal analysis of the mandible. This result is similar to that of previous studies.
Clinically, in order to apply the fractal dimension to diag- nosis, the method of calculating the fractal dimension should be unified, and a consensus on the image processing meth- od will be needed. Considering the results of the present study, it could be concluded that the fractal dimension of bone may be a useful method for indicating a general pre- surgical treatment plan.
Research with larger groups of subjects to evaluate the rela- tionship between the fractal dimension and bone quality are needed in future.
CONFLICT OF INTEREST
No potential conflict of interest relevant to this article was reported.
REFERENCES
Friberg B, Jemt T, Lekholm U. Early failures in 4,641 con- 1.
secutively placed Branemark dental implants: a study from stage 1 surgery to the connection of completed prostheses.
Int J Oral Maxillofac Implants 1991;6:142-6.
Shalabi MM, Wolke JG, Jansen JA. The effects of implant 2.
ation in an in vitro model. Clin Oral Implants Res 2006;17:
172-8.
Meredith N, Alleyne D, Cawley P. Quantitative determina- 3.
tion of the stability of the implant-tissue interface using resonance frequency analysis. Clin Oral Implants Res 1996;
7:261-7.
Meredith N, Friberg B, Sennerby L, Aparicio C. Relation- 4.
ship between contact time measurements and PTV values when using the Periotest to measure implant stability. Int J Prosthodont 1998;11:269-75.
Mandelbrot BB. The fractal geometry of nature. 3rd ed.
5.
New York: W.H. Freeman; 1983.
Weibel ER. Fractal geometry: a design principle for living 6.
organisms. Am J Physiol 1991;261:L361-9.
Badwal RS. The application of fractal dimension to tem- 7.
poromandibular joint sounds. Comput Biol Med 1993;23:
1-14.
Yi WJ, Heo MS, Lee SS, Choi SC, Huh KH, Lee SP. Direct 8.
measurement of trabecular bone anisotropy using direc- tional fractal dimension and principal axes of inertia. Oral Surg Oral Med Oral Pathol Oral Radiol Endod 2007;104:
110-6.
Yi WJ, Heo MS, Lee SS, Choi SC, Huh KH. Comparison of 9.
trabecular bone anisotropies based on fractal dimensions and mean intercept length determined by principal axes of inertia. Med Biol Eng Comput 2007;45:357-64.
Huh KH, Yi WJ, Jeon IS, Heo MS, Lee SS, Choi SC, et al.
10.
Relationship between two-dimensional and three-dimen- sional bone architecture in predicting the mechanical strength of the pig mandible. Oral Surg Oral Med Oral Pathol Oral Radiol Endod 2006;101:363-73.
Ruttimann UE, Webber RL, Hazelrig JB. Fractal dimen- 11.
sion from radiographs of peridental alveolar bone: a pos- sible diagnostic indicator of osteoporosis. Oral Surg Oral Med Oral Pathol 1992;74:98-110.
Misch CE. Divisions of available bone in implant dentist- 12.
ry. Int J Oral Implantol 1990;7:9-17.
Trisi P, Rao W. Bone classification: clinical-histomorpho- 13.
metric comparison. Clin Oral Implants Res 1999;10:1-7.
Friberg B, Sennerby L, Roos J, Johansson P, Strid CG, Lek- 14.
holm U. Evaluation of bone density using cutting resis- tance measurements and microradiography: an in vitro study in pig ribs. Clin Oral Implants Res 1995;6:164-71.
Rosenthal DI, Ganott MA, Wyshak G, Slovik DM, Doppelt 15.
SH, Neer RM. Quantitative computed tomography for spinal density measurement: factors affecting precision.
Invest Radiol 1985;20:306-10.
Pouilles JM, Tremollieres F, Todorovsky N, Ribot C. Preci- 16.
in spinal osteoporosis. J Bone Miner Res 1991;6:997-1002.
Norton MR, Gamble C. Bone classification: an objective 17.
scale of bone density using the computerized tomography scan. Clin Oral Implants Res 2001;12:79-84.
White SC, Rudolph DJ, Ma L. Influence of X-ray beam an- 18.
gulation and exposure on morphologic features of trabec- ular bone. Int J Oral Biol 1999;24:17-24.
Southard TE, Southard KA, Jakobsen JR, Hillis SL, Najim 19.
CA. Fractal dimension in radiographic analysis of alveolar process bone. Oral Surg Oral Med Oral Pathol Oral Radiol Endod 1996;82:569-76.
Wojtowicz A, Chaberek S, Pirino A, Montella A, Bandiera P, 20.
Kinsner A, et al. The trabecular structure of developing hu- man mandible. Clin Orthod Res 2001;4:161-71.
Nair MK, Seyedain A, Webber RL, Nair UP, Piesco NP, Agar- 21.
wal S, et al. Fractal analyses of osseous healing using tuned aperture computed tomography images. Eur Radiol 2001;
11:1510-5.
Heo MS, Park KS, Lee SS, Choi SC, Koak JY, Heo SJ, et al.
22.
Fractal analysis of mandibular bony healing after orthog- nathic surgery. Oral Surg Oral Med Oral Pathol Oral Radi- ol Endod 2002;94:763-7.
Geraets WG, van der Stelt PF. Fractal properties of bone.
23.
Dentomaxillofac Radiol 2000;29:144-53.
Lee KI, Choi SC, Park TW, You DS. Fractal dimension cal- 24.
culated from two types of region of interest. Dentomaxill- ofac Radiol 1999;28:284-9.
Southard TE, Southard KA, Lee A. Alveolar process fractal 25.
dimension and postcranial bone density. Oral Surg Oral Med Oral Pathol Oral Radiol Endod 2001;91:486-91.
Wilding RJ, Slabbert JC, Kathree H, Owen CP, Crombie K, 26.
Delport P. The use of fractal analysis to reveal remodelling in human alveolar bone following the placement of den- tal implants. Arch Oral Biol 1995;40:61-72.
Bollen AM, Taguchi A, Hujoel PP, Hollender LG. Fractal 27.
dimension on dental radiographs. Dentomaxillofac Radi- ol 2001;30:270-5.
Meredith N, Book K, Friberg B, Jemt T, Sennerby L. Reso- 28.
nance frequency measurements of implant stability in vivo. A cross-sectional and longitudinal study of resonance frequency measurements on implants in the edentulous and partially dentate maxilla. Clin Oral Implants Res 1997;
8:226-33.
Rasmusson L, Kahnberg KE, Tan A. Effects of implant de- 29.
sign and surface on bone regeneration and implant sta- bility: an experimental study in the dog mandible. Clin Implant Dent Relat Res 2001;3:2-8.