ABSTRACT
Purpose: Histidine-containing dipeptides, which are rich in chicken, have been reported to reduce the risk of metabolic abnormalities via anticarbonylation mechanism in animal models. To determine the effect of dietary histidine-containing dipeptides on metabolic risk factors in humans, the relation between chicken consumption and insulin resistance were determined in a population consuming high carbohydrate and low protein.
Methods: A total of 7,183 subjects (2,929 men and 4,254 women) aged ≥ 50 years from the Korea National Health and Nutrition Examination Survey (KNHANES) were divided into three groups according to chicken consumption (rarely, monthly, and weekly), and evaluated for the metabolic risk factors using homeostasis model assessment for insulin resistance (HOMA-IR) and quantitative insulin sensitivity check index (QUICKI) in this cross-sectional study. The fourth and fifth (IV-1–3 & V-1) KNHANES, which had blood insulin data, were chosen for the current study.
Results: The chicken consumption was significantly associated with insulin (p for trend
= 0.018) and HOMA-IR (p for trend = 0.023) in men. In particular, the ‘weekly’ chicken consuming men in the lowest tertile (< 65.0%) of carbohydrate intake group had significantly lower HOMA-IR (p for trend = 0.033) and higher QUICKI (p for trend = 0.043) than the
‘rarely’ intake group. In addition, the odds ratio for abnormal HOMA-IR was 0.55 (95%
confidence interval [CI], 0.31–0.99) and QUICKI was 0.47 (95% CI, 0.26–0.86) for the
‘weekly’ chicken consuming group.
Conclusion: The ‘weekly’ chicken consumption had a beneficial effect on insulin resistance and it may partially be due to the major bioactive components in chicken, histidine- containing dipeptides.
Keywords: histidine, dipeptides, chicken, oxidative stress, insulin resistance
INTRODUCTION
The increasing prevalence of metabolic syndrome characterized by a constellation of metabolic abnormalities such as dyslipidemia, elevated blood pressure, and insulin resistance/glucose intolerance, is expected leading to further increases in diabetes [1,2].
Several foods and their components have been tested in animal models and humans to prevent or treat metabolic abnormalities [3-6]. In this regard, histidine-containing
Research Article
Received: May 4, 2020 Revised: Jul 6, 2020 Accepted: Jul 7, 2020 Correspondence to Nam-Seok Joo
Department of Family Practice and Community Health, Ajou University School of Medicine, 164 World cup-ro, Yeongtong-gu, Suwon 16499, Korea.
Tel: +82-31-219-5324 E-mail: [email protected]
© 2020 The Korean Nutrition Society This is an Open Access article distributed under the terms of the Creative Commons Attribution Non-Commercial License (http://
creativecommons.org/licenses/by-nc/3.0/) which permits unrestricted non-commercial use, distribution, and reproduction in any medium, provided the original work is properly cited.
ORCID iDs Kyung-Jin Yeum
https://orcid.org/0000-0002-7846-0272 Young-Sang Kim
https://orcid.org/0000-0002-7397-5410 Nam-Seok Joo
https://orcid.org/0000-0001-5895-1800 Funding
This work was supported by Konkuk University in 2019.
Conflict of Interest
There are no financial or other issues that might lead to conflict of interest.
Kyung-Jin Yeum 1, Young-Sang Kim 2, and Nam-Seok Joo 3
1 Division of Food Bioscience, College of Biomedical and Health Science, Konkuk University, Chungju 27478, Korea
2Department of Family Medicine, CHA Bundang Medical Center, CHA University, Seongnam 13496, Korea
3 Department of Family Practice and Community Health, Ajou University School of Medicine, Suwon 16499, Korea
Chicken consumption and insulin
resistance in non-diabetic older adults
dipeptides, which are contained in a high amount in red and white meat, represent an emerging class of bioactive compounds. Carnosine, the archetype of histidine-containing dipeptides, has been reported to efficiently counteract metabolic abnormalities such as dyslipidemia, hypertension, hyperinsulinemia and renal dysfunction in obese Zucker rats [7]. Moreover, several evidence indicates its ability to affect glycemic control [8] and to ameliorate diabetic related diseases such as nephropathy [9] and ocular damage [10].
Among the several molecular mechanisms reported to explain the beneficial effects of histidine-containing dipeptides, their reaction with the reactive carbonyl species forming unreactive adducts is one of the most promising mechanism [11,12]. Reactive carbonyl species, which are generated by lipid and sugar oxidation pathways, are well known to involve in the pathogenesis of several oxidative stress associated diseases such as metabolic syndrome and diabetes [13]. However, to our best of knowledge, no study has been so far addressed to evaluate the efficacy of a long-term ingestion of histidine-containing dipeptides on metabolic disorders in humans.
Using a validated LC-ESI-MS method, Peiretti et al. [14] reported that the total content of histidine-containing dipeptides in chicken breast is more than 2.5% (w/w), being anserine the most abundant histidine-containing dipeptides (ranging from 1.47% to 1.70%), followed by carnosine (from 0.7% to 0.92%), and homocarnosine (less than 0.2%). Considering the moisture content of ≤ 72.4% (68.1%–73.5%) in chicken breast, the total content of histidine- containing dipeptides in the dry mass in chicken can be reached almost 10%, thus making histidine-containing dipeptides as the most abundant and characteristic component of chicken meat.
Thus, the current study was conducted to evaluate the association between the major source of histidine-containing dipeptides, chicken, consumption and metabolic abnormalities in a population aged ≥ 50 years using the data from Korea National Health and Nutrition Examination Survey (KNHANES).
METHODS
Participants
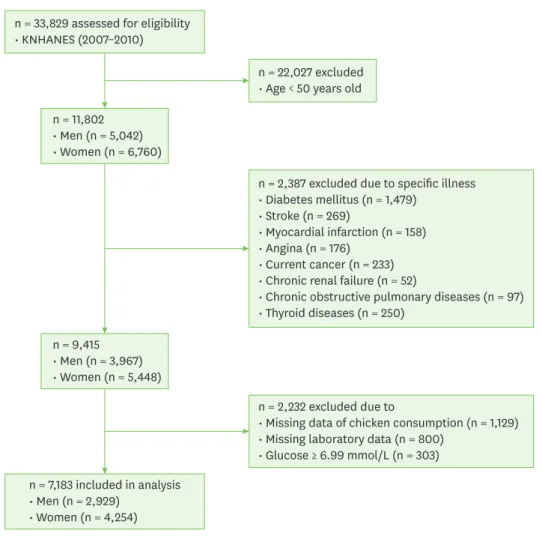
KNHANES, conducted periodically by the Korea Centers for Disease Control and Prevention, provide comprehensive information on health and nutrition status and socio-demographics in 600 national districts in Korea. Considering the data on blood insulin were provided only in the period of 2007–2010 in the KNHANES, data from the fourth (IV-1, 2, 3, 2007, 2008, 2009) and fifth (V-1, 2010) KNHANES containing serum glucose, insulin, lipid profiles and physical examination were utilized in this cross-sectional analysis. Because the prevalence of insulin resistance increases dramatically with age, we focused on our attention to the older adult age group (> 50 year) in this study. From an initial total of 33,829 men and women, 11,802 subjects (5,042 men and 6,760 women) were evaluated. Of the evaluated subjects, 2,387 subjects were excluded for diabetes (n = 1,479), stroke (n = 269), myocardial infarction (n = 158), angina pectoris (n = 176), current cancers (n = 233), chronic renal failure (n = 52), chronic obstructive pulmonary diseases (n = 97), thyroid diseases (n = 250), and an additional 2,232 subjects were excluded for missing data of chicken consumption (n = 1,129) and laboratory data (n = 800), and serum glucose ≥ 6.99 mmol/L (n = 303). Diabetes was defined as a fasting glucose concentration ≥ 7.0 mmol/L (≥ 126 mg/dL), current use of antidiabetic
medications, or a self-reported physician diagnosis of diabetes. A final 7,183 subjects (2,929 men and 4,254 women) were used in this analysis as shown in Fig. 1.
All participants provided written informed consent before the survey. The study protocol was approved by the Institutional Review Board of Ajou University Hospital (AJIRB-MED- EXP-13-326).
Measurements
Body weight and height were measured in light indoor clothing without shoes to the nearest 0.1 kg and 0.1 cm, respectively. Body mass index (BMI) was calculated as the ratio of weight/
height2 (kg/m2). Systolic blood pressure (SBP) and diastolic blood pressure (DBP) were measured in the right arm using a standard mercury sphygmomanometer (Baumanometer;
Baum, Copiague, NY, USA). The average of two SBP and DBP readings, which were recorded at an interval of five minutes, was used for analysis. Blood samples, after an 8 hours fast, were collected. They were immediately processed, refrigerated, and transported in cold storage to the central testing institute (NeoDin Medical Institute, Seoul, South Korea), where they were analyzed within 24 hours. Total cholesterol (TC), triglyceride (TG), and high-density lipoprotein cholesterol (HDL-C), low-density lipoprotein cholesterol (LDL-C) levels were
n = 33,829 assessed for eligibility
• KNHANES (2007–2010)
n = 7,183 included in analysis
• Men (n = 2,929)
• Women (n = 4,254)
n = 2,387 excluded due to specific illness
• Diabetes mellitus (n = 1,479)
• Stroke (n = 269)
• Myocardial infarction (n = 158)
• Angina (n = 176)
• Current cancer (n = 233)
• Chronic renal failure (n = 52)
• Chronic obstructive pulmonary diseases (n = 97)
• Thyroid diseases (n = 250)
n = 2,232 excluded due to
• Missing data of chicken consumption (n = 1,129)
• Missing laboratory data (n = 800)
• Glucose ≥ 6.99 mmol/L (n = 303) n = 11,802
• Men (n = 5,042)
• Women (n = 6,760)
n = 9,415
• Men (n = 3,967)
• Women (n = 5,448)
n = 22,027 excluded
• Age < 50 years old
Fig. 1. Flow diagram of subject inclusion and exclusion.
KNHANES, Korea National Health and Nutrition Examination Survey.
measured using a Hitachi 7600-110 chemistry analyzer (Hitachi, Tokyo, Japan). The CV of serum determinants determined biweekly were 0.83%–2.09% for TC, 1.34%–2.88%
for HDL-C, 0.91%–2.39% for TG. Fasting plasma glucose concentrations were measured using an automated analyzer with an enzymatic assay (Pureauto S GLU; Daiichi, Tokyo, Japan) and serum insulin concentrations were measured using a gamma counter with an immunoradiometric assay (INS-Irma; Biosource, Nivelles, Belgium). The CV of plasma glucose was 0.86%–2.19% and serum insulin was 1.7%–6.6%. Insulin resistance was estimated using the homeostasis model assessment for insulin resistance (HOMA-IR) calculated by following equation: (fasting insulin [mU/L]× fasting glucose [mmol/L]/22.5) and using quantitative insulin sensitivity check index (QUICKI) calculated by following equation: 1/[log(glucose) + log(insulin)]. Physical activity was assessed by a questionnaire and categorized as “yes”
or “no” with “yes” meaning > 30 minutes of moderate physical activity three or more times in the last week in which the subject was tired compared to ordinary levels. As previously reported [15], current smokers were defined as those who had smoked more than five packs of cigarettes during their life and were currently smoking. Regular alcohol drinkers were those who currently drank alcohol more than one time per month and non-drinkers were all others. Occupations were classified into two groups: in-door workers and out-door workers.
The in-door workers included managers, professionals and related workers, clerical office workers, service workers, sales workers and unemployed subjects. The out-door workers included skilled agricultural, forestry, and fishery workers. Nutrient intakes, including total calorie, protein, fat, and carbohydrate intakes, were assessed with a 24 hours dietary recall questionnaire, and chicken consumption by a food frequency questionnaire administered by a trained dietician. The nutrient intakes were calculated using the Food Composition Table developed by the National Rural Resources Development Institute (7th revision) [16].
Contents of dietary supplements were not documented in KNHANES.
Statistical analyses
The complex sample analysis was used for the KNHANES data for weighting all values following the guidance of statistics from the Korea Centers for Disease Control and
Prevention. The clinical characteristics of study population such as age, BMI, blood pressure, metabolic markers such as fasting blood glucose, insulin, HOMA-IR, QUICKI, TC, HDL-C, TG, LDL-C, SBP, DBP and dietary intake were presented by simple descriptive method after weighting all values without any adjustment. All values were compared by general linear model in complex sample analysis. Study population were divided into three groups by chicken consumption: ‘rarely’ (almost none), ‘monthly’ (> 1/month), and ‘weekly’ (> 1/week) according to the self-administered questionnaire. Metabolic parameters were compared after adjusting for age [17], BMI [18], education [19], job [20,21], smoking [22], alcohol consumption [23], physical activity [18], protein intake, fat intake, and carbohydrate intake [24], and menopause, oral contraceptive, hormone replacement therapy in case of women reported to be risk factors for insulin resistance. In addition, study population was divided into groups by carbohydrate consumption (tertiles: < 65.0, 65.0–75.8, > 75.8% of total calorie for men; < 72.4, 72.5–80.8, > 80.9% for women) and determined the association of chicken consumption with the HOMA-IR and QUICKI in each group after proper adjustment. To elucidate the relationship of chicken consumption with insulin resistance further, odds ratios (ORs) of having the abnormal HOMA-IR (cutoff value = 2.34) [25] and QUICKI (cutoff value
= 0.33) [25] according to chicken consumption were determined in the lowest carbohydrate consumption group by logistic regression analysis after proper adjustment. p for trend was used to assess the significance of all analysis. Data were analyzed using SPSS 19.0 (SPSS Inc., Chicago, IL, USA) to account for the complex sampling design.
RESULTS
Clinical characteristics of study population
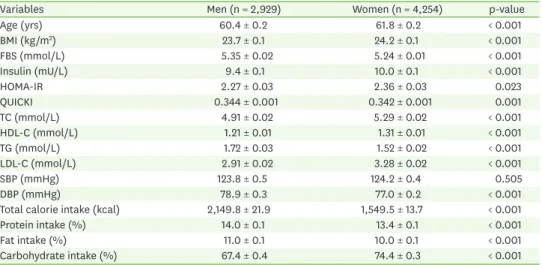
Clinical characteristics of men and women are presented in Table 1. Mean ages of men and women were 60.4 and 61.8 years old; mean BMI 23.7 kg/m2 and 24.2 kg/m2, respectively. All metabolic parameters such as blood sugar, insulin, cholesterol, TG except for SBP were all in the normal range. Thirty-one percent of men (n = 998) and 38.1% (n = 1,620) of women had HOMA-IR ≥ 2.34. Subjects who had ≤ 0.33 of QUICKI were 23.4% (n = 685) for men and 25.9% (n = 1,101) for women. Total calorie intakes in men and women were 2,337 and 1,627 kcal, respectively, and were composed of 14%, 11%, 67.4% of protein, fat and carbohydrate for men, and 13.4%, and 10% vs. 74.4% for women. Majority of subjects, 66.4% (n = 1,945) for men and 84% (n = 3,573) for women, in this population consumed more than 65% of total calorie from carbohydrate.
Metabolic risk factors and calorie intakes according to chicken consumption
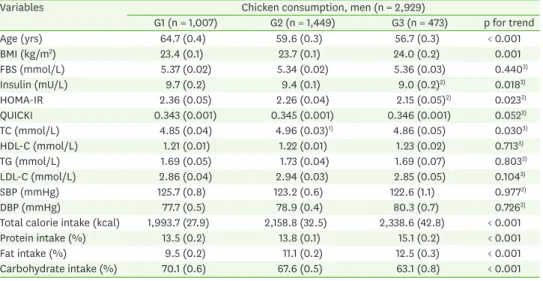
The concentrations of insulin, glucose, TG, LDL-C, HDL-C in circulation as well as blood pressure were evaluated according to the chicken consumption. In men, there was significant associations in insulin (p for trend = 0.018) and HOMA-IR (p for trend = 0.023) with chicken consumption, which showed stepwise decrease as chicken consumption increased. Although TC was significantly higher in the ‘monthly’ chicken consumption group than the other groups, it was still in normal range (Tables 2 and 3). On the contrary, there was no significant difference in all metabolic parameters in women.
HOMA-IR and QUICKI according to chicken and carbohydrate consumptions
The impact of chicken consumption on insulin resistance was examined by carbohydrate consumption category. To accomplish this, men and women were further divided into
Table 1. Clinical characteristics of study subjects (n = 7,183)
Variables Men (n = 2,929) Women (n = 4,254) p-value
Age (yrs) 60.4 ± 0.2 61.8 ± 0.2 < 0.001
BMI (kg/m2) 23.7 ± 0.1 24.2 ± 0.1 < 0.001
FBS (mmol/L) 5.35 ± 0.02 5.24 ± 0.01 < 0.001
Insulin (mU/L) 9.4 ± 0.1 10.0 ± 0.1 < 0.001
HOMA-IR 2.27 ± 0.03 2.36 ± 0.03 0.023
QUICKI 0.344 ± 0.001 0.342 ± 0.001 0.001
TC (mmol/L) 4.91 ± 0.02 5.29 ± 0.02 < 0.001
HDL-C (mmol/L) 1.21 ± 0.01 1.31 ± 0.01 < 0.001
TG (mmol/L) 1.72 ± 0.03 1.52 ± 0.02 < 0.001
LDL-C (mmol/L) 2.91 ± 0.02 3.28 ± 0.02 < 0.001
SBP (mmHg) 123.8 ± 0.5 124.2 ± 0.4 0.505
DBP (mmHg) 78.9 ± 0.3 77.0 ± 0.2 < 0.001
Total calorie intake (kcal) 2,149.8 ± 21.9 1,549.5 ± 13.7 < 0.001
Protein intake (%) 14.0 ± 0.1 13.4 ± 0.1 < 0.001
Fat intake (%) 11.0 ± 0.1 10.0 ± 0.1 < 0.001
Carbohydrate intake (%) 67.4 ± 0.4 74.4 ± 0.3 < 0.001
Data represent mean ± SE after weighting in complex sample analysis.
BMI, body mass index; FBS, fasting blood sugar; HOMA-IR, homeostasis model assessment for insulin resistance;
QUICKI, quantitative insulin sensitivity check index; TC, total cholesterol; HDL-C, high-density lipoprotein cholesterol; TG, triglyceride; LDL-C, low-density lipoprotein cholesterol; SBP, systolic blood pressure; DBP, diastolic blood pressure.
Table 2. Metabolic parameters according to the chicken consumption in men
Variables Chicken consumption, men (n = 2,929)
G1 (n = 1,007) G2 (n = 1,449) G3 (n = 473) p for trend
Age (yrs) 64.7 (0.4) 59.6 (0.3) 56.7 (0.3) < 0.001
BMI (kg/m2) 23.4 (0.1) 23.7 (0.1) 24.0 (0.2) 0.001
FBS (mmol/L) 5.37 (0.02) 5.34 (0.02) 5.36 (0.03) 0.4403)
Insulin (mU/L) 9.7 (0.2) 9.4 (0.1) 9.0 (0.2)2) 0.0183)
HOMA-IR 2.36 (0.05) 2.26 (0.04) 2.15 (0.05)2) 0.0233)
QUICKI 0.343 (0.001) 0.345 (0.001) 0.346 (0.001) 0.0523)
TC (mmol/L) 4.85 (0.04) 4.96 (0.03)1) 4.86 (0.05) 0.0303)
HDL-C (mmol/L) 1.21 (0.01) 1.22 (0.01) 1.23 (0.02) 0.7133)
TG (mmol/L) 1.69 (0.05) 1.73 (0.04) 1.69 (0.07) 0.8033)
LDL-C (mmol/L) 2.86 (0.04) 2.94 (0.03) 2.85 (0.05) 0.1043)
SBP (mmHg) 125.7 (0.8) 123.2 (0.6) 122.6 (1.1) 0.9773)
DBP (mmHg) 77.7 (0.5) 78.9 (0.4) 80.3 (0.7) 0.7263)
Total calorie intake (kcal) 1,993.7 (27.9) 2,158.8 (32.5) 2,338.6 (42.8) < 0.001
Protein intake (%) 13.5 (0.2) 13.8 (0.1) 15.1 (0.2) < 0.001
Fat intake (%) 9.5 (0.2) 11.1 (0.2) 12.5 (0.3) < 0.001
Carbohydrate intake (%) 70.1 (0.6) 67.6 (0.5) 63.1 (0.8) < 0.001
Data represent mean ± SE.
Chicken consumption: G1, nearly none; G2, monthly; G3, weekly.
BMI, body mass index; FBS, fasting blood sugar; HOMA-IR, homeostasis model assessment for insulin resistance;
QUICKI, quantitative insulin sensitivity check index; TC, total cholesterol; HDL-C, high-density lipoprotein cholesterol; TG, triglyceride; LDL-C, low-density lipoprotein cholesterol; SBP, systolic blood pressure; DBP, diastolic blood pressure.
1)p < 0.05 in comparison with G2 vs. G1. 2)p < 0.05 in comparison with G3 vs. G1. 3)p for trend from analysis of covariance test after adjustments with age, BMI, education, job, smoking, alcohol consumption, physical activity, protein intake, fat intake, carbohydrate intake, and menopause, oral contraceptive, hormone replacement therapy in case of women.
Table 3. Metabolic parameters according to the chicken consumption in women
Variables Chicken consumption, women (n = 4,254)
G1 (n = 2,045) G2 (n = 1,750) G3 (n = 459) p for trend
Age (yrs) 64.9 ± 0.3 60.0 ± 0.3 57.4 ± 0.5 < 0.001
BMI (kg/m2) 24.3 ± 0.1 24.1 ± 0.1 23.9 ± 0.2 0.178
FBS (mmol/L) 5.24 ± 0.02 5.22 ± 0.02 5.26 ± 0.03 0.5141)
Insulin (mU/L) 10.0 ± 0.2 9.9 ± 0.2 9.7 ± 0.6 0.9091)
HOMA-IR 2.38 ± 0.05 2.34 ± 0.05 2.37 ± 0.07 0.8141)
QUICKI 0.342 ± 0.001 0.343 ± 0.001 0.341 ± 0.001 0.2071)
TC (mmol/L) 5.26 ± 0.03 5.31 ± 0.03 5.33 ± 0.05 0.2341)
HDL-C (mmol/L) 1.30 ± 0.01 1.32 ± 0.01 1.33 ± 0.02 0.3581)
TG (mmol/L) 1.49 ± 0.03 1.51 ± 0.03 1.63 ± 0.07 0.1801)
LDL-C (mmol/L) 3.27 ± 0.03 3.30 ± 0.03 3.26 ± 0.05 0.6111)
SBP (mmHg) 123.3 ± 0.6 124.8 ± 0.6 125.4 ± 1.1 0.083
DBP (mmHg) 76.5 ± 0.3 77.4 ± 0.3 77.1 ± 0.7 0.116
Total calorie intake (kcal) 1,463.4 ± 18.2 1,594.5 ± 21.2 1,689.7 ± 34.6 < 0.001
Protein intake (%) 12.9 ± 0.1 13.7 ± 0.1 14.3 ± 0.2 < 0.001
Fat intake (%) 8.9 ± 0.2 10.7 ± 0.2 11.7 ± 0.3 < 0.001
Carbohydrate intake (%) 76.5 ± 0.3 73.1 ± 0.4 71.3 ± 0.7 < 0.001
Data represent mean ± SE.
Chicken consumption: G1, nearly none; G2, monthly; G3, weekly.
BMI, body mass index; FBS, fasting blood sugar; HOMA-IR, homeostasis model assessment for insulin resistance;
QUICKI, quantitative insulin sensitivity check index; TC, total cholesterol; HDL-C, high-density lipoprotein cholesterol; TG, triglyceride; LDL-C, low-density lipoprotein cholesterol; SBP, systolic blood pressure; DBP, diastolic blood pressure.
1)p for trend from analysis of covariance test after adjustments with age, BMI, education, job, smoking, alcohol consumption, physical activity, protein intake, fat intake, carbohydrate intake, and menopause, oral contraceptive, hormone replacement therapy in case of women.
tertiles of carbohydrate consumption (< 65.0, 65.0–75.8, > 75.8% of total calorie for men;
< 72.4, 72.5–80.8, > 80.9% of total calorie for women) after proper adjustment. HOMA-IR and QUICKI were compared by chicken intake in each tertile of carbohydrate consumption.
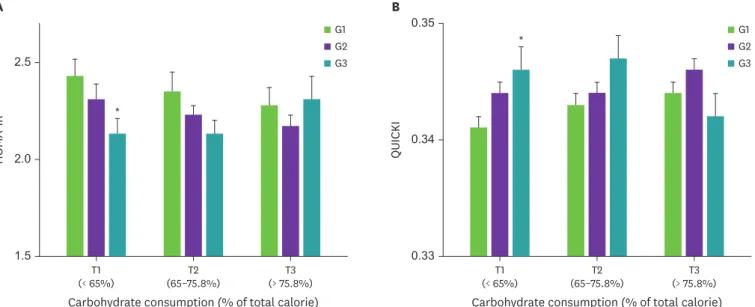
In men, HOMA-IR had a significant association with chicken consumption in the lowest tertile of carbohydrate consumption (Fig. 2A). Mean HOMA-IR decreased across the chicken consumption (p for trend = 0.033); men in the highest chicken consumption group (‘weekly’) had significantly lower HOMA-IR than those in the middle (‘monthly’) and lowest groups (’rarely’). In men, QUICKI also had a significant association with chicken consumption in the lowest tertile of carbohydrate consumption as shown in Fig. 2B. Mean QUICKI increased across the chicken consumption (p for trend = 0.043); men in the highest chicken consumption group had significantly higher QUICKI than the other groups. On the other hand, the associations between chicken consumption and insulin resistance were inconsistent in women (data are not shown).
ORs for abnormal HOMA-IR and QUICKI according to chicken consumption in the lowest tertile of carbohydrate consumption
In order to further evaluate the effect of chicken consumption on insulin resistance, ORs of having abnormal HOMA-IR (cutoff value = 2.34) and QUICKI (cutoff value = 0.33) were determined by the chicken consumption in the lowest tertile of carbohydrate consumption group. The ORs for abnormal HOMA-IR was 0.55 (95% confidence interval [CI], 0.31–0.99) and QUICKI was 0.47 (95% CI, 0.26–0.86) in the ‘weekly’ chicken intake group. Compared with ‘rarely’ chicken intake group, OR of having abnormal HOMA-IR was 0.55 (95% CI, 0.31–0.99) in the ‘weekly’ consuming group after adjustments with age, BMI, education, job, smoking, alcohol consumption, physical activity, protein intake, fat intake, and carbohydrate intake. Mean carbohydrate consumption was 53.4%, 53.5%, and 51.4% in
‘rarely’, ‘monthly’, and ‘weekly’ groups, respectively, in the lowest tertile of carbohydrate consumption group (Table 4).
QUICKI
0.33 0.35
0.34 G1
G2 G3
G1 G2 G3
HOMA-IR
1.5 2.5
2.0
(< 65%)T1 T2
(65–75.8%)
Carbohydrate consumption (% of total calorie)
(> 75.8%)T3 T1
(< 65%) T2
(65–75.8%)
Carbohydrate consumption (% of total calorie) (> 75.8%)T3
A B
*
*
Fig. 2. HOMA-IR (A) and QUICKI (B) according to chicken and carbohydrate consumptions in men.
Analysis of covariance test after adjustment for age, body mass index, education, job, smoking, alcohol consumption, activity, protein and fat intakes.
Chicken consumption: G1, rarely; G2, monthly, G3, weekly and carbohydrate consumption: tertiles of percent total caloric intakes for carbohydrate (T1, < 65%, n
= 976; T2, 65%–75.8%, n = 977; T3, > 75.8%, n = 976).
HOMA-IR, homeostasis model assessment for insulin resistance; QUICKI, quantitative insulin sensitivity check index.
*p < 0.05, G1 vs. G3.
DISCUSSION
This cross-sectional study examined the association between the consumption of rich source of histidine-containing dipeptides, chicken, and metabolic parameters in a population with a high intake of carbohydrates and low intake of proteins. Although this large population- based study cannot establish causality, it does demonstrate beneficial effect of chicken consumption on insulin resistance. In particular, this significant association was prominent for the men consuming carbohydrates less than 65% of total calories.
Carbohydrate is the major energy source for the most Asian countries that use rice as their staple food [26]. In this population, 66.4% of men and 84% of women consumed carbohydrate more than 65% of total calories, which is exceeding the acceptable
macronutrient distribution range for carbohydrates of 45%–65% of total calories [27]. Even though 12.5% of population, who had diabetes, was excluded from the analysis initially, more than 34% of men and 38% of women aged 50 years and older had abnormal HOMA-IR in this non-diabetic, no-known disease population. Considering polished white rice is the major form of rice consumed in this populations [28], high consumption of carbohydrate intake can be partially attributed to the insulin resistance [29,30]. In addition to the consumption of refined grain, a prospective studies utilizing participants in the Women's Health Study aged ≥ 45 years [31], as well as three cohorts of US adults [32] indicated a positive association between intakes of red meat and processed meat and risk of type II diabetes. In addition, a trend for a positive correlation was also reported between chicken consumption and insulin sensitivity in a population with a low intake of carbohydrates (33%) [33]. However, it is still not clear whether chicken consumption affect metabolic parameters, specifically insulin resistance, in population with a high carbohydrate intake.
Histidine-containing dipeptides such as carnosine (β-alanyl-L-histidine) and anserine (N-β- alanyl-3-methyl-L-histidine) have proven to be beneficial in a variety of animal models, in which chronic oxidative or glycoxidative stress is a characteristic feature [7,34]. However, it should be noted that serum carnosinase, which has a preferential affinity to carnosine compared to that of anserine, can be involved in the metabolic fate of carnosine in humans [35]. Carnosine is the major histidine-dipeptides found in beef and pork, whereas anserine is the majority amount of histidine-dipeptides contained in chicken [36]. In addition, only anserine concentration was reported to be significantly increased in circulation within 90 min of chicken ingestion, but no detectable histidine-dipeptides in circulation after beef consumption [35]. Type 2 diabetic patients reported to have reduced muscular histidine- containing dipeptides [37]. It is plausible that chicken consumption would lead to efficient Table 4. OR of having abnormal HOMA-IR (≥ 2.34) and QUICKI (≤ 0.33) by chicken consumption in subjects consuming carbohydrate < 65%
Variables Chicken consumption OR (95% CI) Carbohydrate consumption (%)
HOMA-IR G1 (n = 285) 1.00 53.4 ± 0.6
G2 (n = 482) 0.74 (0.47–1.15) 53.5 ± 0.4
G3 (n = 209) 0.55 (0.31–0.99) 51.4 ± 0.7
QUICKI G1 (n = 285) 1.00 53.4 ± 0.6
G2 (n = 482) 0.86 (0.51–1.44) 53.5 ± 0.4
G3 (n = 209) 0.47 (0.26–0.86) 51.4 ± 0.7
Data are shown as mean ± SE.
Chicken consumption: G1, rarely; G2, monthly; G3, weekly.
OR, odds ratio; HOMA-IR, homeostasis model assessment for insulin resistance; QUICKI, quantitative insulin sensitivity check index; CI, confidence interval.
increase of histidine-containing dipeptides in circulation as we reported earlier [35], and exert biological function. Therefore, the current study evaluated the association between insulin resistance with chicken consumption, which is an important protein source for this population.
Reliable and simple indirect methods, HOMA-IR and QUICKI, were utilized to determine the insulin resistance in this non-diabetic population. The current study applied cut-off value of 2.34 for HOMA-IR to define insulin resistance for Korean [25], which was lower than cut-off values of 2.60 and 3.80 for Spanish [38] and Hispanic population [39], respectively. On the other hand, the cut-off values applied for QUICKI for Korean [25] was the same as the other populations [38]. This study indicated a beneficial effect of ‘weekly’ chicken consumption on insulin resistance in adult men aged 50 years and older. However, such association was not shown in women. It is possible that significantly higher BMI, cholesterol, and carbohydrate intake in women may be strong confounding factors for insulin resistance masking the effect of histidine-containing dipeptides rich chicken consumption in women [29,40]. It also should be pointed out that generalization of the outcome of this study to different ethnic groups should be cautious since this study utilized national data of Koreans, who consuming very high carbohydrates and low proteins daily.
The effect of chicken consumption on insulin resistance pointed out in the current study can reasonably be ascribed to histidine-containing dipeptides, which represent a substantial and characteristic component of chicken meat, accounting for almost 10% w/w of the dry meat.
We have reported in humans that the plasma content of anserine as determined by LC-ESI- MS/MS reached a Cmax = 2.72 ± 1.08 µM at 100 minutes after ingesting 150 g of chicken breast.
Therefore anserine, which is a bioavailable histidine-containing dipeptides contained in a significant amount in chicken, may responsible for the effect of chicken consumption on insulin resistance. Recently, the ability of anserine to reduce blood glucose levels during oral glucose tolerance test in humans has been also reported [41,42]. It is interesting to note that the oxidation product of n-6 fatty acids, 4-hydroxylnonenal (HNE), can impair insulin action in muscle cells through oxidative stress and oxidative damage to proteins. HNE was found to induce a time- and dose-dependent decrease in insulin signaling and insulin-induced glucose uptake in muscle, leading to insulin resistance. These deleterious effects can be prevented by pretreatment with efficient reactive carbonyl species scavengers such as histidine-containing dipeptides [12,43-45]. Moreover, HNE and related aldehydes such as 4-hydroxy-2-hexenal can covalently react with insulin, affecting its biological activity in vivo [46,47]. We have found both in vitro and in vivo models, that histidine-containing dipeptides and in particular carnosine and anserine are selective and efficient scavengers of HNE, forming unreactive products [7]. We also demonstrated that such a detoxifying mechanism leads to several beneficial effects in animal models of oxidative damage, restraining the development of hyperinsulinemia in Zucker obese rats. The in vivo HNE detoxifying ability of carnosine has been independently confirmed by Barski et al. [48].
SUMMARY
The consumption of rich source of histidine-containing dipeptides, chicken is associated with insulin resistance in non-diabetic adult men. There was stepwise decrease of serum insulin and HOMA-IR according to increase of chicken consumption from ‘rarely’, ‘monthly’ to
‘weekly’. Furthermore, those men consuming chicken ‘weekly’ had significantly lower OR for abnormal HOMA-IR and QUICKI among men consuming less than 65% of carbohydrate. Thus, we believe ‘weekly’ chicken consumption along with reduced carbohydrate consumption to less than 65% of total calorie would benefit for preventing future diabetes in this population.
Such beneficial effects of chicken consumption can reasonably be ascribed to the biological functions of histidine-containing dippetides acting as a reactive carbonyl species detoxifying agent. Validation of such biological action of histidine-containing dipeptides may require an intervention study.
ACKNOWLEDGEMENT
The authors thank all the members of the Korea Institute for Health and Social Affairs who conducted the national survey.
REFERENCES
1. Ford ES, Schulze MB, Pischon T, Bergmann MM, Joost HG, Boeing H. Metabolic syndrome and risk of incident diabetes: findings from the European prospective investigation into cancer and nutrition- Potsdam study. Cardiovasc Diabetol 2008; 7(1): 35.
PUBMED | CROSSREF
2. Meigs JB, Rutter MK, Sullivan LM, Fox CS, D'Agostino RB Sr, Wilson PW. Impact of insulin resistance on risk of type 2 diabetes and cardiovascular disease in people with metabolic syndrome. Diabetes Care 2007; 30(5): 1219-1225.
PUBMED | CROSSREF
3. Martínez-Augustin O, Aguilera CM, Gil-Campos M, Sánchez de Medina F, Gil A. Bioactive anti-obesity food components. Int J Vitam Nutr Res 2012; 82(3): 148-156.
PUBMED | CROSSREF
4. Abete I, Goyenechea E, Zulet MA, Martínez JA. Obesity and metabolic syndrome: potential benefit from specific nutritional components. Nutr Metab Cardiovasc Dis 2011; 21 Suppl 2: B1-B15.
PUBMED | CROSSREF
5. Czekajło A, Różańska D, Zatońska K, Szuba A, Regulska-Ilow B. Association between dietary patterns and metabolic syndrome in the selected population of Polish adults-results of the PURE Poland study. Eur J Public Health 2019; 29(2): 335-340.
PUBMED | CROSSREF
6. Hassannejad R, Mohammadifard N, Kazemi I, Mansourian M, Sadeghi M, Roohafza H, et al. Long-term nuts intake and metabolic syndrome: a 13-year longitudinal population-based study. Clin Nutr 2019;
38(3): 1246-1252.
PUBMED | CROSSREF
7. Aldini G, Orioli M, Rossoni G, Savi F, Braidotti P, Vistoli G, et al. The carbonyl scavenger carnosine ameliorates dyslipidaemia and renal function in Zucker obese rats. J Cell Mol Med 2011; 15(6): 1339-1354.
PUBMED | CROSSREF
8. Lee YT, Hsu CC, Lin MH, Liu KS, Yin MC. Histidine and carnosine delay diabetic deterioration in mice and protect human low density lipoprotein against oxidation and glycation. Eur J Pharmacol 2005; 513(1-2): 145-150.
PUBMED | CROSSREF
9. Riedl E, Pfister F, Braunagel M, Brinkkötter P, Sternik P, Deinzer M, et al. Carnosine prevents apoptosis of glomerular cells and podocyte loss in STZ diabetic rats. Cell Physiol Biochem 2011; 28(2): 279-288.
PUBMED | CROSSREF
10. Yan H, Guo Y, Zhang J, Ding Z, Ha W, Harding JJ. Effect of carnosine, aminoguanidine, and aspirin drops on the prevention of cataracts in diabetic rats. Mol Vis 2008; 14: 2282-2291.
PUBMED
11. Aldini G, Facino RM, Beretta G, Carini M. Carnosine and related dipeptides as quenchers of reactive carbonyl species: from structural studies to therapeutic perspectives. Biofactors 2005; 24(1-4): 77-87.
PUBMED | CROSSREF
12. Aydin F, Kalaz EB, Kucukgergin C, Coban J, Dogru-Abbasoglu S, Uysal M. Carnosine treatment diminished oxidative stress and glycation products in serum and tissues of D-galactose-treated rats. Curr Aging Sci 2018; 11(1): 10-15.
PUBMED | CROSSREF
13. Aldini G. Advanced analytical strategies for recombinant therapeutic proteins. Curr Pharm Biotechnol 2011; 12(10): 1507.
PUBMED | CROSSREF
14. Peiretti PG, Medana C, Visentin S, Giancotti V, Zunino V, Meineri G. Determination of carnosine, anserine, homocarnosine, pentosidine and thiobarbituric acid reactive substances contents in meat from different animal species. Food Chem 2011; 126(4): 1939-1947.
PUBMED | CROSSREF
15. Joo NS, Dawson-Hughes B, Kim YS, Oh K, Yeum KJ. Impact of calcium and vitamin D insufficiencies on serum parathyroid hormone and bone mineral density: analysis of the fourth and fifth Korea National Health and Nutrition Examination Survey (KNHAENS IV-3, 2009 and V-1, 2010). J Bone Miner Res 2013;
28(4): 764-770.
PUBMED
16. National Rural Resources Development Institute, Rural Development Administration. Food composition table. 7th ed. Suwon: Rural Development Administration; 2006.
17. Ehrhardt N, Cui J, Dagdeviren S, Saengnipanthkul S, Goodridge HS, Kim JK, et al. Adiposity-independent effects of aging on insulin sensitivity and clearance in mice and humans. Obesity (Silver Spring) 2019;
27(3): 434-443.
PUBMED | CROSSREF
18. Venkatasamy VV, Pericherla S, Manthuruthil S, Mishra S, Hanno R. Effect of physical activity on insulin resistance, inflammation and oxidative stress in diabetes mellitus. J Clin Diagn Res 2013; 7(8): 1764-1766.
PUBMED
19. Chen L, Zhu H, Gutin B, Dong Y. Race, gender, family structure, socioeconomic status, dietary patterns, and cardiovascular health in adolescents. Curr Dev Nutr 2019; 3(11): nzz117.
PUBMED | CROSSREF
20. Chen SE, Sawchuk RJ, Staba EJ. American ginseng. III. Pharmacokinetics of ginsenosides in the rabbit.
Eur J Drug Metab Pharmacokinet 1980; 5(3): 161-168.
PUBMED | CROSSREF
21. Yan YX, Xiao HB, Wang SS, Zhao J, He Y, Wang W, et al. Investigation of the relationship between chronic stress and insulin resistance in a Chinese population. J Epidemiol 2016; 26(7): 355-360.
PUBMED | CROSSREF
22. Bajaj M. Nicotine and insulin resistance: when the smoke clears. Diabetes 2012; 61(12): 3078-3080.
PUBMED | CROSSREF
23. Paulson QX, Hong J, Holcomb VB, Nunez NP. Effects of body weight and alcohol consumption on insulin sensitivity. Nutr J 2010; 9(1): 14.
PUBMED | CROSSREF
24. Biobaku F, Ghanim H, Batra M, Dandona P. Macronutrient-mediated inflammation and oxidative stress:
relevance to insulin resistance, obesity, and atherogenesis. J Clin Endocrinol Metab 2019; 104(12): 6118-6128.
PUBMED | CROSSREF
25. Lee S, Choi S, Kim HJ, Chung YS, Lee KW, Lee HC, et al. Cutoff values of surrogate measures of insulin resistance for metabolic syndrome in Korean non-diabetic adults. J Korean Med Sci 2006; 21(4): 695-700.
PUBMED | CROSSREF
26. Korea Centers for Disease Control and Prevention. Annual health report 2012. Cheongju: Korea Centers for Disease Control and Prevention; 2012.
27. Institute of Medicine. Dietary reference intakes for energy, carbohydrate, fiber, fat, fatty acids, cholesterol, protein and amino acids. Washington, D.C.; The National Academies Press; 2005.
28. Cha HM, Han G, Chung HJ. A study on the trend analysis regarding the rice consumption of Korean adults using Korean National Health and Nutrition Examination Survey data from 1998, 2001 and 2005.
Nutr Res Pract 2012; 6(3): 254-262.
PUBMED | CROSSREF
29. Sun Q, Spiegelman D, van Dam RM, Holmes MD, Malik VS, Willett WC, et al. White rice, brown rice, and risk of type 2 diabetes in US men and women. Arch Intern Med 2010; 170(11): 961-969.
PUBMED | CROSSREF
30. Palacios OM, Kramer M, Maki KC. Diet and prevention of type 2 diabetes mellitus: beyond weight loss and exercise. Expert Rev Endocrinol Metab 2019; 14(1): 1-12.
PUBMED | CROSSREF
31. Song Y, Manson JE, Buring JE, Liu S. A prospective study of red meat consumption and type 2 diabetes in middle-aged and elderly women: the women's health study. Diabetes Care 2004; 27(9): 2108-2115.
PUBMED | CROSSREF
32. Pan A, Sun Q, Bernstein AM, Schulze MB, Manson JE, Willett WC, et al. Red meat consumption and risk of type 2 diabetes: 3 cohorts of US adults and an updated meta-analysis. Am J Clin Nutr 2011; 94(4): 1088-1096.
PUBMED | CROSSREF
33. Papakonstantinou E, Panagiotakos DB, Pitsavos C, Chrysohoou C, Zampelas A, Skoumas Y, et al. Food group consumption and glycemic control in people with and without type 2 diabetes: the ATTICA study.
Diabetes Care 2005; 28(10): 2539-2540.
PUBMED | CROSSREF
34. Janssen B, Hohenadel D, Brinkkoetter P, Peters V, Rind N, Fischer C, et al. Carnosine as a protective factor in diabetic nephropathy: association with a leucine repeat of the carnosinase gene CNDP1. Diabetes 2005;
54(8): 2320-2327.
PUBMED | CROSSREF
35. Yeum KJ, Orioli M, Regazzoni L, Carini M, Rasmussen H, Russell RM, et al. Profiling histidine dipeptides in plasma and urine after ingesting beef, chicken or chicken broth in humans. Amino Acids 2010; 38(3):
847-858.
PUBMED | CROSSREF
36. Gil-Agustí M, Esteve-Romero J, Carda-Broch S. Anserine and carnosine determination in meat samples by pure micellar liquid chromatography. J Chromatogr A 2008; 1189(1-2): 444-450.
PUBMED | CROSSREF
37. Gualano B, Everaert I, Stegen S, Artioli GG, Taes Y, Roschel H, et al. Reduced muscle carnosine content in type 2, but not in type 1 diabetic patients. Amino Acids 2012; 43(1): 21-24.
PUBMED | CROSSREF
38. Ascaso JF, Pardo S, Real JT, Lorente RI, Priego A, Carmena R. Diagnosing insulin resistance by simple quantitative methods in subjects with normal glucose metabolism. Diabetes Care 2003; 26(12): 3320-3325.
PUBMED | CROSSREF
39. Qu HQ, Li Q, Rentfro AR, Fisher-Hoch SP, McCormick JB. The definition of insulin resistance using HOMA-IR for Americans of Mexican descent using machine learning. PLoS One 2011; 6(6): e21041.
PUBMED | CROSSREF
40. Hellström L, Wahrenberg H, Hruska K, Reynisdottir S, Arner P. Mechanisms behind gender differences in circulating leptin levels. J Intern Med 2000; 247(4): 457-462.
PUBMED | CROSSREF
41. Nagai K, Niijima A, Yamano T, Otani H, Okumra N, Tsuruoka N, et al. Possible role of L-carnosine in the regulation of blood glucose through controlling autonomic nerves. Exp Biol Med (Maywood) 2003;
228(10): 1138-1145.
PUBMED | CROSSREF
42. Menon K, Marquina C, Liew D, Mousa A, de Courten B. Histidine-containing dipeptides reduce central obesity and improve glycaemic outcomes: a systematic review and meta-analysis of randomized controlled trials. Obes Rev 2020; 21(3): e12975.
PUBMED | CROSSREF
43. Pillon NJ, Croze ML, Vella RE, Soulère L, Lagarde M, Soulage CO. The lipid peroxidation by-product 4-hydroxy-2-nonenal (4-HNE) induces insulin resistance in skeletal muscle through both carbonyl and oxidative stress. Endocrinology 2012; 153(5): 2099-2111.
PUBMED | CROSSREF
44. Vistoli G, Colzani M, Mazzolari A, Maddis DD, Grazioso G, Pedretti A, et al. Computational approaches in the rational design of improved carbonyl quenchers: focus on histidine containing dipeptides. Future Med Chem 2016; 8(14): 1721-1737.
PUBMED | CROSSREF
45. Mol M, Regazzoni L, Altomare A, Degani G, Carini M, Vistoli G, et al. Enzymatic and non-enzymatic detoxification of 4-hydroxynonenal: methodological aspects and biological consequences. Free Radic Biol Med 2017; 111: 328-344.
PUBMED | CROSSREF
46. Pillon NJ, Vella RE, Souleere L, Becchi M, Lagarde M, Soulage CO. Structural and functional changes in human insulin induced by the lipid peroxidation byproducts 4-hydroxy-2-nonenal and 4-hydroxy-2- hexenal. Chem Res Toxicol 2011; 24(5): 752-762.
PUBMED | CROSSREF
47. Manea A, Manea SA, Todirita A, Albulescu IC, Raicu M, Sasson S, et al. High-glucose-increased expression and activation of NADPH oxidase in human vascular smooth muscle cells is mediated by 4-hydroxynonenal-activated PPARα and PPARβ/δ. Cell Tissue Res 2015; 361(2): 593-604.
PUBMED | CROSSREF
48. Barski OA, Xie Z, Baba SP, Sithu SD, Agarwal A, Cai J, et al. Dietary carnosine prevents early
atherosclerotic lesion formation in apolipoprotein E-null mice. Arterioscler Thromb Vasc Biol 2013; 33(6):
1162-1170.
PUBMED | CROSSREF