I. Introduction
The discharge process is a routine feature in any hospital that takes care of inpatients [1]. The discharge process com-
mences with the treating physician approves the termination of an inpatient course of care. Generally, the process involves the physician informing the patient that he or she will be discharged, preparation of the discharge summary, and bill settlement, after which the patient can leave the hospital.
The turnaround time (TAT) for this discharge process cov- ers the time from when the treating physician initiates the discharge until the patient leaves the hospital. Often the dis- charge process tends to take several hours because of many factors. The time taken for completion of the discharge pro- cess maybe extended by bottlenecks due to various factors, such as the number of steps involved in the process, the time taken for the completion of these steps, and interruptions that may hinder the flow of the process. It would be benefi- cial for hospitals as well as patients to anticipate such time consumption.
The discharge TAT and delays in discharging patients are a long-standing challenge of hospitals [2]. Delays in a hospi-
Application of Predictive Modelling to Improve the Discharge Process in Hospitals
Sayed Hisham1, Shahina Abdul Rasheed2, Brayal Dsouza2
1Healthcare Analytics, Baby Memorial Hospital, Kozhikode, India
2Prasanna School of Public Health, Manipal Academy of Higher Education, Manipal, India
Objectives: To find out the factors influencing discharge process turnaround time (TAT) and to accurately predict the dis- charge process TAT. Methods: The discharge process of cardiology department inpatients in a tertiary care hospital was mapped over a month. The likely factors influencing discharge TAT were tested for significance by ANOVA. Multiple linear regression (MLR) was used to predict the TAT. The sample was divided into testing and training sets for regression. A model was generated using the training set and compared with the testing set for accuracy. Results: After a process map was plot- ted, the significant factors influencing the TAT were identified to be the treating doctor, and pending evaluations on the day of discharge. The MLR model was developed with Python libraries based on the two factors identified. The model predicted the discharge TAT with a 69% R2 value and 32.4 minutes (standard error) on the testing set and a 77.3% R2 value and 26.7 minutes (standard error) on the overall sample. Conclusions: This study was an initiation to find out factors influencing dis- charge TAT and how those factors can be used to predict discharge in the hospital of interest. The study was validated and predicted the TAT with 77% accuracy after the significant factors that affect the discharge process were identified.
Keywords: Machine Learning, Regression Analysis, Linear Model, Patient Discharge
Healthc Inform Res. 2020 July;26(3):166-174.
https://doi.org/10.4258/hir.2020.26.3.166 pISSN 2093-3681 • eISSN 2093-369X
Submitted: February 12, 2020
Revised: 1st, April 24, 2020; 2nd, June 11, 2020; 3rd, July 1, 2020 Accepted: July 21, 2020
Corresponding Author Brayal Dsouza
Prasanna School of Public Health, Manipal Academy of Higher Education, Manipal 576104, India. Tel: +91-99004-05393, E-mail:
[email protected] (http://orcid.org/0000-0002-8153- 9694)
This is an Open Access article distributed under the terms of the Creative Com- mons Attribution Non-Commercial License (http://creativecommons.org/licenses/by- nc/4.0/) which permits unrestricted non-commercial use, distribution, and reproduc- tion in any medium, provided the original work is properly cited.
ⓒ 2020 The Korean Society of Medical Informatics
tal’s discharge process lead to further delays in other hospital functions, such as admissions, bed allocations, and transfer of patients. This leads to adverse effects on the reputation of the hospital [3]. Such delays cause overcrowding in admis- sion queues and emergency departments of the hospital as well as ambulance diversions. This can be considered an op- portunity loss for the hospital [4].
Having an estimated time given for the discharge process may help the hospital and all the healthcare providers in- volved in patient care streamline the discharge process and explore further ways to improve hospital services. This study aimed to identify the various features influencing discharge TAT and predict it through machine learning.
The discharge process usually involves two main stages, first, informing the patient that he or she will be discharged to final summary preparation, and second, bill initiation and clearance [1,5]. The hospital considered in this research was no different. This process involves many activities and many pending tasks, such as last-day investigations and cross-con- sultations leading to unanticipated and unpredictable delays [6]. The process involved in the study is presented in Figure 1.
In this study, we developed a method for predicting the discharge TAT in a hospital. With this method of TAT pre- diction, further opportunities to improve the quality of ser- vices offered can be explored in the hospital. The proposed method uses multiple linear regression (MLR), which has not been widely explored in the literature.
We focused on addressing operational inefficiencies in handling the administrative processes involved in hospital discharges. Successfully predicting the discharge TAT could help with streamlining various administrative functions of the hospital. Knowing the TAT for each discharge process can help administrators and other staff members anticipate, plan, and execute other dependent functions, such as house- keeping, maintenance, and sterilization of inpatient rooms
for the next admission, resulting in a seamless discharge–ad- mission cycle for inpatient beds. Thus, it would be possible to avoid the mismanagement of the aforementioned func- tions.
This study can provide insight into using machine learn- ing to predict the discharge processing time and its various applications in administrative functions such as planning, resource allocation, and so forth. Therefore, this study can be used as a reference for further studies further exploring various predictive models for estimating discharge TAT and its applications in healthcare settings.
II. Methods
This study was carried out in the cardiology department of a tertiary care hospital based on data collection and observa- tions of all the discharges spanning over a month. This study was completed within 3 months from September to Novem- ber of 2019.
1. Outcome
The study was divided into two parts.
Part 1: We observed the process-flow of the discharge and then noted the time consumed by each activity. A chart for noting down each activity in the process was prepared, and time taken for each activity was recorded for 108 discharges in the hospital over the course of 1 month. The activities identified are presented in Figure 2. The various factors in- fluencing discharge TAT were identified.
Part 2: The anticipated discharge TAT for each patient was predicted based on the influencing factors identified in Part 1. The time taken for each activity was noted down as shown in Table 1.
Doctor
Nurse
Ward secretary/PA
Billing staff
Patient consultation
Summary and bill preparation
Assessment and discharge by
doctor
Bill settlement
Cross consultation
Cross-consultation by doctor
Summary validation
and sign by doctor Corrections Yes
No
Correcter summary preparation
Validation and sign by the
doctor
Patient receives summary and vacates room
Bill generation
Yes No
Figure 1. Discharge process.
2. Data Collection
Data was collected exhaustively for all 108 discharges that occurred in the span of 1 month in the cardiology depart- ment. The data was collected by tracking each discharge pro- cess and the time taken for its completion from the hospital’s discharge tracking application.
The discharge process flow used for this study was based on the design created and maintained by the hospital in its standard operating procedure (SOP) documents. The dis- charge-process design explained above is followed through- out the hospital irrespective of the admitting department.
Part 1: The factors affecting the discharge process were identified through analysis of the discharge process flow.
The discharge process is identical and consistently followed throughout the various hospital departments with the aid of a checklist. The checklist includes the various steps of the discharge process (as shown in Figure 2, Table 1). Multiple combination of all these steps as factors were tried and ana- lyzed to find out which of those steps contributed signifi- cantly to the discharge TAT. An ANOVA analysis was done to find out the factors contributing to the variance in time taken for discharge.
Part 2: For the creation of the predictive model and testing of the model, the data was randomly divided into training and testing sets using the Python sklearn library [7]. The scope for regression analysis was explored, and it revealed that the training set was normally distributed, and MLR was chosen for modelling. The residual analysis was done, and a model was prepared using MLR. Its accuracy was tested with the testing set of the data. The above-mentioned com- binations produced a model with the best accuracy of 77%.
The analysis of the model can be seen in the Python–Jupyter Notebook of this study [7]. All the analysis and visualization was done using the sklearn, numpy, matplotlib, and pandas libraries of Python 3.6 [8].
III. Results
Part 1: All the factors that may affect the discharge process were identified by tracking each discharge based on the dis- charge process flow activities checklist used in the hospital.
The various factors analyzed based on this checklist were the following: (1) Assessment, (2) Cross-consultation, (3) Summary preparation, (4) Validation by treating doctor, (5) Corrected summary preparation, (6) Summary printing, (7) Final validation, (8) Validated summary moved for billing,
Summary print Bill preparation
Summary validation and sign by doctor
Bill generation Bill settlement Patient vacate
Validation and sign by doctor File sent to
billing Correction
End
Corrected summary preparation
Yes No
D
E F G
H
I J K L
Start
Assessment and discharge
by doctor
Cross-consultation /investigation
Cross-consultation done by doctor
Summary and bill preparation by ward secretary Discharge process
Discharge pathway
Activities:
1. A-B-C-D-E-F-G-K-L 2. A-B-C-D-F-G-H-K-L 3. A-B-C-I-J-K-L 4. A-C-D-E-F-G-H-K-L 5. A-C-D-F-G-H-K-L 6. A-C-I-J-K-L
(likely critical path) A
B
C No
Yes
Figure 2. All the pathways in the discharge process.
Table 1. Activity code in Figure 2 and corresponding activities Activity
code Activity
A–B Assessment to Cross-consultation (if any)
B–C Cross-consultation to Summary and bill preparation A–C Assessment to Summary preparation
C–D Summary preparation to Validation by treating doctor D–E Validation and correction by doctor
E–F Corrected summary preparation and printing D–F Summary validation and printing (if no corrections) F–G Summary printing to Final validation
G–H Validated summary moved for billing C–I Bill summary preparation to Bill preparation I–J Bill preparation to Bill generation
H–K File sent to billing after summary validation J–K Bill generation to Bill settlement
K–L Bill settlement to Vacating of room by patient
(9) Bill summary preparation, (10) Bill generation, (11) File sent to billing after summary validation, (12) Bill generation, (13) Bill settlement, and (14) Vacating of room by patient.
An ANOVA analysis of the data produced the following results.
- Factors 1, 3, and 7 in combination attributed to the
“treating doctor”: It was observed that the discharge TAT varied significantly with different treating doctors.
- Factor 2 attributed to “final day cross-consultation”: A pending investigation or cross-consultation on the last day of discharge leads to significant delay in the dis- charge TAT (Table 2).
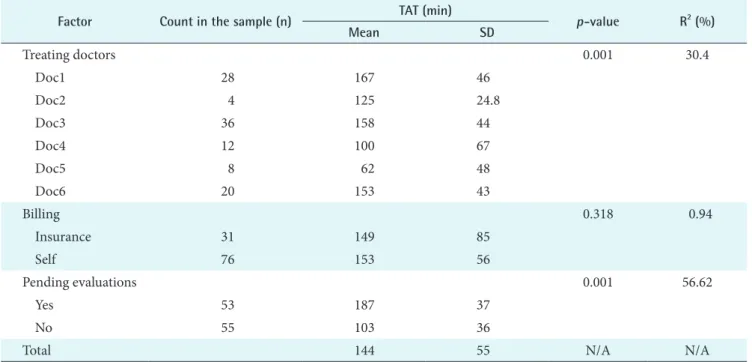
As seen in Table 3 and Figures 3–5, the significant factors influencing the discharge TAT were the treating doctor and pending cross-consultations. This contributed for over 30%
and 56% of the variation, respectively, as evidenced by the R2 value. Hence, these two factors were considered for develop- ing the model for predicting discharge TAT.
Part 2: The sample consisted of 108 items. This was split into 80% training set and 20% testing set for the out-of-sample accuracy. Then, 86 items were randomly chosen from the sample using the Python numpy library. Using the sklearn library, the algorithm below was derived for predicting the Table 2. Accuracy of the predicted model on the test-set
Sl no. Doc Pending tests TAT (min)
Difference Squared difference
Actual Model
1 Doc1 Yes 225 208.10743 16.89257 285.4
2 Doc1 Yes 210 208.10743 1.89257 3.6
3 Doc3 No 130 113.11635 16.88365 285.1
4 Doc3 No 105 113.11635 -8.11635 65.9
5 Doc4 No 51 80.299866 -29.29990 858.5
6 Doc3 Yes 233 191.25022 41.74978 1743.0
7 Doc1 No 122 129.97356 -7.97356 63.6
8 Doc4 Yes 240 158.43373 81.56627 6653.1
9 Doc3 Yes 173 191.25022 -18.25020 333.1
10 Doc3 Yes 234 191.25022 42.74978 1827.5
11 Doc1 Yes 179 208.10743 -29.10740 847.2
12 Doc2 No 120 86.433066 33.56693 1126.7
13 Doc4 Yes 189 158.43373 30.56627 934.3
14 Doc3 No 173 113.11635 59.88365 3586.1
15 Doc4 No 51 80.299866 -29.29990 858.5
16 Doc3 Yes 219 191.25022 27.74978 770.1
17 Doc1 No 120 129.97356 -9.97356 99.5
18 Doc1 Yes 225 208.10743 16.89257 285.4
19 Doc1 Yes 205 208.10743 -3.10743 9.7
20 Doc3 Yes 192 191.25022 0.749777 0.6
21 Doc6 Yes 142 189.06024 -47.06020 2214.7
22 Doc1 No 132 129.97356 2.026439 4.1
MAE (min) 25.24
MSEa (min2) 1038.88
RMSE (min) 32.23
R2 (%) 69.2
SE (min) 32.4
MAE: mean absolute error, RMSE: root mean squared error, MSE: mean squared error, SE: standard error.
aResidual sum of square.
discharge TAT:
Discharge TAT = 129.97 + 0.0 Doc_Doc1 – 43.5 Doc_Doc2 – 16.86 Doc_Doc3 – 49.67 Doc_Doc4 – 97.0 Doc_Doc5 – 19.05 Doc_Doc6 + 0.0 Pendingtests_No + 78.13 Pendingtests_
yes
An MLR model was chosen for this study because, as seen in the residual plots in Figure 3, the residuals showed a fairly random pattern. The randomness in the residual plots, es- pecially in the fitted plot, indicated that regression was the
ideal choice of algorithm.
The model was tested on the test set, and the following results were obtained. On evaluation, the model showed a mean squared error (MSE) of 1038.88 and an R2 value of 69.2%. The out-of-sample accuracy is shown in Table 2.
The residual plots for the model are shown in Figure 6. The model predicted values were compared with the actual data of the discharge TAT in the testing set, and the following re- sults were obtained.
On evaluation with the complete set of 108 samples, the Table 3. ANOVA analysis of identified factors
Factor Count in the sample (n) TAT (min)
p-value R2 (%)
Mean SD
Treating doctors 0.001 30.4
Doc1 28 167 46
Doc2 4 125 24.8
Doc3 36 158 44
Doc4 12 100 67
Doc5 8 62 48
Doc6 20 153 43
Billing 0.318 0.94
Insurance 31 149 85
Self 76 153 56
Pending evaluations 0.001 56.62
Yes 53 187 37
No 55 103 36
Total 144 55 N/A N/A
TAT: turnaround time, N/A: not applicable.
Doc1 200
150
100
50
DischargeTAT(min)
Treating doctor
Doc2 Doc3 Doc4 Doc5 Doc6
Figure 3. Interval plot discharge TAT vs. doctors. Bar represents as 95% confidence interval for the mean. The pooled stan- dard deviation was used to calculate the intervals. TAT:
turnaround time.
160
150
140
130
120
DischargeTAT(min)
Billing type
Insurance Self
Figure 4. Interval plot discharge TAT vs. billing type. Bar repre- sents as 95% confidence interval for the mean. The pooled standard deviation was used to calculate the intervals. TAT: turnaround time.
model predicted the TAT with an accuracy of 77.3% (R2 value) and an MSE of 702.26 (min2). The model showed a standard error of 26.7 minutes with a 95% confidence in-
terval. This means that the model can predict the discharge TAT within an accuracy of ±52 minutes in 95% of the cases.
The complete evaluation results of the overall sample are presented in Table 4.
IV. Discussion
This study was carried out with the intention to predict the
200 180 160 140 120 100
DischargeTAT(min)
Pending evaluations
No Yes
Figure 5. Interval plot discharge TAT vs. pending evaluations. Bar represents as 95% confidence interval for the mean.
The pooled standard deviation was used to calculate the intervals. TAT: turnaround time.
100 99.9
99 90 50 10 1
0.1
100
Percent
Residual Normal probability plot
50 0 50
100
50
0
50
Residual
Fitted value Versus fits
50 100 150 200
40 16
12
8
4
0
Frequency
Residual Histogram
20 0
100
50
0
50
Residual
Observation order Versus order
50 100
1 10 20 30 40 60 70 80 90
20 40 60 80
Figure 6. Residual plot for discharge turnaround time.
Table 4. Evaluation of model on complete sample
Evaluation Value
MAE (min) 20.86
MSEa (min2) 702.26
RMSE (min) 26.5
R2 (%) 77.3
SE (min) 26.7
MAE: mean absolute error, RMSE: root mean squared error, MSE: mean squared error, SE: standard error.
aResidual sum of square.
discharge process TAT so as to coordinate better services for patients and patient’s family or caregivers on the final day of their hospital stay, which will leave them with a lasting impression of the hospital. Although many studies have ex- plored the benefits of predicting the time of discharge from the length-of-stay (LOS) point of view, very little research has been done on prediction of the TAT for the discharge process [9-11]. Consequently, the effectiveness and benefits of this type of prediction mechanism has not been studied in detail.
The model was based on MLR, which is a proven method for obtaining algorithms in analogous situations [12].
In a study titled, “The use of regression analysis to de- termine hospital payment: the case of Medicare's indirect teaching adjustment,” by Thorpe [13], regression analysis was applied for its correct implementation in establish- ing reimbursement rates for hospitals under a government scheme.
In yet another study titled, “Predicting hospital length of stay using regression models: application to emergency de- partment,” by Combes et al. [9], the LOS of patients was esti- mated using linear regression. These models were validated and successfully applied to the classification and prediction of the LOS in the pediatric emergency department (PED) of the Lille Regional Hospital Center in France [9].
Several studies have compared the effectiveness of various algorithms for various use cases, such as “Residual analysis in regression” by StatTrek [14] and “A comparison of ran- dom forest regression and multiple linear regression for prediction in neuroscience,” by Smith et al. [15]. Comparing the effectiveness of dozens of popular algorithms for pre- dicting continuous data was beyond the scope of this study.
This study focused on predicting the discharge TAT with reasonable accuracy. MLR was chosen for prediction based on residual analysis, and this produced a reasonably accurate result for practical implementation in the hospital.
Although this model had an accuracy of only 77%, this can be attributed to the fact that fewer samples were collected due to time constraints and other limitations associated with manual observation of the process. Our subjective intuition is that the factors affecting the discharge TAT could certainly be the above-mentioned features in this set-up and that the method used is valid.
There are various examples of how linear regression has been used in the healthcare setting. A study titled “Improving the prediction of total surgical procedure time using linear regression modeling,” [16] also used linear regression to cre- ate a predictive model to optimize service TAT in a clinical
setting. In that study the linear regression model gave the most accurate value for the predicted procedure time. With a 77% accuracy for the predicted time, the result of that study is similar to the accuracy of the predicted TAT in this study.
This can be used as an effective reference to use similar lin- ear regression models for the prediction of TAT of similar administrative and clinical processes and procedures [16].
In a study by Bouphan and Srichan [17], a linear regression model was used to identify the factors affecting research to solve the health problems of health personnel in sub-district health promoting hospitals in Thailand. The study attempted to find the relationship between independent and dependent variables that could collectively predict the research. The model showed that there was a linear relationship between the dependent and independent variable. This helped in the creation of a model with a reasonable accuracy of 57%, while the model developed in this study provided an accuracy of over 70%.
The study by Freburger [18], analyzed the relationship be- tween physical therapy services and the outcomes of patients with acute stroke. Although this study did not use a predic- tion model, it used MLR to evaluate the relationship. This demonstrates the versatility of the algorithm in helping iden- tify significant relationships between factors with continuous variables.
Many studies on artificial intelligence and machine-learn- ing research have focused on the clinical aspect of healthcare delivery [19]. For example, IBM Watson is a system that uses deep-learning, classification, and a regression algorithm to process unstructured data in medical records to identify patterns and predict outcomes [19,20]. The use of artificial intelligence is somewhat less potentially revolutionary in this domain as compared to patient care, but it can be used to substantially improve efficiency. This is needed in health- care. For example, the average US nurse spends 25% of work time on regulatory and administrative activities [21]. How- ever, in a hospital, there are also administrative departments, such as housekeeping, the front-office, engineering support services, IT support services, and so forth, that help them function efficiently. From a system perspective, a lot of re- sources, such as personnel, time, and infrastructure, are also devoted to this. This paper to address these administrative disciplines and application of machine-learning in improv- ing administrative efficiency.
This is a rather novel approach, and very little previous research has considered using MLR to address and predict discharge TAT. The proposed MLR model for predicting discharge TAT is expected to be useful in managing other
aspects of the discharge process, especially in terms of activi- ties such as vacating hospital beds, disinfecting, and man- aging new admissions and the allocation of rooms for new inpatients.
This study was conducted to address the administrative hassles of delayed discharge processing. Only the time from the initiation of the discharge to the patient leaving the hos- pital bed was considered in this study. The time taken for clinical aspects of a patient’s care was not considered because it was beyond the scope of this study. There is scope for fur- ther expanding this study to better understand any signifi- cant relationships between the prediction of discharge TAT and improved the quality of services in the hospital. This could not be investigated in this study due to limitations of time and resource constraints. Further studies and improved and larger datasets should be collected to enable better and more accurate prediction of any dependent variable. There- fore, it would be an invaluable service by healthcare analysts with such means and availability of data regarding the time taken for discharge to further develop this model.
Conflict of Interest
No potential conflict of interest relevant to this article was reported.
ORCID
Sayed Hisham (http://orcid.org/0000-0002-2806-4159)
Shahina Abdul Rasheed (http://orcid.org/0000-0002-0374-1387) Brayal Dsouza (http://orcid.org/0000-0002-8153-9694)
References
1. Kaur H, Kochar R. A study on discharge process of dis- charged patients of a multispecialty hospital Ludhiana.
Int J Eng Manag Res 2017;7(3):688-94.
2. Maloney CG, Wolfe D, Gesteland PH, Hales JW, Nkoy FL. A tool for improving patient discharge process and hospital communication practices: the "Patient Tracker".
AMIA Annu Symp Proc 2007;2007:493-7.
3. Kripalani S, Jackson AT, Schnipper JL, Coleman EA.
Promoting effective transitions of care at hospital dis- charge: a review of key issues for hospitalists. J Hosp Med 2007;2(5):314-23.
4. Falvo T, Grove L, Stachura R, Vega D, Stike R, Schlenker M, et al. The opportunity loss of boarding admitted pa- tients in the emergency department. Acad Emerg Med
2007;14(4):332-7.
5. Shukla K, Upadhyay S. Predictive modelling for turn around time (TAT) of discharge process for insured patients in a corporate hospital of Pune city. J Health Manag 2018;20(1):56-63.
6. Dalal AK, Poon EG, Karson AS, Gandhi TK, Roy CL.
Lessons learned from implementation of a computer- ized application for pending tests at hospital discharge. J Hosp Med 2011;6(1):16-21.
7. Hisham S. Statistical analysis of discharge data [Inter- net]. [place unknown]: github.com; 2019 [cited at 2020 Jul 27]. Available from: https://github.com/hisham2k9/
Share_files/blob/master/dischage%20model.ipynb.
8. McKinney W. Python for data analysis: data wrangling with Pandas, NumPy, and IPython. Sebastopol (CA):
O'Reilly Media; 2012.
9. Combes C, Kadri F, Chaabane S. Predicting hospital length of stay using regression models: Application to emergency department. Proceedings of the 10th In- ternational Conference on Modeling, Optimization &
Simulation (MOSIM); 2014 Nov 5-7; Nancy, France.
10. Sullivan B, Ming D, Boggan JC, Schulteis RD, Thomas S, Choi J, et al. An evaluation of physician predictions of discharge on a general medicine service. J Hosp Med 2015;10(12):808-10.
11. De Grood A, Blades K, Pendharkar SR. A review of discharge-prediction processes in acute care hospitals.
Healthc Policy 2016;12(2):105-15.
12. Pandis N. Multiple linear regression analysis. Am J Or- thod Dentofacial Orthop 2016;149(4):581.
13. Thorpe KE. The use of regression analysis to determine hospital payment: the case of Medicare's indirect teach- ing adjustment. Inquiry 1988;25(2):219-31.
14. StatTrek. Residual analysis in regression [Internet].
[place unknown]: StatTrek; c2020 [cited at 2020 Jul 27].
Available from: https://stattrek.com/regression/residual- analysis.aspx#.
15. Smith PF, Ganesh S, Liu P. A comparison of ran- dom forest regression and multiple linear regression for prediction in neuroscience. J Neurosci Methods 2013;220(1):85-91.
16. Edelman ER, van Kuijk SM, Hamaekers AE, de Korte MJ, van Merode GG, Buhre WF. Improving the predic- tion of total surgical procedure time using linear regres- sion modeling. Front Med (Lausanne) 2017;4:85.
17. Bouphan P, Srichan R. Factors affecting the research for solving health problem of health personnel at sub- district health promoting hospitals. Procedia Soc Behav
Sci 2017;237:1097-104.
18. Freburger JK. Analysis of the relationship between the utilization of physical therapy services and outcomes for patients with acute stroke. Phys Ther 1999;79(10):906- 18.
19. Stephen O, Sain M, Maduh UJ, Jeong DU. An efficient deep learning approach to pneumonia classification in healthcare. J Healthc Eng 2019;2019:4180949.
20. Kaymak S, Almezhghwi K, Shelag AA. Classification of diseases on chest X-rays using deep learning. In: Aliev R, Kacprzyk J, Pedrycz W, Jamshidi M, Sadikoglu F, edi- tors. 13th International Conference on Theory and Ap- plications of Fuzzy Systems and Soft Computing. Cham, Switzerland: Springer; 2018. p. 516-23.
21. Davenport T, Kalakota R. The potential for artificial in- telligence in healthcare. Future Healthc J 2019;6(2):94-8.