Scaling of the Korean Version of the GMFM
So-yeon Park, Ph.D., P.T.
Seiyon Child Development Center
Chung-hwi Yi, Ph.D., P.T.
Dept. of Physical Therapy, College of Health Science, Yonsei University Institute of Health Science, Yonsei University
Abstract
The Gross Motor Function Measure (GMFM) is an internationally widely used outcome measure. The aim of this study was to evaluate the structural properties of the Korean version of GMFM using the Rasch Model, with regard to scoring within rehabilitation centers in Korea. GMFM data for 206 children with cerebral palsy were collected from 11 outpatient rehabilitation facilities by 29 pediatric therapists. The Winsteps software was used to refine the rating scale. This study suggests that the scoring categories of the Korean version of the GMFM should be collapsed from 0 (subject does not initiate task), 1 (subject initiates task), 2 (subject partially completes task), 3 (subject completes task) to 0 (subject does not initiate task), 1 (subject initiates or partially completes task), 2 (subject completes task) for better accuracy in es- timating the gross motor function of children with cerebral palsy.
1)Key Words: Cerebral palsy; GMFM; Rasch analysis.
Introduction
Health care providers recently have renewed the outcome measures used to detect clinical changes during rehabilitation (Avery et al, 2003; Chang and Chan, 1995 Wright and Linacre, 1989). To evaluate clinical changes in a patient, the outcome measures must be clinically relevant, reliable, valid, and adjustable. The criterion-referenced Gross Motor Function Measure (GMFM) has been widely used to evaluate childhood motor function. The GMFM was designed and validate for children with cerebral palsy. The original GMFM (GMFM-88), is composed of 88 items grouped into five functional dimensions:
lying and rolling (17 items), sitting (20 items), crawl- ing and kneeling (14items), standing (13 items), and walking, running, and jumping (24 items) (Russell et al, 1989; Russell et al, 2002). Each item is scored on a four-point ordinal rating scale from 0 to 3, with 0 indicating that the child cannot initiate the item and
3 indicating that the child can complete the item.
Rasch analysis is based on a probabilistic model that uses maximum likelihood estimation to order items and subjects simultaneously, thereby arranging the items along a difficulty continuum and subjects along an ability continuum (Rasch, 1980). Rasch analysis is used to transform ordinal-scaled meas- ures into interval-scaled measures that provide good clinical precision (reliability) and acceptable fit char- acteristics (quantitative validity) (Wright and Mok, 2004). A representative advantage of an inter- val-scaled measure is that it establishes standardized distances between points, allowing for more accurate interpretation of the levels measured. Probabilities (expressed in logits: log-odds probability unit) of the occurrence of each rating are determined by distrib- uting items according to their difficulty and distrib- uting subjects according to their abilities. This re- sults in the development of a single linear scale that is representative of the underlying construct (Wright
Corresponding author: So-yeon Park [email protected]
and Linacre, 1989).
Fit statistics are used to identify items that do not fit the Rasch model criterion of unidimensionality, which compromises the scale construct validity (Bond, 2003; Velozo et al, 1995). Using fit statistics makes it possible to improve scaling characteristics and has led to the introduction of shortened versions of GMFM (Avery et al, 2003). For example, Rasch analyses of gross motor function measures resulted in the elimination of misfit items that did not con- tribute to the measurement of the intended con- structs, thus shortening the scales appreciably (Avery et al, 2003). Consequently, several researchers have supported the application of Rasch analysis to refine rehabilitation outcome measures (Andresen, 2000; Page et al, 2002).
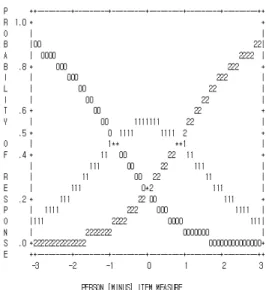
The rating scale diagnostics includes category fre- quencies, average measures, threshold estimates, probability curves, and category fit. These diag- nostics should be used in combination with each other. Combining the various diagnostics is very useful for pointing out where we might begin to re- vise the rating scale to increase the reliability and validity of the measure (Bond and Fox, 2001;
Linacre, 1999; Wright and Linacre, 1992).
The strategy for determining the optimal number of response categories requires examination of Rasch measurement diagnosis. Statistics guide us in as- sessing how the categories function to create an in- terpretable measure. The simplest way to assess category functioning is to examine category use sta- tistics (category frequencies and average measures) for each response option (Linacre, 1999). Category frequencies indicate how many respondents chose a particular response category, summed for each cat- egory across all items. These category frequencies provide the distribution of responses across all cate- gories, providing a very quick and basic examination of rating scale use.
Categories with low frequencies are also problem- atic because they do not provide enough observations for an estimation of stable threshold values.
Infrequently used categories are often unnecessary or redundant. They increase monotonically, indicating that on average, those with higher ability/stronger attitudes endorse the higher categories, whereas those with lower abilities/weaker attitudes endorse the lower categories. When this pattern is violated, as indicated by a lack of monotonicity in the average measures, collapsing categories is recommended.
The magnitude of the distances between the threshold estimates is also important. Guidelines in- dicate that the threshold should increase by at least 1.4 logits, to show distinction between categories, but not by more than 5 logits, so as to avoid large gaps in the variables (Linacre, 1999).
Fit statistics provide another criterion for assess- ing the quality of rating scales. Outfit mean squares greater than 2 indicate more misinformation than in- formation (Linacre, 1999), meaning that the particular category is introducing noise into the measurement process. Such categories warrant further empirical investigation, and might be good candidates for col- lapsing with adjacent categories.
Many researchers have been demonstrated the validity and reliability of GMFM and the Korean version of GMFM applying Rasch analyses (Avery et al, 2003; Palisano et al, 2000; Park, 2005; Russell et al, 2002; Yi and Park, 2004). However, the scaling characteristics of the GMFM have not been studied adequately. The purpose of this study was to analy- ses the Korean version of the GMFM items and re- sponse categories to determine how well they meas- ure the construct of gross motor function.
Methods Subjects
The subjects were a sample of 206 children with
cerebral palsy diagnosed by physicians. There were
125 males, 74 females and 7 unidentified by gender,
their mean age was 4.9 years (range: 8 months~14.5
years). The GMFM data used in this cross-sectional
Calibration Person separation
Item separation
Person reliability
Item
reliability Modification to next calibration
1 10.93 17.51 .99 1.00 Delete item #3, #4, #5
Delete 18 persons
2 12.69 19.26 .99 1.00 Collapse categories 1 and 2
3 12.09 17.77 .99 1.00 None
Table 1. Summary of rating scale analysis calibrations
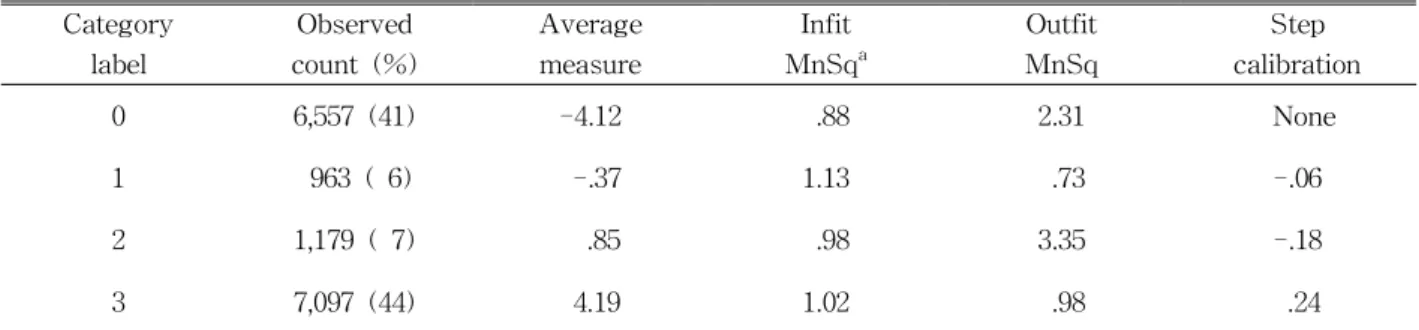
Category label
Observed count (%)
Average measure
Infit MnSq
aOutfit MnSq
Step calibration
0 6,557 (41) -4.12 .88 2.31 None
1 963 ( 6) -.37 1.13 .73 -.06
2 1,179 ( 7) .85 .98 3.35 -.18
3 7,097 (44) 4.19 1.02 .98 .24
a
MnSq: Mean Squares
Table 2. Summary of the measured steps for second calibration study were collected from 11 outpatient rehabilitation
facilities in Korea between August 2004 and April 2005.
Statistical Analysis
Rasch analysis was performed using Winsteps (Winsteps, Chicago, IL, USA) version 3.57.1. Rasch analysis allows the calibration of item responses to construct a scale on which linear measures under- lying the observations are defined. It produces an estimate of a person’s ability and item difficulty along a shared continuum, in addition to estimates of the fit of each item and person to the measurement model (Bond, 2003; Page et al, 2002). All 206 cases were used in a single calibration to ease inter- pretation and to provide a stable measure of person and item reliability for the Korean version of GMFM.
The results of this calibration were examined to de- termine the quality of the rating scale and the psy- chometric characteristics of the instrument, specifi- cally its reliability and validity.
Results
A Rasch analysis examined overall fit of all the Korean version of GMFM items initially. Rasch analy- sis showed that the original rating scale had adequate separation levels for person (10.93) and item (17.51), as well as good reliabilities for person (.00) and item (1.00). However, #3 item infit value was 2.33, #4 item infit value was 2.36, and #5 item infit value was 2.40.
Their 3 items were considered noisy and not con- tributing measurement of gross motor function. The effect of misfitting persons on the item difficulty esti- mates was also examined. Eighteen children were ex- cluded because the standard infit value exceeded 2.0.
In the second calibration, 3 items and 18 children
were deleted, person and item reliabilities remained
the same (Table 1). However, the separation levels
for person and item increased (Table 1). Person sepa-
ration level increased 10.93 to 12.69. Item separation
level increased 17.51 to 19.26. Low coherence ob-
servation percentages were observed for item response
categories 1 and 2 (6%, 7% respectively), meaning
that they were inferentially insecure (Table 2).
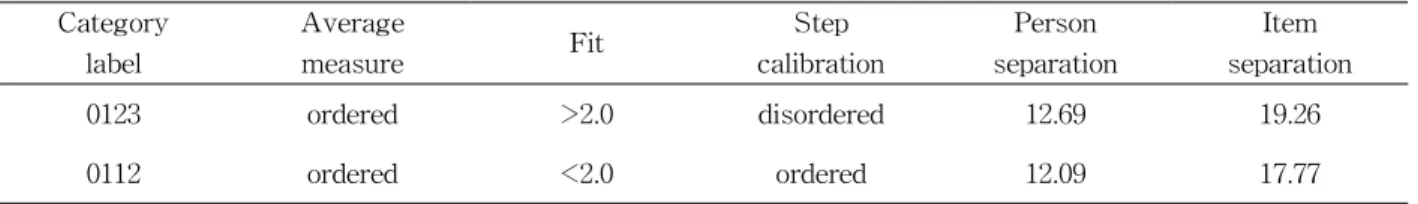
Category label
Average
measure Fit Step
calibration
Person separation
Item separation
0123 ordered >2.0 disordered 12.69 19.26
0112 ordered <2.0 ordered 12.09 17.77
Table 4. Comparison of the two categorizations Category
label
Observed
count (%) Average measure Infit MnSq
aOutfit MnSq
Step calibration
0 6,557 (41) -5.25 .81 1.02 None
1 2,142 (13) .33 .98 .00 -.84
2 7,097 (44) 5.31 .97 .97 .84
a