ABSTRACT
Purpose: To determine whether the tumor size associtates with aggressive clinicopathologic
features and tumor recurrence in patients with papillary thyroid microcarcinoma (PTMC) who had undergone thyroidectomy. Clinical significance of tumor size in patients with PTMC is still controversial.
Methods: A search of PubMed, MEDLINE, and EMBASE identified the clinical studies that
examined the association of subgroups classified by tumor size (5 mm) in surgical specimens with aggressive clinicopathologic features, and clinical outcomes between 1976 and 2017.
Seven hundred twenty relevant studies were searched, and the authors selected 34 studies, including 12,134 PTMC cases. Random effects meta-analyses were performed using odds ratios (ORs) or relative risks (RRs) with 95% confidence intervals (CIs).
Results: In 34 studies, compared with the patients with small PTMC, the patients with
large PTMC had a higher risk of multifocality (OR, 1.97; 95% CI, 1.61–2.40; I
2, 40.7%), extrathyroidal extension (OR, 3.42; 95% CI, 2.46–4.75; I
2, 64.9%), and lymph node metastasis (OR, 2.45; 95% CI, 1.79–3.37; I
2, 80.5%). In 10 studies, patient with large PTMC had 1.65-fold increased risk of locoregional recurrence (95% CI, 1.20–2.27; I
2, 0.0%).
Conclusion: This meta-analysis showed that tumor size in PTMC is associated with high-risk
clinicopathologic characteristics and tumor recurrence. These findings may be helpful to decide treatment plans for patients with PTMC larger than 5 mm.
Keywords:
Papillary thyroid microcarcinoma; Meta-analysis
INTRODUCTION
Papillary thyroid microcarcinoma (PTMC) is defined as papillary thyroid carcinoma measured
≤1 cm in its greatest diameter according to the World Health Organization classification system for thyroid tumor (1). Recently, the establishment of the technique of ultrasound- guided fine-needle aspiration biopsy has facilitated the detection and diagnosis of papillary thyroid carcinomas, even in the tumor sized 1 cm or less in maximal diameter (2). Recently, the proportion of PTMC accounts for up to 40% of all papillary thyroid carcinomas (3).
pISSN 2508-8149·eISSN 2508-8459
Original Article
Received: Feb 20, 2018 Revised: Feb 27, 2018 Accepted: Mar 10, 2018 Correspondence to Kyu Eun Lee
Division of Surgery, Thyroid Center, Seoul National University Cancer Hospital, 101 Daehak-ro, Jongno-gu, Seoul 03080, Korea.
E-mail: [email protected]
*Su-jin Kim, Kyungsik Kim, and Young peck Song equally contributed to this work.
Copyright © 2018. Korean Association of Thyroid and Endocrine Surgeons; KATES This is an Open Access article distributed under the terms of the Creative Commons Attribution Non-Commercial License (https://
creativecommons.org/licenses/by-nc/4.0/).
ORCID iDs Su-jin Kim
https://orcid.org/0000-0001-5511-3596 Kyungsik Kim
https://orcid.org/0000-0001-9007-7025 Young peck Song
https://orcid.org/0000-0002-1387-3252 Ho Kyung Sung
https://orcid.org/0000-0002-1207-0298 Kyu Eun Lee
https://orcid.org/0000-0002-2354-3599 Sue K. Park
https://orcid.org/0000-0001-5002-9707 Funding
This research was supported by the Research Resettlement Fund for the new faculty of Seoul National University.
Su-jin Kim
1,2,3,*, Kyungsik Kim
2,4,5,*, Young peck Song
1,2,3,*, Ho Kyung Sung
4, Kyu Eun Lee
1,2,3, Sue K. Park
2,4,51Department of Surgery, Seoul National University Hospital & College of Medicine, Seoul, Korea
2Cancer Research Institute, Seoul National University College of Medicine, Seoul, Korea
3Division of Surgery, Thyroid Center, Seoul National University Cancer Hospital, Seoul, Korea
4Department of Preventive Medicine, Seoul National University College of Medicine, Seoul, Korea
5Department of Biomedical Science, Seoul National University Graduate School, Seoul, Korea
Clinical Significance of Tumor Size in Papillary Thyroid Microcarcinoma:
a Meta-Analysis
Conflict of Interest
No potential conflict of interest relevant to this article was reported.
Author Contributions
Conceptualization: Kyu Eun Lee, Sue K.
Park; Data curation: Kyungsik Kim; Formal analysis: Kyungsik Kim, Young peck Song, Ho Kyung Sung; Investigation: Young peck Song; Supervision: Kyu Eun Lee, Sue K. Park;
Visualization: Su-jin Kim; Writing - original draft: Su-jin Kim, Kyungsik Kim; Writing - review & editing: Sue K. Park.
Despite the notable increasing incidence of PTMC, the diagnosis and treatment for these patients remain controversial. Less aggressive treatment is recommended in patients with PTMC relative to those with papillary thyroid cancers (PTCs) sized >1 cm because it has been thought that PTMC has characteristics of low malignant potential and rare distant metastases.
However, some studies reported that a group of PTMCs could have a potential of worse prognosis since they had relationship with extrathyroidal extension, central lymph node (LN) metastasis, and multifocal and bilateral tumors (4). Although clinical significance of tumor size (≤5 vs. >5 mm) has been determined by several studies (5-7), the association between tumor size and high-risk clinicopathologic factors, and clinical outcome remains unclear.
Therefore, the present meta-analysis was performed to clarify the association of the size of tumor with high-risk clinicopathologic factors, and clinical outcome in PTMC patients who had undergone thyroidectomy. In addition, we performed subgroup analyses to evaluate the effects of the factors that might modify this association.
METHODS
1. Literature search strategy and study selection
We developed a literature search of PubMed, MEDLINE, and EMBASE published from 1976 through 2017 to identify relevant studies using the keyword papillary thyroid microcarcinoma or papillary microcarcinoma with English language publications. Duplicated articles or overlapping data were excluded by examining the author's names, study period, and affiliations. To be eligible, studies had to meet the following inclusion criteria: 1) studies that recruited PTMC cases; 2) the exposure of interest was tumor size (cut-off value: 5 mm) of PTMC; 3) the outcome of interest was multifocality, bilaterality, extrathyroid extension, LN metastasis at diagnosis, known to be prognostic factors in PTC, and tumor recurrence; and 4) providing sufficient data to allow for the calculation of the odds ratio (OR) or relative risk (RR) with 95% confidence intervals (CIs). We also manually searched the all the references of previous meta-analysis (4,8), and identified articles. The following data were extracted from each article; first author's name, year of publication, total number of study population, number of 2 groups (≤5 vs. >5 mm), gender, age, period of study, multifocality, bilaterality extrathyroidal extension, LN metastasis, tumor recurrence, and the ORs/RRs with their 95% CIs. We obtained age-standardized incidence rate (per 100,000 person) for thyroid cancer using the GLOBOCAN 2008 database.
2. Assessment of study quality
Two authors performed quality assessment independently using Risk of Bias Assessment tool for Non-randomized Study (RoBANS) scale (Appendix 1) (9). It contains 6 domains including the selection of participants, confounding variables, measurement of intervention (exposure), blinding of outcome assessment, incomplete outcome data and selective outcome reporting. Each domain was rated as low risk of bias, uncertain risk of bias and high-risk of bias designated following as 3, 2, and 1 score, respectively. Score could range from 6 to 18, with higher scores indicating studies with higher quality. For each article, the sum of the scores of all 6 domains was added Quality score of the 34 studies ranged from 11 to 17, and all studies were considered adequate for the meta-analysis (Table 1).
3. Statistical analysis
All statistical analyses were performed with the Stata software, version 14 (Stata Corporation,
College Station, TX, USA). The Odds ratios (OR) with 95% confidence intervals (CI) were
used to assess the strength of association between the size of tumor and high-risk factors.
The relative risks (RR) with 95% CIs were calculated in order to evaluate recurrence. When the ORs and RRs were not present but enough data were available in eligible articles, Cochran Mantel-Haenszel crude estimates of the ORs, RRs and corresponding 95% CI were calculated using Sas software version 9.4 for Windows. (10) Random-effect model was used to obtain the summarized OR, RR and 95% CI.
Statistical heterogeneity among studies was evaluated with the Cochran Q and I
2statistics (11). Publication bias was evaluated with the use of the Egger regression asymmetry test in which P-value less than 0.1 was considered as representative of statistically significant publication bias (12). To analyze the source of heterogeneity between studies, subgroup
Table 1. Characteristics of the 34 studies included in the meta-analysisStudy No. of
patients* Gender (M/F) Age,
mean Period
of study Multifocal tumors* Bilateral
tumors* Extrathyroidal extension* LN
metastasis* Recurrence* Country Incidence (ASR)† Study
quality
Yoon et al., 1998 (13) 72 (32/40) 10/62 45.0 1985–1995 - - 7/16 - Korea 35.4 11
Chow et al., 2003 (14) 203 (70/133) 27/176 46.8 1960–1999 18/45 - 3/39 18/32 4/8 (LR), 0/3 (DM) Hong
Kong 1.4 13
Wada et al., 2003 (15) 259 (61/198) 29/230 48.0 1988–1998 - - 34/146 - Japan 3.1 13
Cho et al., 2006 (16) 134 (39/95) 11/123 - 2003–2006 3/24 - 7/29 11/38 - Korea 35.4 13
Han et al., 2006 (17) 350 (147/203) 54/296 46.5 1990–2004 - - - - 4/22 Korea 35.4 13
Lee et al., 2006 (18) 300 (62/238) 27/273 46.1 2004 - - 7/77 16/73 - Korea 35.4 13
Pelizzo et al., 2006 (7) 403 (169/234) 66/337 - 1990–2004 - - - - 6/18 Italy 9.1 12
Roti et al., 2006 (19) 243 (86/157) 46/197 51.5 1993–2002 - - - 2/30 0/4 Italy 9.1 13
Park et al., 2007 (20) 218 (71/147) - - 2001–2007 18/58 5/31 10/60 4/36 - Korea 35.4 12
Pakdaman et al., 2008 (21) 429 (274/155) - - 2002–2007 140/110 74/77
(140/110)∥ 25/39 - - Canada 9.4 12
Kim et al., 2008 (22) 254 (72/182) 41/213 48.1 1985–2002 4/8 - 2/12 9/21 1/9 Korea 35.4 13
Kim et al., 2008 (23) 307 (49/258) 32/275 - 1996–2002 9/89 - - - - Korea 35.4 13
Lee et al., 2008 (24) 52 (26/26) 7/45 47.6 2000–2005 - - - 1/15‡ - Korea 35.4 14
Tae et al., 2008 (25) 142 (62/80) 31/111 48.3 2000–2006 10/17 - 7/22 8/16 - Korea 35.4 13
Yoo et al., 2009 (26) 165 (62/103) 13/152 46.4 2002–2006 4/17 1/6 - 8/22 0/4 Korea 35.4 12
Kim et al., 2009 (27) 161 (52/109) 24/137 48.3 2003–2007 11/34 10/27 18/58 19/56‡; 3/12§ - Korea 35.4 14
Friguglietti et al., 2011 (28) 448 (173/275) 52/396 - 2002–2008 26/45 - 23/41 10/45 - Brazil 2.9 13
Kim et al., 2010 (29) 179 (78/101) 16/163 47.4 1996–2006 8/27 (29/71)∥ 4/14
(29/71)∥ 3/43 - - Korea 35.4 12
Lee et al., 2010 (30) 335 (125/220) 41/294 48.0 2006–2008 - - - 16/72 - Korea 35.4 14
Lombardi et al., 2010 (31) 933 (459/474) 197/736 - 2002–2007 - - 16/73 12/50 2/7 (100/187)∥ Italy 9.1 13 Lee et al., 2011 (32) 275 (106/169) 13/262 - 2007–2009 29/61 16/40
(79/149)∥ 18/44 29/71‡ - Korea 35.4 13
Buffet et al., 2012 (33) 707 (138/569) 289/418 47.2 1960–2007 - - - 56/233 - France 0.7 15
Vasileiadis et al., 2012 (34) 276 (202/74) 54/222 - 2002–2008 60/42 29/35 3/17 7/16 - Greece 1.8 13
Zhou et al., 2012 (35) 211 (67/144) 32/179 49.0 2010–2011 - 10/44 - 8/52‡
(23/99)∥ - China 1.4 14
Ardito et al., 2013 (36) 149 (92/57) 30/119 47.6 2000–2005 - - - - 18/10 Italy 9.1 14
Kim et al., 2013 (37) 483 (213/270) 68/415 45.2 2008 - - - 40/99‡ - Korea 35.4 13
Zhao et al., 2013 (8) 212 (69/143) 36/176 45.1 2003–2011 - - - 17/62 - China 1.4 14
Zheng et al., 2013 (38) 977 (632/345) 223/754 46.0 2001–2010 164/159 86/133 - 61/168 - China 1.4 16
Karatzas et al., 2013 (39) 319 (249/70) 58/261 50.3 2001–2008 - 44/33 - - - Greece 1.8 14
Kim et al., 2014 (40) 205 (83/122) 36/169 47.2 2005 19/33 13/25 18/52 (81/122)∥ 14/26
(39/70)∥ 2/7 Korea 35.4 17
Lee et al., 2014 (41) 2,018 (857/1,161) 297/1,721 45.3 1994–2010 - - - - 13/28 Korea 35.4 17
Zeng et al., 2014 (42) 141 (12/129) 37/104 44.0 2004–2011 - - - 2/41§ - China 1.4 16
Al-Qahtani et al., 2015 (43) 326 (161/65) 55/271 42.9 2000–2012 36/89 - 16/46 15/27 6/17, 4/9 (LR), 2/8 (DM) Saudi
Arabia 4.4 15
Usluogullari et al., 2015 (44) 248 (127/121) 47/201 47.8 2007–2012 28/40 17/28 7/21 2/16 4/6 Turkey 10.8 15 LN = lymph node; ASR = age-standardized rate; LR = locoregional recurrence; DM = distant metastasis; CLN = central lymph node; LLN = lateral lymph node.
*The number of patients with tumor size less than 5 mm/over 5 mm was expressed in each cell; †ASR per 100, 000 of thyroid cancer from GLOBACAN 2008; ‡CLN metastasis; §LLN metastasis; ∥Evaluated number of patients (less than 5 mm/over 5 mm).
analyses were performed according to the following characteristics: 1) incidence rate of thyroid cancer; 2) the quality of the study; and 3) published year. The incidence rate of thyroid cancer was categorized with an age-standardized incidence rate (per 100,000 person) of
≥3.1 and <3.1 using GLOBACAN 2008 database as high and low, respectively. The quality of the study was assessed using the RoBANS scale (9), which were categorized as ≥14 and <14.
Published year of the articles was categorized as since 2011 and before 2011.
RESULTS
1. Characteristics of studies
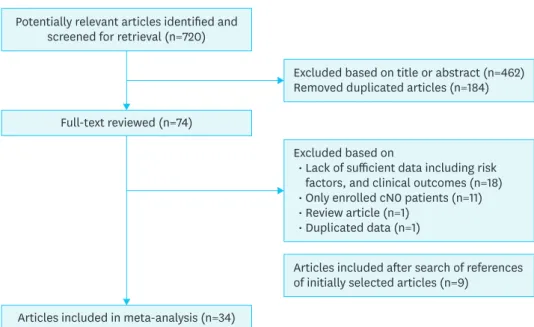
Fig. 1 showed the process of article selection for the meta-analysis. According to our
search strategy, a total of 720 potentially relevant articles were identified. Of these articles, duplicated 184 articles were removed. After review of titles and abstracts of 536 articles, we excluded 462 articles. And then 74 articles were thought to be relevant for the meta- analysis, and full-text of these articles were reviewed in detail. After search of the references of initially selected articles, 9 additional articles were included. After this review, a total of 34 eligible articles were included in the meta-analysis involving 12,134 PTMC cases. Among them, there are 5,177 cases (42.7%) of the small PTMC (≤5 mm), and 6,867 cases (56.6%) of large PTMC. The characteristics of studies in this meta-analysis are summarized in Table 1.
Multifocality (14,16,20-23,25-29,32,34,38,40,43,44), bilaterality (20,21,26,27,29,32,34,35,38- 40,44), extrathyroidal extension (14,16,18,20-22,25,27-29,31,32,34,40,43,44) and LN metastasis (8,13-16,18-20,22,24-28,30-35,37,38,40,42-44) were reported in 17, 12, 16, and 26 articles, respectively. The data for locoregional (7,14,17,19,22,26,31,36,40,41) and distant metastasis (DM) recurrence (14,43) were available in 10, and 2 articles. There are 17 studies from Korea, 4 studies from Italy, 4 studies from China, 2 studies from Greece, and 1 study from Brazil, Canada, France, Hong Kong, Japan, Turkey, and Saudi Arabia, respectively.
There was no study with poor quality. The characteristics of studies in this meta-analysis are summarized in Table 1.
Potentially relevant articles identified and screened for retrieval (n=720)
Full-text reviewed (n=74)
Excluded based on title or abstract (n=462) Removed duplicated articles (n=184)
Articles included after search of references of initially selected articles (n=9)
Excluded based on
Lack of sufficient data including risk factors, and clinical outcomes (n=18) Only enrolled cN0 patients (n=11) Review article (n=1)
Duplicated data (n=1)
•
••
•
Articles included in meta-analysis (n=34) Fig. 1. Flow chart for article selection for the meta-analysis.
2. Meta-analysis of the tumor size effects on prognostic factors
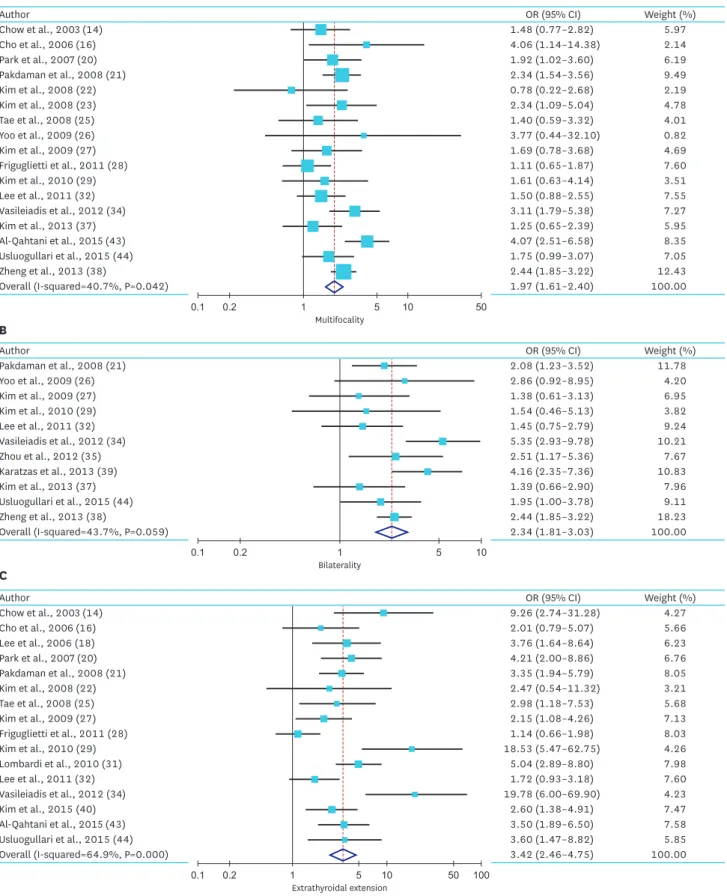
Overall, we found that there was increased summary ORs of high-risk factors in patients with larger PTMC compared with patient with small PTMC. For multifocality, the summary ORs from 17 studies was 1.97 (95% CI, 1.61–2.40). The heterogeneity of the data was significant (P=0.04), and the I
2estimate of the variance of the studies was 40.7%. For bilaterality, the summary OR from 12 studies was 2.34 (95% CI, 1.81–3.03). The heterogeneity of the data (P value) was 0.06, and the I
2estimate of the variance of the studies was 43.7. For extrathyroidal extension, the summary OR from 16 studies was 3.42 (95% CI, 2.46–4.75). The heterogeneity of the data was significant (P<0.01), and the I
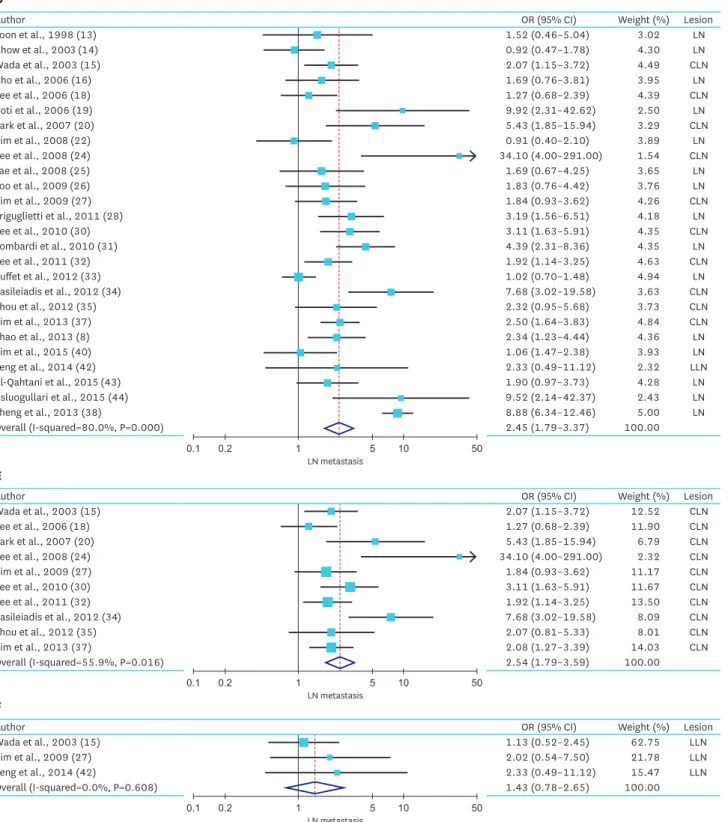
2estimate of the variance of the studies was 64.9%. For LN metastasis, the summary OR from 26 studies was 2.45 (95% CI, 1.79–3.37).
The heterogeneity of the data was significant (P<0.01), and the I
2estimate of the variance of the studies was 80.5%. For central, and lateral node metastasis, the summary OR from 10, and 3 studies was 2.54 (95% CI, 1.79–3.59), and 1.43 (95% CI, 0.78–2.65), respectively. The heterogeneity of these data (P value) were 0.02, and 0.61, and the I
2estimate of the variance of the studies was 55.9%, and 0.0%, respectively (Fig. 2 and Table 2).
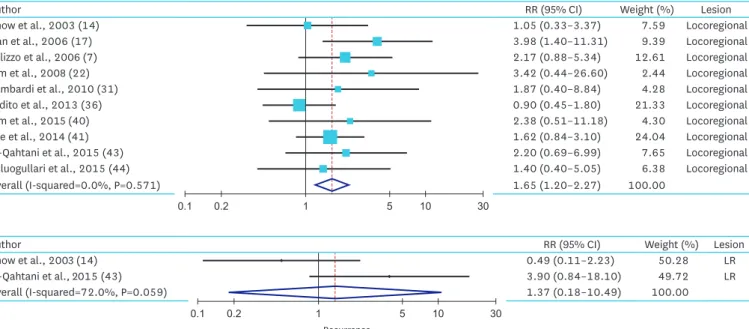
3. Meta-analysis of the tumor size effect on tumor recurrence
For locoregional and DM recurrence, 10, and 2 studies were included in meta-analysis, respectively. In locoregional recurrence (LR), we found increased risk of recurrence in patients with larger PTMC comparing with the patient with small PTMC (RR, 1.65; 95% CI, 1.20–2.27). The heterogeneity of the data was not significant (P=0.57), and the I
2estimate of the variance of the studies was 0.0%. In DM recurrence, we found increased risk of recurrence in patients with larger PTMC comparing with the patient with small PTMC (RR, 1.37; 95% CI, 0.18–10.49). The heterogeneity of the data (P value) was 0.06, and the I
2estimate of the variance of the studies was 72.0% in subgroup analysis (Fig. 3 and Table 2).
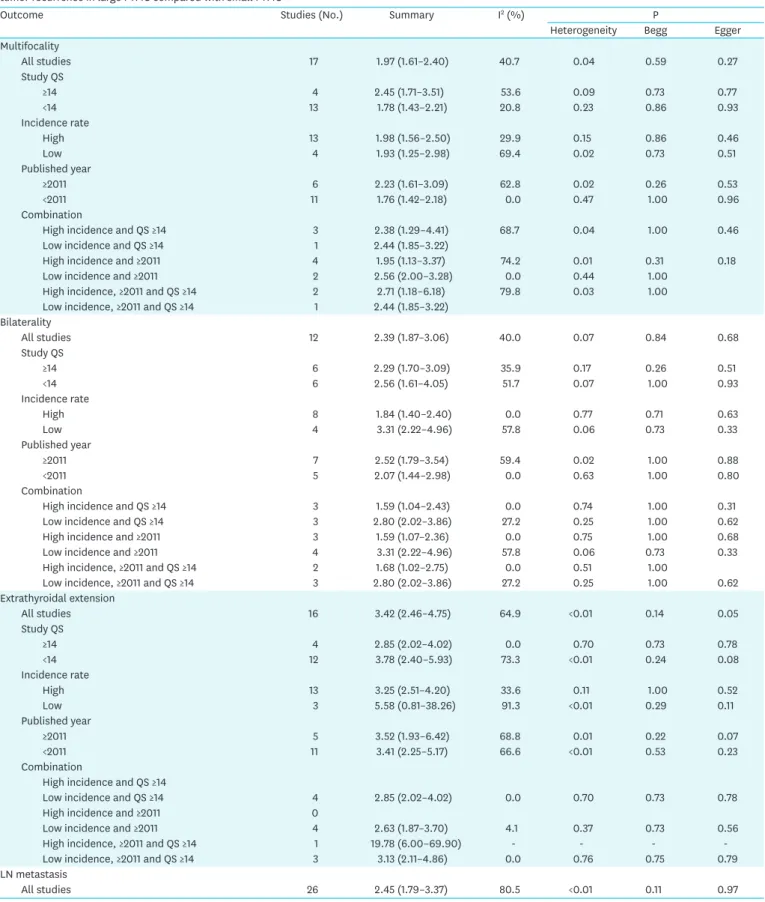
4. Subgroup analyses of the tumor size effects on the high-risk factors, and tumor recurrence
Except lateral lymph node (LLN) metastasis, and LR, I
2estimates of the variance of the studies were >20%. To evaluate the potential source of heterogeneity that might modify effects of the tumor on high-risk factors, and tumor recurrence, we performed subgroup analyses according to incidence rate of thyroid cancer, the quality of the study, published year, and their combination (Table 2). The effects estimate of subgroup analysis were broadly consistent with initial outcome of meta-analysis. Considering the high incidence, high quality, published year, and combination, low I
2estimates of the effects on the high-risk factors, and tumor recurrence are in the appendix (Appendix 2).
DISCUSSION
In the present study, we revealed that size of tumor in PTMC was associated with the high- risk factors of PTC, and tumor recurrence. To assess the strength of the association of the size of tumor with adverse clinicopathologic characteristics, and tumor recurrence, we performed a meta-analysis of 34 studies that evaluated 12,134 patients. Our study showed that large PTMC has a 1.20 to 2.27-fold increase in the risk of recurrence in addition to multifocality, bilaterality, extrathyroidal extension, and LN metastasis.
Although PTMC patients showed low LR (231/9,379 patients, 2.4%) and low mortality (32/9,379
patients, 0.34%), previous meta-analysis revealed that some PTMCs (e.g., multifocal PTMCs
0.1 0.2 1 5 10 50 Multifocality
Author OR (95% CI) Weight (%)
Chow et al., 2003 (14) 1.48 (0.77–2.82) 5.97
Cho et al., 2006 (16) 4.06 (1.14–14.38) 2.14
Park et al., 2007 (20) 1.92 (1.02–3.60) 6.19
Pakdaman et al., 2008 (21) 2.34 (1.54–3.56) 9.49
Kim et al., 2008 (22) 0.78 (0.22–2.68) 2.19
Kim et al., 2008 (23) 2.34 (1.09–5.04) 4.78
Tae et al., 2008 (25) 1.40 (0.59–3.32) 4.01
Yoo et al., 2009 (26) 3.77 (0.44–32.10) 0.82
Kim et al., 2009 (27) 1.69 (0.78–3.68) 4.69
Friguglietti et al., 2011 (28) 1.11 (0.65–1.87) 7.60
Kim et al., 2010 (29) 1.61 (0.63–4.14) 3.51
Lee et al., 2011 (32) 1.50 (0.88–2.55) 7.55
Vasileiadis et al., 2012 (34) 3.11 (1.79–5.38) 7.27
Kim et al., 2013 (37) 1.25 (0.65–2.39) 5.95
Al-Qahtani et al., 2015 (43) 4.07 (2.51–6.58) 8.35
Usluogullari et al., 2015 (44) 1.75 (0.99–3.07) 7.05
Zheng et al., 2013 (38) 2.44 (1.85–3.22) 12.43
Overall (I-squared=40.7%, P=0.042) 1.97 (1.61–2.40) 100.00
A
0.1 0.2 1 5 10
Bilaterality
Author OR (95% CI) Weight (%)
Pakdaman et al., 2008 (21) 2.08 (1.23–3.52) 11.78
Yoo et al., 2009 (26) 2.86 (0.92–8.95) 4.20
Kim et al., 2009 (27) 1.38 (0.61–3.13) 6.95
Kim et al., 2010 (29) 1.54 (0.46–5.13) 3.82
Lee et al., 2011 (32) 1.45 (0.75–2.79) 9.24
Vasileiadis et al., 2012 (34) 5.35 (2.93–9.78) 10.21
Zhou et al., 2012 (35) 2.51 (1.17–5.36) 7.67
Karatzas et al., 2013 (39) 4.16 (2.35–7.36) 10.83
Kim et al., 2013 (37) 1.39 (0.66–2.90) 7.96
Usluogullari et al., 2015 (44) 1.95 (1.00–3.78) 9.11
Zheng et al., 2013 (38) 2.44 (1.85–3.22) 18.23
Overall (I-squared=43.7%, P=0.059) 2.34 (1.81–3.03) 100.00
B
0.1 0.2 1 5 10 50 100
Extrathyroidal extension
Author OR (95% CI) Weight (%)
Chow et al., 2003 (14) 9.26 (2.74–31.28) 4.27
Cho et al., 2006 (16) 2.01 (0.79–5.07) 5.66
Lee et al., 2006 (18) 3.76 (1.64–8.64) 6.23
Park et al., 2007 (20) 4.21 (2.00–8.86) 6.76
Pakdaman et al., 2008 (21) 3.35 (1.94–5.79) 8.05
Kim et al., 2008 (22) 2.47 (0.54–11.32) 3.21
Tae et al., 2008 (25) 2.98 (1.18–7.53) 5.68
Kim et al., 2009 (27) 2.15 (1.08–4.26) 7.13
Friguglietti et al., 2011 (28) 1.14 (0.66–1.98) 8.03
Kim et al., 2010 (29) 18.53 (5.47–62.75) 4.26
Lombardi et al., 2010 (31) 5.04 (2.89–8.80) 7.98
Lee et al., 2011 (32) 1.72 (0.93–3.18) 7.60
Vasileiadis et al., 2012 (34) 19.78 (6.00–69.90) 4.23
Kim et al., 2015 (40) 2.60 (1.38–4.91) 7.47
Al-Qahtani et al., 2015 (43) 3.50 (1.89–6.50) 7.58
Usluogullari et al., 2015 (44) 3.60 (1.47–8.82) 5.85
Overall (I-squared=64.9%, P=0.000) 3.42 (2.46–4.75) 100.00
C
Fig. 2. Summarized statistics and corresponding forest plot on the association of large PTMC (size >5 mm) with the high-risk factors: (A) multifocality, (B) bilaterality, (C) extrathyroidal extension, (D) LN metastasis, (E) CLN metastasis, and (F) LLN metastasis.
PTMC = papillary thyroid microcarcinoma; LN = lymph node; CLN = central lymph node; LLN = lateral lymph node; OR = odds ratio; CI = confidence interval.
(continued to the next page)
0.1 0.2 1 5 10 50 LN metastasis
Author OR (95% CI) Weight (%) Lesion
Wada et al., 2003 (15) 2.07 (1.15–3.72) 12.52 CLN
Lee et al., 2006 (18) 1.27 (0.68–2.39) 11.90 CLN
Park et al., 2007 (20) 5.43 (1.85–15.94) 6.79 CLN
Lee et al., 2008 (24) 34.10 (4.00–291.00) 2.32 CLN
Kim et al., 2009 (27) 1.84 (0.93–3.62) 11.17 CLN
Lee et al., 2010 (30) 3.11 (1.63–5.91) 11.67 CLN
Lee et al., 2011 (32) 1.92 (1.14–3.25) 13.50 CLN
Vasileiadis et al., 2012 (34) 7.68 (3.02–19.58) 8.09 CLN
Zhou et al., 2012 (35) 2.07 (0.81–5.33) 8.01 CLN
Kim et al., 2013 (37) 2.08 (1.27–3.39) 14.03 CLN
Overall (I-squared=55.9%, P=0.016) 2.54 (1.79–3.59) 100.00
E
0.1 0.2 1 5 10 50
LN metastasis
Author OR (95% CI) Weight (%) Lesion
Wada et al., 2003 (15) 1.13 (0.52–2.45) 62.75 LLN
Kim et al., 2009 (27) 2.02 (0.54–7.50) 21.78 LLN
Zeng et al., 2014 (42) 2.33 (0.49–11.12) 15.47 LLN
Overall (I-squared=0.0%, P=0.608) 1.43 (0.78–2.65) 100.00
F
0.1 0.2 1 5 10 50
LN metastasis
Author OR (95% CI) Weight (%) Lesion
Yoon et al., 1998 (13) 1.52 (0.46–5.04) 3.02 LN
Chow et al., 2003 (14) 0.92 (0.47–1.78) 4.30 LN
Wada et al., 2003 (15) 2.07 (1.15–3.72) 4.49 CLN
Cho et al., 2006 (16) 1.69 (0.76–3.81) 3.95 LN
Lee et al., 2006 (18) 1.27 (0.68–2.39) 4.39 CLN
Roti et al., 2006 (19) 9.92 (2.31–42.62) 2.50 LN
Park et al., 2007 (20) 5.43 (1.85–15.94) 3.29 CLN
Kim et al., 2008 (22) 0.91 (0.40–2.10) 3.89 LN
Lee et al., 2008 (24) 34.10 (4.00–291.00) 1.54 CLN
Tae et al., 2008 (25) 1.69 (0.67–4.25) 3.65 LN
Yoo et al., 2009 (26) 1.83 (0.76–4.42) 3.76 LN
Kim et al., 2009 (27) 1.84 (0.93–3.62) 4.26 CLN
Friguglietti et al., 2011 (28) 3.19 (1.56–6.51) 4.18 LN
Lee et al., 2010 (30) 3.11 (1.63–5.91) 4.35 CLN
Lombardi et al., 2010 (31) 4.39 (2.31–8.36) 4.35 LN
Lee et al., 2011 (32) 1.92 (1.14–3.25) 4.63 CLN
Buffet et al., 2012 (33) 1.02 (0.70–1.48) 4.94 LN
Vasileiadis et al., 2012 (34) 7.68 (3.02–19.58) 3.63 CLN
Zhou et al., 2012 (35) 2.32 (0.95–5.68) 3.73 CLN
Kim et al., 2013 (37) 2.50 (1.64–3.83) 4.84 CLN
Zhao et al., 2013 (8) 2.34 (1.23–4.44) 4.36 LN
Kim et al., 2015 (40) 1.06 (1.47–2.38) 3.93 LN
Zeng et al., 2014 (42) 2.33 (0.49–11.12) 2.32 LLN
Al-Qahtani et al., 2015 (43) 1.90 (0.97–3.73) 4.28 LN
Usluogullari et al., 2015 (44) 9.52 (2.14–42.37) 2.43 LN
Zheng et al., 2013 (38) 8.88 (6.34–12.46) 5.00 LN
Overall (I-squared=80.0%, P=0.000) 2.45 (1.79–3.37) 100.00
D
Fig. 2. (Continued) Summarized statistics and corresponding forest plot on the association of large PTMC (size >5 mm) with the high-risk factors: (A) multifocality, (B) bilaterality, (C) extrathyroidal extension, (D) LN metastasis, (E) CLN metastasis, and (F) LLN metastasis.
PTMC = papillary thyroid microcarcinoma; LN = lymph node; CLN = central lymph node; LLN = lateral lymph node; OR = odds ratio; CI = confidence interval.
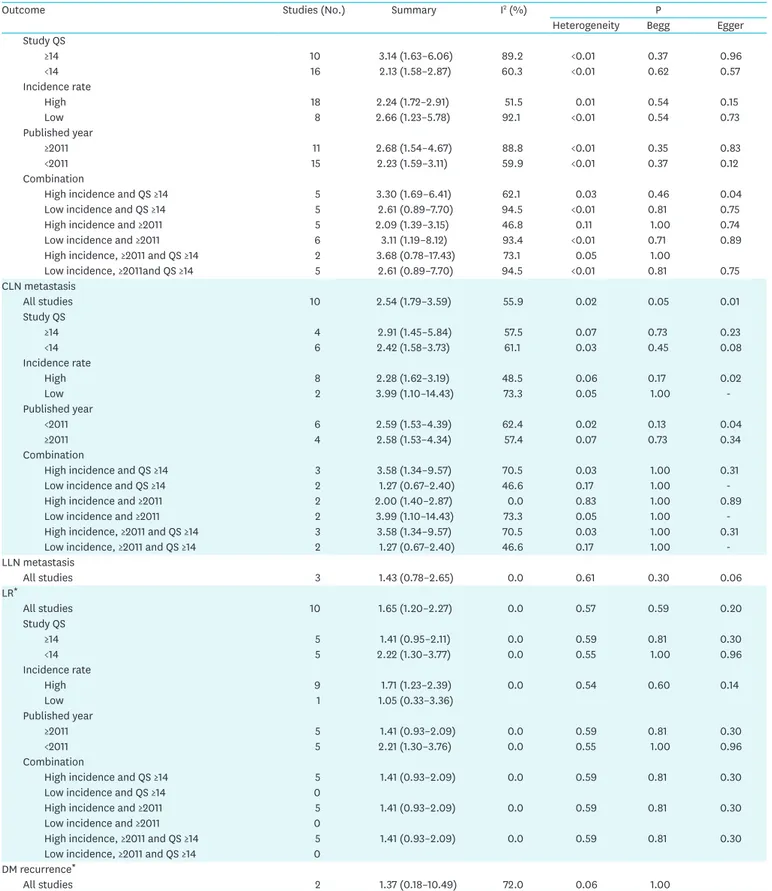
Table 2. Subgroup analyses categorized by incidence rate of thyroid cancer, study quality, and published year of the articles; risk with high-risk factors, and tumor recurrence in large PTMC compared with small PTMC
Outcome Studies (No.) Summary I2 (%) P
Heterogeneity Begg Egger
Multifocality
All studies 17 1.97 (1.61–2.40) 40.7 0.04 0.59 0.27
Study QS
≥14 4 2.45 (1.71–3.51) 53.6 0.09 0.73 0.77
<14 13 1.78 (1.43–2.21) 20.8 0.23 0.86 0.93
Incidence rate
High 13 1.98 (1.56–2.50) 29.9 0.15 0.86 0.46
Low 4 1.93 (1.25–2.98) 69.4 0.02 0.73 0.51
Published year
≥2011 6 2.23 (1.61–3.09) 62.8 0.02 0.26 0.53
<2011 11 1.76 (1.42–2.18) 0.0 0.47 1.00 0.96
Combination
High incidence and QS ≥14 3 2.38 (1.29–4.41) 68.7 0.04 1.00 0.46
Low incidence and QS ≥14 1 2.44 (1.85–3.22)
High incidence and ≥2011 4 1.95 (1.13–3.37) 74.2 0.01 0.31 0.18
Low incidence and ≥2011 2 2.56 (2.00–3.28) 0.0 0.44 1.00
High incidence, ≥2011 and QS ≥14 2 2.71 (1.18–6.18) 79.8 0.03 1.00
Low incidence, ≥2011 and QS ≥14 1 2.44 (1.85–3.22)
Bilaterality
All studies 12 2.39 (1.87–3.06) 40.0 0.07 0.84 0.68
Study QS
≥14 6 2.29 (1.70–3.09) 35.9 0.17 0.26 0.51
<14 6 2.56 (1.61–4.05) 51.7 0.07 1.00 0.93
Incidence rate
High 8 1.84 (1.40–2.40) 0.0 0.77 0.71 0.63
Low 4 3.31 (2.22–4.96) 57.8 0.06 0.73 0.33
Published year
≥2011 7 2.52 (1.79–3.54) 59.4 0.02 1.00 0.88
<2011 5 2.07 (1.44–2.98) 0.0 0.63 1.00 0.80
Combination
High incidence and QS ≥14 3 1.59 (1.04–2.43) 0.0 0.74 1.00 0.31
Low incidence and QS ≥14 3 2.80 (2.02–3.86) 27.2 0.25 1.00 0.62
High incidence and ≥2011 3 1.59 (1.07–2.36) 0.0 0.75 1.00 0.68
Low incidence and ≥2011 4 3.31 (2.22–4.96) 57.8 0.06 0.73 0.33
High incidence, ≥2011 and QS ≥14 2 1.68 (1.02–2.75) 0.0 0.51 1.00
Low incidence, ≥2011 and QS ≥14 3 2.80 (2.02–3.86) 27.2 0.25 1.00 0.62
Extrathyroidal extension
All studies 16 3.42 (2.46–4.75) 64.9 <0.01 0.14 0.05
Study QS
≥14 4 2.85 (2.02–4.02) 0.0 0.70 0.73 0.78
<14 12 3.78 (2.40–5.93) 73.3 <0.01 0.24 0.08
Incidence rate
High 13 3.25 (2.51–4.20) 33.6 0.11 1.00 0.52
Low 3 5.58 (0.81–38.26) 91.3 <0.01 0.29 0.11
Published year
≥2011 5 3.52 (1.93–6.42) 68.8 0.01 0.22 0.07
<2011 11 3.41 (2.25–5.17) 66.6 <0.01 0.53 0.23
Combination
High incidence and QS ≥14
Low incidence and QS ≥14 4 2.85 (2.02–4.02) 0.0 0.70 0.73 0.78
High incidence and ≥2011 0
Low incidence and ≥2011 4 2.63 (1.87–3.70) 4.1 0.37 0.73 0.56
High incidence, ≥2011 and QS ≥14 1 19.78 (6.00–69.90) - - - -
Low incidence, ≥2011 and QS ≥14 3 3.13 (2.11–4.86) 0.0 0.76 0.75 0.79
LN metastasis
All studies 26 2.45 (1.79–3.37) 80.5 <0.01 0.11 0.97
(continued to the next page)
Outcome Studies (No.) Summary I2 (%) P
Heterogeneity Begg Egger
Study QS
≥14 10 3.14 (1.63–6.06) 89.2 <0.01 0.37 0.96
<14 16 2.13 (1.58–2.87) 60.3 <0.01 0.62 0.57
Incidence rate
High 18 2.24 (1.72–2.91) 51.5 0.01 0.54 0.15
Low 8 2.66 (1.23–5.78) 92.1 <0.01 0.54 0.73
Published year
≥2011 11 2.68 (1.54–4.67) 88.8 <0.01 0.35 0.83
<2011 15 2.23 (1.59–3.11) 59.9 <0.01 0.37 0.12
Combination
High incidence and QS ≥14 5 3.30 (1.69–6.41) 62.1 0.03 0.46 0.04
Low incidence and QS ≥14 5 2.61 (0.89–7.70) 94.5 <0.01 0.81 0.75
High incidence and ≥2011 5 2.09 (1.39–3.15) 46.8 0.11 1.00 0.74
Low incidence and ≥2011 6 3.11 (1.19–8.12) 93.4 <0.01 0.71 0.89
High incidence, ≥2011 and QS ≥14 2 3.68 (0.78–17.43) 73.1 0.05 1.00
Low incidence, ≥2011and QS ≥14 5 2.61 (0.89–7.70) 94.5 <0.01 0.81 0.75
CLN metastasis
All studies 10 2.54 (1.79–3.59) 55.9 0.02 0.05 0.01
Study QS
≥14 4 2.91 (1.45–5.84) 57.5 0.07 0.73 0.23
<14 6 2.42 (1.58–3.73) 61.1 0.03 0.45 0.08
Incidence rate
High 8 2.28 (1.62–3.19) 48.5 0.06 0.17 0.02
Low 2 3.99 (1.10–14.43) 73.3 0.05 1.00 -
Published year
<2011 6 2.59 (1.53–4.39) 62.4 0.02 0.13 0.04
≥2011 4 2.58 (1.53–4.34) 57.4 0.07 0.73 0.34
Combination
High incidence and QS ≥14 3 3.58 (1.34–9.57) 70.5 0.03 1.00 0.31
Low incidence and QS ≥14 2 1.27 (0.67–2.40) 46.6 0.17 1.00 -
High incidence and ≥2011 2 2.00 (1.40–2.87) 0.0 0.83 1.00 0.89
Low incidence and ≥2011 2 3.99 (1.10–14.43) 73.3 0.05 1.00 -
High incidence, ≥2011 and QS ≥14 3 3.58 (1.34–9.57) 70.5 0.03 1.00 0.31
Low incidence, ≥2011 and QS ≥14 2 1.27 (0.67–2.40) 46.6 0.17 1.00 -
LLN metastasis
All studies 3 1.43 (0.78–2.65) 0.0 0.61 0.30 0.06
LR*
All studies 10 1.65 (1.20–2.27) 0.0 0.57 0.59 0.20
Study QS
≥14 5 1.41 (0.95–2.11) 0.0 0.59 0.81 0.30
<14 5 2.22 (1.30–3.77) 0.0 0.55 1.00 0.96
Incidence rate
High 9 1.71 (1.23–2.39) 0.0 0.54 0.60 0.14
Low 1 1.05 (0.33–3.36)
Published year
≥2011 5 1.41 (0.93–2.09) 0.0 0.59 0.81 0.30
<2011 5 2.21 (1.30–3.76) 0.0 0.55 1.00 0.96
Combination
High incidence and QS ≥14 5 1.41 (0.93–2.09) 0.0 0.59 0.81 0.30
Low incidence and QS ≥14 0
High incidence and ≥2011 5 1.41 (0.93–2.09) 0.0 0.59 0.81 0.30
Low incidence and ≥2011 0
High incidence, ≥2011 and QS ≥14 5 1.41 (0.93–2.09) 0.0 0.59 0.81 0.30
Low incidence, ≥2011 and QS ≥14 0
DM recurrence*
All studies 2 1.37 (0.18–10.49) 72.0 0.06 1.00
PTMC = papillary thyroid microcarcinoma; QS = quality score; DM = distant metastasis; LN = lymph node; CLN = central lymph node; LLN = lateral lymph node;
LR = locoregional recurrence; RR = relative risk; CI = confidence interval.
*Summary data shown are RR (95% CI).
Table 2. (Continued) Subgroup analyses categorized by incidence rate of thyroid cancer, study quality, and published year of the articles; risk with high-risk factors, and tumor recurrence in large PTMC compared with small PTMC
and those having LNs involvement at diagnosis) have a higher potential for tumor recurrence (4). However, the cancer size was not associated with tumor recurrence (4). However, some studies reported that large sized PTMC were at higher risk for tumor recurrence with various cut-off size of tumor (16,32,40). The present study is the first meta-analysis examining the clinical implication of tumor size (≤0.5 vs. >0.5 cm) on tumor recurrence, including LR, and DM recurrence.
In this meta-analysis, large PTMCs had aggressive characteristics such as multifocality, bilaterality, extrathyroidal extension, and cervical LN metastasis that are well-known prognostic factors in PTC (13,31). Although the result directly does not imply that patients with larger PTMCs are at higher hazard on thyroid cancer specific death, tumor size was associated with aggressive features, which is important to decide the extent of operation, and postoperative treatment including levothyroxine treatment, and radioactive iodine therapy.
Although we found significant association between tumor size and aggressive characteristics, heterogeneity was evident in the results. Therefore, we performed subgroup analysis to identify possible reasons for heterogeneity. In the subgroup analysis by study design type, the heterogeneity of prospective cohort studies was significantly reduced, which indicated that retrospective cohort studies may introduce heterogeneity. By performing a subgroup analysis based on study quality, incidence rate, and published year, there was no significant differences between subgroups except incidence rate, and published year in bilaterality, study quality in extrathyroidal extension.
For LLN metastasis, and LR, there was no significant heterogeneity. In 3 studies included for analysis of LLN metastasis, we found that there was no significant increased risk of LLN metastasis in large PTMC group. In 10 studies included for analysis of LR, we found the higher risk of recurrence in large PTMC group.
Author RR (95% CI) Weight (%) Lesion
Chow et al., 2003 (14) 1.05 (0.33–3.37) 7.59 Locoregional
Han et al., 2006 (17) 3.98 (1.40–11.31) 9.39 Locoregional
Pelizzo et al., 2006 (7) 2.17 (0.88–5.34) 12.61 Locoregional
Kim et al., 2008 (22) 3.42 (0.44–26.60) 2.44 Locoregional
Lombardi et al., 2010 (31) 1.87 (0.40–8.84) 4.28 Locoregional
Ardito et al., 2013 (36) 0.90 (0.45–1.80) 21.33 Locoregional
Kim et al., 2015 (40) 2.38 (0.51–11.18) 4.30 Locoregional
Lee et al., 2014 (41) 1.62 (0.84–3.10) 24.04 Locoregional
Al-Qahtani et al., 2015 (43) 2.20 (0.69–6.99) 7.65 Locoregional
Usluogullari et al., 2015 (44) 1.40 (0.40–5.05) 6.38 Locoregional
Overall (I-squared=0.0%, P=0.571) 1.65 (1.20–2.27) 100.00
A
0.1 0.2 1 5 10 30
Recurrence
Author RR (95% CI) Weight (%) Lesion
Chow et al., 2003 (14) 0.49 (0.11–2.23) 50.28 LR
Al-Qahtani et al., 2015 (43) 3.90 (0.84–18.10) 49.72 LR
Overall (I-squared=72.0%, P=0.059) 1.37 (0.18–10.49) 100.00
B
0.1 0.2 1 5 10 30
Recurrence
Fig. 3. Summarized statistics and corresponding forest plot on the association of large PTMC (size >5 mm) with the risk of tumor recurrence: (A) LR and (B) DM recurrence.
PTMC = papillary thyroid microcarcinoma; LR = locoregional recurrence; DM = distant metastasis; RR = relative risk; CI = confidence interval.
Our meta-analysis has several limitations. Most relevant studies are retrospective studies.
Retrospective studies, even when well controlled, are susceptible to various biases (e.g., selection or information bias). Individual studies may have failed to adjust for potential confounders in the data analysis which could influence the relationship between size of PTMC and aggressive prognostic factors. Only eights articles provided adjusting risk estimates, so the others were calculated crudely.
Strengths of this study include a comprehensive, systematic review of the literature by a multidisciplinary team including specialists in thyroid cancer and epidemiology, with each article reviewed by 2 team members. The subgroup analysis was conducted precisely according to incidence rate of thyroid cancer, the quality of the study, and published year.
In conclusion, this meta-analysis revealed that larger PTMC has a higher potential of tumor recurrence. The results obtained in the present study may provide useful information to identify patients requiring aggressive diagnostic evaluation, treatment, and intensive surveillance at follow-up.
REFERENCES
1. Hedinger CE, Williams ED, Sobin LH. Histological Typing of Thyroid Tumours. 2nd ed. Berlin: Springer- Verlag; 1988.
2. Ito Y, Tomoda C, Uruno T, Takamura Y, Miya A, Kobayashi K, et al. Clinical significance of metastasis to the central compartment from papillary microcarcinoma of the thyroid. World J Surg 2006;30:91-9.
PUBMED | CROSSREF
3. Jacquot-Laperrière S, Timoshenko AP, Dumollard JM, Peoc'h M, Estour B, Martin C, et al. Papillary thyroid microcarcinoma: incidence and prognostic factors. Eur Arch Otorhinolaryngol 2007;264:935-9.
PUBMED | CROSSREF
4. Roti E, degli Uberti EC, Bondanelli M, Braverman LE. Thyroid papillary microcarcinoma: a descriptive and meta-analysis study. Eur J Endocrinol 2008;159:659-73.
PUBMED | CROSSREF
5. Noguchi S, Yamashita H, Uchino S, Watanabe S. Papillary microcarcinoma. World J Surg 2008;32:747-53.
PUBMED | CROSSREF
6. Mazzaferri EL. Managing small thyroid cancers. JAMA 2006;295:2179-82.
PUBMED | CROSSREF
7. Pelizzo MR, Boschin IM, Toniato A, Piotto A, Bernante P, Pagetta C, et al. Papillary thyroid
microcarcinoma (PTMC): prognostic factors, management and outcome in 403 patients. Eur J Surg Oncol 2006;32:1144-8.
PUBMED | CROSSREF
8. Zhao Q, Ming J, Liu C, Shi L, Xu X, Nie X, et al. Multifocality and total tumor diameter predict central neck lymph node metastases in papillary thyroid microcarcinoma. Ann Surg Oncol 2013;20:746-52.
PUBMED | CROSSREF
9. Kim SY, Park JE, Lee YJ, Seo HJ, Sheen SS, Hahn S, et al. Testing a tool for assessing the risk of bias for nonrandomized studies showed moderate reliability and promising validity. J Clin Epidemiol 2013;66:408-14.
PUBMED | CROSSREF
10. McDonald JH. The Handbook of biological statistics [Internet]. Baltimore (MA): Sparky House Publishing; 2007 [cited 2011 Mar 2]. Available from: http://udel.edu/~mcdonald/statpermissions.html 11. Higgins JP, Thompson SG. Quantifying heterogeneity in a meta-analysis. Stat Med 2002;21:1539-58.
PUBMED | CROSSREF
12. Egger M, Davey Smith G, Schneider M, Minder C. Bias in meta-analysis detected by a simple, graphical test. BMJ 1997;315:629-34.
PUBMED | CROSSREF
13. Yoon KS, Oh SS, Park SG, Chung ES. Diagnosis and treatment of papillary thyroid microcarcinoma.
Korean J Head Neck Oncol 1998;14:228-35.
14. Chow SM, Law SC, Au SK, Mang O, Yau S, Yuen KT, et al. Changes in clinical presentation, management and outcome in 1348 patients with differentiated thyroid carcinoma: experience in a single institute in Hong Kong, 1960–2000. Clin Oncol (R Coll Radiol) 2003;15:329-36.
PUBMED | CROSSREF
15. Wada N, Duh QY, Sugino K, Iwasaki H, Kameyama K, Mimura T, et al. Lymph node metastasis from 259 papillary thyroid microcarcinomas: frequency, pattern of occurrence and recurrence, and optimal strategy for neck dissection. Ann Surg 2003;237:399-407.
PUBMED | CROSSREF
16. Cho B, Choi J, Kim JH. A clinical review of papillary microcarcinoma of the thyroid. Korean J Endocr Surg 2006;6:87-93.
CROSSREF
17. Han IW, Choe JH, Han W, Noh DY, Oh SK, Youn YK. Papillary thyroid microcarcinomas: experience at a single institute. Korean J Endocr Surg 2006;6:63-7.
CROSSREF
18. Lee J, Rhee Y, Lee S, Ahn CW, Cha BS, Kim KR, et al. Frequent, aggressive behaviors of thyroid microcarcinomas in Korean patients. Endocr J 2006;53:627-32.
PUBMED | CROSSREF
19. Roti E, Rossi R, Trasforini G, Bertelli F, Ambrosio MR, Busutti L, et al. Clinical and histological characteristics of papillary thyroid microcarcinoma: results of a retrospective study in 243 patients. J Clin Endocrinol Metab 2006;91:2171-8.
PUBMED | CROSSREF
20. Park HL, Kwak JY, Kang SS, Kim DY, Kang HG, Shim JY, et al. The analysis of tumor aggressiveness according to tumor size in occult papillary thyroid carcinoma. J Korean Surg Soc 2007;73:470-5.
21. Pakdaman MN, Rochon L, Gologan O, Tamilia M, Garfield N, Hier MP, et al. Incidence and
histopathological behavior of papillary microcarcinomas: study of 429 cases. Otolaryngol Head Neck Surg 2008;139:718-22.
CROSSREF
22. Kim KM, Cho MS, Choi YH, Bae KS, Kang SJ. The prognostic factors and therapeutic strategy for papillary thyroid microcarcinoma. Korean J Endocr Surg 2008;8:177-82.
CROSSREF
23. Kim TY, Hong SJ, Kim JM, Kim WG, Gong G, Ryu JS, et al. Prognostic parameters for recurrence of papillary thyroid microcarcinoma. BMC Cancer 2008;8:296.
PUBMED | CROSSREF
24. Lee SH, Lee SS, Jin SM, Kim JH, Rho YS. Predictive factors for central compartment lymph node metastasis in thyroid papillary microcarcinoma. Laryngoscope 2008;118:659-62.
PUBMED | CROSSREF
25. Tae K, Chung JH, Lee YS, Choi YY, Park YS, Kim DS, et al. Characteristics of papillary thyroid microcarcinoma according to tumor size. J Korean Thyroid Assoc 2008;1:142-7.
26. Yoo YS, Kim SS, Mun SP, Kim KJ, Chang JH, Min YD, et al. Clinicopathologic findings of micropapillary carcinomas, according to tumor size. J Korean Surg Soc 2009;76:348-54.
CROSSREF
27. Kim YW, Wang SG, Lee JC, Lee BJ, Lee JW, Kim YK, et al. Clinically related factors and features of central compartment neck lymph nodes in thyroid micropapillary carcinoma. Korean J Otorhinolaryngol-Head Neck Surg 2009;52:232-6.
CROSSREF
28. Friguglietti CU, Dutenhefner SE, Brandao LG, Kulcsar MA. Classification of papillary thyroid microcarcinoma according to size and fine-needle aspiration cytology: behavior and therapeutic implications. Head Neck 2011;33:696-701.
PUBMED | CROSSREF
29. Kim JW, Lee DY, Cho YU, Kim CH, Oh YS, Kim YM. Clinical characteristics of papillary thyroid microcarcinoma. Korean J Otorhinolaryngol-Head Neck Surg 2010;53:166-71.
CROSSREF
30. Lee NS, Bae JS, Jeong SR, Jung CK, Lim DJ, Park WC, et al. Risk factors of lymph node metastasis in papillary thyroid microcarcinoma. J Korean Surg Soc 2010;78:82-6.
CROSSREF
31. Lombardi CP, Bellantone R, De Crea C, Paladino NC, Fadda G, Salvatori M, et al. Papillary thyroid microcarcinoma: extrathyroidal extension, lymph node metastases, and risk factors for recurrence in a high prevalence of goiter area. World J Surg 2010;34:1214-21.
PUBMED | CROSSREF
32. Lee KJ, Cho YJ, Kim SJ, Lee SC, Kim JG, Ahn CJ, et al. Analysis of the clinicopathologic features of papillary thyroid microcarcinoma based on 7-mm tumor size. World J Surg 2011;35:318-23.
PUBMED | CROSSREF
33. Buffet C, Golmard JL, Hoang C, Trésallet C, Du Pasquier Fédiaevsky L, Fierrard H, et al. Scoring system for predicting recurrences in patients with papillary thyroid microcarcinoma. Eur J Endocrinol 2012;167:267-75.
PUBMED | CROSSREF
34. Vasileiadis I, Karakostas E, Charitoudis G, Stavrianaki A, Kapetanakis S, Kouraklis G, et al. Papillary thyroid microcarcinoma: clinicopathological characteristics and implications for treatment in 276 patients. Eur J Clin Invest 2012;42:657-64.
PUBMED | CROSSREF
35. Zhou YL, Gao EL, Zhang W, Yang H, Guo GL, Zhang XH, et al. Factors predictive of papillary thyroid micro-carcinoma with bilateral involvement and central lymph node metastasis: a retrospective study.
World J Surg Oncol 2012;10:67.
PUBMED | CROSSREF
36. Ardito G, Revelli L, Giustozzi E, Salvatori M, Fadda G, Ardito F, et al. Aggressive papillary thyroid microcarcinoma: prognostic factors and therapeutic strategy. Clin Nucl Med 2013;38:25-8.
PUBMED | CROSSREF
37. Kim KE, Kim EK, Yoon JH, Han KH, Moon HJ, Kwak JY. Preoperative prediction of central lymph node metastasis in thyroid papillary microcarcinoma using clinicopathologic and sonographic features. World J Surg 2013;37:385-91.
PUBMED | CROSSREF
38. Zheng X, Wei S, Han Y, Li Y, Yu Y, Yun X, et al. Papillary microcarcinoma of the thyroid: clinical characteristics and BRAF(V600E) mutational status of 977 cases. Ann Surg Oncol 2013;20:2266-73.
PUBMED | CROSSREF
39. Karatzas T, Vasileiadis I, Charitoudis G, Karakostas E, Tseleni-Balafouta S, Kouraklis G. Bilateral versus unilateral papillary thyroid microcarcinoma: predictive factors and associated histopathological findings following total thyroidectomy. Hormones (Athens) 2013;12:529-36.
PUBMED | CROSSREF
40. Kim E, Choi JY. Koo DH, Lee KE, Youn YK. Differences in the characteristics of papillary thyroid microcarcinoma ≤5 mm and >5 mm in diameter. Head Neck 2015;37:694-7.
PUBMED | CROSSREF
41. Lee J, Song Y, Soh EY. Central lymph node metastasis is an important prognostic factor in patients with papillary thyroid microcarcinoma. J Korean Med Sci 2014;29:48-52.
PUBMED | CROSSREF
42. Zeng RC, Zhang W, Gao EL, Cheng P, Huang GL, Zhang XH, et al. Number of central lymph node metastasis for predicting lateral lymph node metastasis in papillary thyroid microcarcinoma. Head Neck 2014;36:101-6.
PUBMED | CROSSREF
43. Al-Qahtani KH, Al Asiri M, Tunio MA, Aljohani NJ, Bayoumi Y, Fatani H, et al. Adjuvant Radioactive iodine 131 ablation in papillary microcarcinoma of thyroid: Saudi Arabian experience. J Otolaryngol Head Neck Surg 2015;44:51.
PUBMED | CROSSREF
44. Usluogullari CA, Onal ED, Ozdemir E, Ucler R, Kiyak G, Ersoy PE, et al. A retrospective analysis of prognostic factors predictive of lymph-node metastasis and recurrence in thyroid papillary microcarcinoma. Minerva Endocrinol 2015;40:15-22.
PUBMED