ABSTRACT
BACKGROUND: Increased epicardial fat is known to be associated with the presence and chronicity of atrial fibrillation (AF). Free fatty acids (FFAs) are major components of epicardial fat; however, their potential association with AF in ischemic stroke has not been investigated. We aimed to assess the performance of echocardiographic epicardial fat thickness (EFT) and plasma FFA level in identifying patients with ischemic stroke and AF.
METHODS: We enrolled a total of 214 consecutive patients (mean age, 66.8 ± 12.3 years;
39.7% women) diagnosed with acute ischemic stroke between March 2011 and June 2014. The patients were divided into two groups: ischemic stroke with AF (n = 35, 16.4%) and ischemic stroke without AF (n = 179, 83.6%).
RESULTS: The ischemic stroke with AF group showed significantly higher serum FFA level (1379.7 ± 717.5 vs. 757.8 ± 520.5 uEq/L, p < 0.0001) and EFT (6.5 ± 1.2 vs. 5.3 ± 1.2 mm, p < 0.001) than the group without AF. Multivariable logistic regression analysis demonstrated that age (odds ratio [OR], 1.112), serum FFA level (OR, 1.002), and EFT (OR, 1.740) were independently associated with the ischemic stroke group with AF. EFT and FFA significantly improved the goodness-of-fit and discriminability of the simple regression model including age as a covariate (log likelihood difference, 21.35; p < 0.001; c-index difference, 17.9%; p < 0.001).
CONCLUSIONS: High EFT and serum FFA level were associated with ischemic stroke in patients with AF. Echocardiographic EFT and serum FFA level can play a significant role in identifying ischemic stroke with AF.
Keywords: Stroke; Epicardial fat thickness; Free fatty acids; Atrial fibrillation
INTRODUCTION
Accurate classification of stroke etiology is crucial for optimizing stroke management.1) Cardio-embolic stroke is the most frequently predicted cause of cryptogenic stroke; the most frequent cause of cerebral cardio-embolism is atrial fibrillation (AF), including paroxysmal AF.2) AF is the most common etiology of ischemic stroke; the incidence of stroke in individuals with non-valvular AF is estimated to be 5 times higher than in individuals without AF.3) The prevalence of AF in the whole stroke population has been reported to range
Original Article
Received: Jan 3, 2018 Accepted: Apr 2, 2018 Address for Correspondence:
Bong-Goo Yoo, MD, PhD
Department of Neurology, Kosin University College of Medicine, 262 Gamcheon-ro, Seo-gu, Busan 49267, Korea.
E-mail: [email protected]
*Kyoung-Im Cho and Bong-Joon Kim contributed equally to this work.
Copyright © 2018 Korean Society of Echocardiography
This is an Open Access article distributed under the terms of the Creative Commons Attribution Non-Commercial License (https://
creativecommons.org/licenses/by-nc/4.0/) which permits unrestricted non-commercial use, distribution, and reproduction in any medium, provided the original work is properly cited.
Conflict of Interest
The authors have no financial conflicts of interest.
Kyoung-Im Cho, MD, PhD1,*, Bong-Joon Kim, MD1,*, Sang-Hoon Cho, MD, PhD2, Jin-Hyung Lee, MD3, Meyung-Kug Kim, MD3, and Bong-Goo Yoo, MD, PhD3
1Department of Cardiology, Kosin University College of Medicine, Busan, Korea
2Department of Statistics and Actuarial Science, Soongsil University, Seoul, Korea
3Department of Neurology, Kosin University College of Medicine, Busan, Korea
Epicardial Fat Thickness and Free
Fatty Acid Level are Predictors of
Acute Ischemic Stroke with Atrial
Fibrillation
from 17%−25.6%.4)5) The risk for stroke and thromboembolism in patients with AF has been shown to escalate proportionally with combined vascular risk factors.6)7) However, by routine arrhythmia screening methods, it is difficult to detect the short and usually asymptomatic presentations of paroxysmal AF (also called occult AF).
There is evidence that abnormal levels of plasma free fatty acids (FFAs) are associated with an increased risk of myocardial disease, including AF and heart failure.8)9) Adipose tissue covers a significant portion of the epicardial surface,10) and myocyte-adipocyte cross linking is known to be important in the physiological function of the normal myocardium.11) Myocardial injury and ischemia are followed by changes in the levels of adipocyte-derived biomarkers (FFAs and adipokines) and adipose deposition.12)13) Fat can accumulate around the heart in epicardial adipose tissue or inside the heart as lipid droplets.14) The mechanism by which fatty infiltration promotes arrhythmogenicity is not well characterized.15) Recent studies have shown that increased epicardial adiposity can directly modulate the electrophysiological properties of the heart and ion currents, causing higher arrhythmogenesis in left atrial myocytes, which contributes to an increased risk of AF.16)17)
Epicardial fat is a metabolically active tissue; echocardiography is a useful technique for measuring epicardial fat thickness (EFT).18) Previous studies have demonstrated associations between EFT and coronary artery disease, carotid atherosclerosis, metabolic syndrome, and obesity.19-22) In addition, increased EFT has been shown to be associated with the presence and chronicity of AF.23)
However, the potential association between EFT and FFA plasma level in ischemic stroke with or without AF has not been previously investigated. The objective of this study was to assess the performance of EFT and plasma FFA level in identifying patients with ischemic stroke and AF.
METHODS
We retrospectively included patients with acute ischemic stroke who were admitted within 3 days of symptom onset to a single university hospital between March 2011 and June 2014.
We defined acute ischemic stroke as new focal or global neurological deficits with evidence of acute cerebral infarction on magnetic resonance imaging (MRI). Patients with chronic congestive heart failure, surgery within 60 days, infection, malignancy, rheumatologic disorder, immunological disorder, chronic renal insufficiency, acute coronary syndrome within 30 days before admission, mitral valve disease, and patent foramen ovale were excluded. In addition to the epidemiologic variables age and sex, classic cardiovascular risk factors were also considered. Old age was defined as > 65 years; hypertension was defined as systolic blood pressure (BP) > 140 mmHg and diastolic BP > 90 mmHg by repeated BP measurement or previous diagnosis; and diabetes mellitus (DM) was defined as a fasting plasma glucose level ≥ 126 mg/dL in 2 consecutive assessments or current treatment for DM.
The presence of dyslipidemia was assumed if subjects were taking lipid-lowering drugs or had a high total cholesterol level (> 200 mg/dL). This study complies with the Declaration of Helsinki and was approved by the Institutional Review Board of our institution.
Laboratory measurements
Venous blood was drawn the morning after an overnight fast on the first hospitalized day. The following parameters were obtained by standard techniques on the examination day: total
cholesterol, low-density lipoprotein cholesterol (LDL), high-density lipoprotein cholesterol (HDL), triglycerides, high sensitivity C-reactive protein (hs-CRP), and fibrinogen. Plasma FFA was measured by the enzymatic colorimetric method. Specifically, the NEFA-HR (2) reagent kit (Wako Pure Chemical Industries, Osaka, Japan) was used to quantitatively determine FFA level (Hitachi 7600 Automatic Analyzer, Hitachi-High-Technologies Corporation, Nishi-Shimbashi 1-chome, Minato-ku, Tokyo, Japan). Height and weight were measured and used to calculate body mass index (BMI, kg/m2).
Identification of AF
Electrocardiographs (ECGs) of all selected patients were reviewed. Patients with a sinus rhythm were placed on 24-48 hour Holter monitoring to monitor for paroxysmal AF. Subjects with 12-lead ECGs demonstrating AF or arrhythmia > 30 seconds in duration on Holter monitoring or telemetry recordings were considered to have AF.
Neurologic assessment
All patients with stroke underwent computerized tomography (CT) scans of the brain followed by MRI. CT angiography or magnetic resonance angiography of the brain and neck was also performed for all patients with stroke. Ischemic stroke was classified as large-artery atherosclerosis, cardioembolism, small-vessel occlusion, stroke of other determined etiology, or stroke of undetermined etiology, according to the Trial of Org 10172 in Acute Stroke Treatment (TOAST) criteria.24) Stroke severity on admission was assessed by a stroke neurologist using the Korean version of the National Institutes of Health Stroke Scale (NIHSS).25) Functional outcomes were measured at 3 months after stroke onset using the modified Rankin Scale (mRS).26) Echocardiographic measurement
Standard two-dimensional and strain echocardiography scans were performed on all patients using a 3.5-MHz transducer (Philips iE33, Philips Medical Systems, Bothell, WA, USA). The scans were acquired with the patient in the left lateral decubitus position. All echocardiography examiners were blinded to patient information. Measurements of the thickness of the interventricular septum and posterior wall, the diameter of the left atrium (LA), left ventricular (LV) cavity, and the LV mass index (LVMI) were performed according to the American Society of Echocardiography criteria.27) Pulsed wave Doppler of the transmitral LV inflow was performed in an apical 4-chamber view with the sample volume placed at the level of the mitral valve tips. The following measurements of global LV diastolic function were determined: peak early (E) and late (A) diastolic mitral flow velocity, ratio of E and A, E/A; early (Ea) diastolic mitral annular velocity; deceleration time of the E wave; and LV isovolumetric relaxation time (IVRT).
EFT was measured perpendicular from the free wall of the right ventricle at end-systole in three cardiac cycles according to a method we previously described.28) Epicardial fat was defined as the echo-free space between the outer wall of the myocardium and the visceral layer of the pericardium. The maximum EFT was measured from the point on the free wall of the right ventricle along the midline of the ultrasound beam perpendicular to the aortic annulus as the anatomic landmark. Since a critical issue in EFT measurement is inconsistency of the measurement location, the mean EFT was averaged from the parasternal long axis and parasternal short axis view images. Offline measurement of EFT was performed by two cardiologists who were blinded to the clinical data. Measurement of EFT was
performed at least twice to ensure high reliability. The intra-observer and inter-observer variability values of EFT were 3.2% and 5.6%, respectively.
Statistical analysis
Statistical analyses were performed using SPSS 18.0 for Windows (SPSS Inc., Chicago, IL, USA) and R (http://www.r-project.org). Observed values of continuous and discrete variables were summarized as mean ± standard deviation or as frequency with percentage (%), respectively. The normality assumption was validated using the Kolmogorov–Smirnov test. For continuous variables, mean differences between patient groups (without and with AF) were compared using Student's t-test; differences between categorical variables were compared using the Chi-square test. Multivariable logistic regression models were employed to identify variables independently associated with ischemic stroke with AF. To avoid potential multi-collinearity issues, we performed variable selection in a stepwise fashion.
The Hosmer-Lemeshow test and C-index were utilized to evaluate the calibration and discriminability of logistic regression models, respectively.29) Utilizing likelihood ratio tests and Delong's tests,30) we compared the goodness-of-fit and discriminability of four different logistic regression models: Model 1, which includes age; Model 2, which extends Model 1 with EFT; Model 3, which extends Model 1 with FFA; and Model 4, which extends Model 1 with EFT and FFA. p-values less than 0.05 were considered statistically significant.
RESULTS
Comparison of clinical and echocardiographic characteristics in the ischemic stroke groups with or without AF
The baseline characteristics between patients with stroke with or without AF are shown in Table 1. Patients with ischemic stroke with AF (n = 35) were older, more likely to be female, and had higher prevalence of coronary artery disease and heart failure. In the patients with AF, the mean AF duration was 13.5 months, and the subtypes included paroxysmal Table 1. Baseline clinical characteristics between stroke patients with AF and without AF
Ischemic stroke without AF (n = 179) Ischemic stroke with AF (n = 35) p-value
Age, years 65.4 ± 12.1 75.0 ± 10.6 < 0.001
Age ≥ 65 years, n (%) 92 (51.4) 28 (80) < 0.001
Male gender, n (%) 114 (63.7) 15 (42.9) 0.018
Body mass index, kg/m2 24.2 ± 3.2 24.3 ± 3.3 0.859
Systolic BP, mmHg 160.6 ± 28.4 155.9 ± 25.0 0.322
Diastolic BP, mmHg 88.2 ± 16.5 90.1 ± 16.1 0.534
Heart rate, bpm 78.8 ± 15.0 89.0 ± 25.3 0.027
Body temperature, °C 36.5 ± 0.4 36.4 ± 0.5 0.265
Alcohol, n (%) 72 (40.4) 10 (28.6) 0.128
Current smoking, n (%) 83 (46.4) 13 (37.1) 0.199
Hypertension, n (%) 137 (76.5) 30 (85.7) 0.165
Diabetes, n (%) 75 (41.9) 9 (25.7) 0.052
Dyslipidemia, n (%) 56 (31.3) 8 (22.9) 0.216
Coronary artery disease, n (%) 12 (6.7) 7 (20.0) 0.020
Heart failure, n (%) 4 (2.2) 5 (14.3) 0.007
Previous stroke, n (%) 28 (15.6) 4 (11.4) 0.366
Previous medication, n (%)
Antiplatelets 34 (19.0) 8 (22.9) 0.374
Anticoagulant 3 (1.7) 3 (8.6) 0.057
Statin 14 (7.8) 7 (20.0) 0.036
Atrial fibrillation
Mean duration (month) 13.46
Paroxysmal, n (%) 12 (34.3)
Persistent or chronic, n (%) 23 (65.7)
All values are presented as mean± SD.
AF: atrial fibrillation, BP: blood pressure.
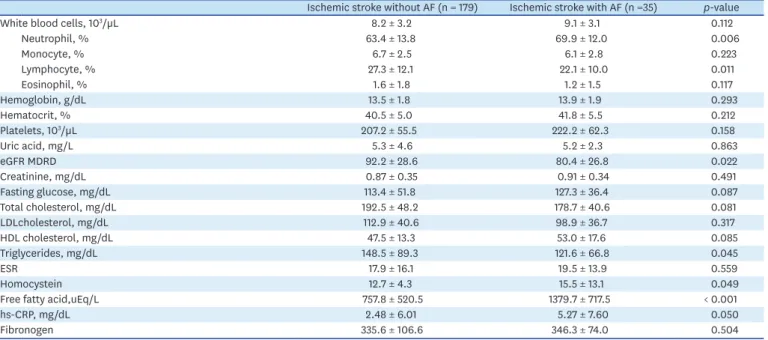
AF (34.3%) and non-paroxsymal AF (persistent and chronic AF, 65.7%). Regarding the laboratory data, patients with ischemic stroke with AF showed significantly higher serum FFA level (1379.7 ± 717.5 vs. 757.8 ± 520.5 uEq/L, p < 0.001) (Table 2).
Comparison of echocardiographic parameters showed that the stroke with AF group had significantly greater EFT (6.5 ± 1.2 vs. 5.3 ± 1.2 mm, p < 0.001), LA diameter, and LA volume compared with the stroke without AF group (Table 3). In subgroup analysis, there were no significant differences in EFT (paroxysmal vs persistent or permanent: 6.36 ± 1.06 vs 6.50 ± 1.28 mm, p = 0.769) and FFA (paroxysmal vs persistent/permanent: 1060.2 ± 557.6 vs 1546.4 ± 745.3 uEq/L, p = 0.056).
Table 2. Baseline laboratory characteristics between stroke patients with AF and without AF
Ischemic stroke without AF (n = 179) Ischemic stroke with AF (n =35) p-value
White blood cells, 103/µL 8.2 ± 3.2 9.1 ± 3.1 0.112
Neutrophil, % 63.4 ± 13.8 69.9 ± 12.0 0.006
Monocyte, % 6.7 ± 2.5 6.1 ± 2.8 0.223
Lymphocyte, % 27.3 ± 12.1 22.1 ± 10.0 0.011
Eosinophil, % 1.6 ± 1.8 1.2 ± 1.5 0.117
Hemoglobin, g/dL 13.5 ± 1.8 13.9 ± 1.9 0.293
Hematocrit, % 40.5 ± 5.0 41.8 ± 5.5 0.212
Platelets, 103/µL 207.2 ± 55.5 222.2 ± 62.3 0.158
Uric acid, mg/L 5.3 ± 4.6 5.2 ± 2.3 0.863
eGFR MDRD 92.2 ± 28.6 80.4 ± 26.8 0.022
Creatinine, mg/dL 0.87 ± 0.35 0.91 ± 0.34 0.491
Fasting glucose, mg/dL 113.4 ± 51.8 127.3 ± 36.4 0.087
Total cholesterol, mg/dL 192.5 ± 48.2 178.7 ± 40.6 0.081
LDLcholesterol, mg/dL 112.9 ± 40.6 98.9 ± 36.7 0.317
HDL cholesterol, mg/dL 47.5 ± 13.3 53.0 ± 17.6 0.085
Triglycerides, mg/dL 148.5 ± 89.3 121.6 ± 66.8 0.045
ESR 17.9 ± 16.1 19.5 ± 13.9 0.559
Homocystein 12.7 ± 4.3 15.5 ± 13.1 0.049
Free fatty acid,uEq/L 757.8 ± 520.5 1379.7 ± 717.5 < 0.001
hs-CRP, mg/dL 2.48 ± 6.01 5.27 ± 7.60 0.050
Fibronogen 335.6 ± 106.6 346.3 ± 74.0 0.504
All values are presented as mean ± SD.
AF: atrial fibrillation, eGFR: estimated glomerular filteration rate, ESR: erythrocyte sedimentation rate, HDL: high density lipoprotein, hs-CRP: high sensitivity C-reactive protein, LDL: low density lipoprotein, MDRD: modification of diet in renal disease.
Table 3. Comparison of echocardiographic parameters between stroke patients with AF and without AF
Ischemic stroke without AF (n = 179) Ischemic stroke with AF (n =35) p-value
EFT, short axis view, mm 5.4 ± 1.3 6.5 ± 1.4 < 0.001
EFT, long axis view, mm 5.2 ± 1.3 6.5 ± 1.1 < 0.001
EFT, mean, mm 5.3 ± 1.2 6.5 ± 1.2 < 0.001
LVEDD, mm 47.8 ± 6.4 45.7 ± 5.1 0.092
LVESD, mm 30.9 ± 6.1 29.3 ± 4.8 0.186
IVSTd, mm 12.4 ± 2.1 12.6 ± 2.2 0.614
PWTd, mm 10.8 ± 1.7 10.6 ± 1.8 0.716
LVMI, g/m2 125.4 ± 42.3 115.8 ± 25.8 0.128
EF, % 64.7 ± 8.5 64.8 ± 9.5 0.962
LA diameter, mm 36.4 ± 5.8 42.4 ± 9.4 0.003
LA volume, mL 19.6 ± 7.2 31.2 ± 13.1 0.002
Aorta diameter, mm 34.2 ± 3.7 34.6 ± 4.6 0.675
E velocity, cm/sec 0.67 ± 0.17 0.81 ± 0.21 0.003
E/Ea 10.9 ± 4.2 11.6 ± 5.3 0.531
All values are presented as the mean ± SD.
E: peak early diastolic mitral filling velocity, Ea: mitral annular velocity, EF: ejection fraction, EFT: epicardial fat thickness, IVSTd: diastolic interventricularseptal wall thickness, LA: left atrial diameter, LVEDD: left ventricular end-diastolic diameter, LVESD: left ventricular end-systolic diameter, LVMI: left ventricular mass index, PWTd: diastolic posterior wall thickness.
Comparison of neurologic clinical characteristics showed that the stroke with AF group had significantly higher hospital mortality (22.9% vs. 6.7%, p = 0.007), mRS discharge (2.8 ± 2.1 vs. 1.6 ± 1.5, p < 0.004), and NIHSS admission (7.4 ± 5.4 vs. 3.4 ± 4.2, p < 0.001) (Table 4) than the stroke without AF group.
Association of serum FFA and EFT with ischemic stroke with AF
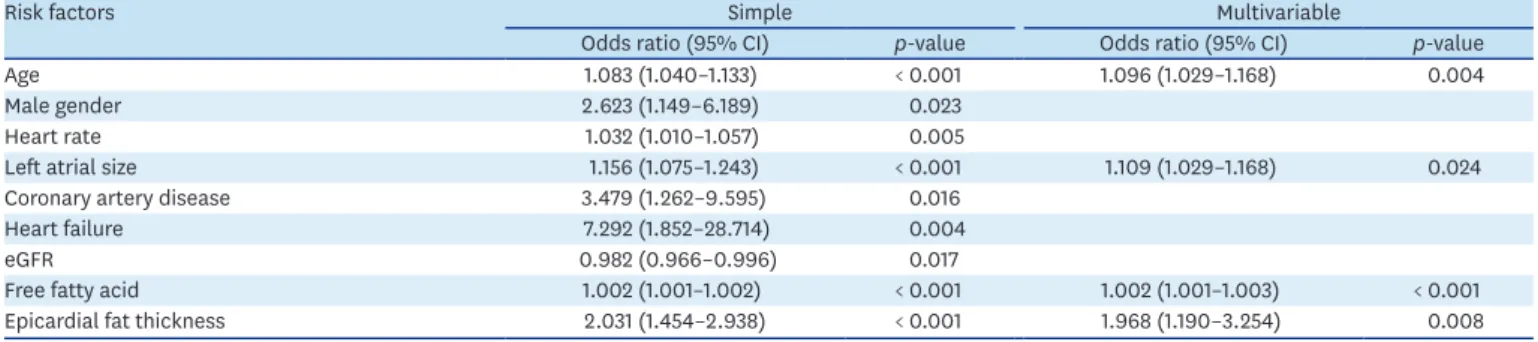
According to simple logistic regression analysis, marginally significant baseline covariates of age, gender, heart rate, eGFR, LA size, presence of coronary artery disease, heart failure, FFA, and EFT were entered into a multivariable logistic regression model (Table 5). According to the final model, which was selected in stepwise fashion, both EFT (adjusted odds ratio [OR], 2.031; 95% confidence interval [CI], 1.454–2.938; p < 0.001) and FFA [adjusted OR, 1.002; 95% CI, 1.001–1.002; p < 0.001] were independent prognostic factors associated with ischemic stroke with AF after adjusting for age (Table 5). There was no evidence against the goodness-of-fit of the fitted model (Hosmer-Lemeshow test statistic = 5.16; df = 8; p = 0.741).
As shown in Table 6, the incremental effect of EFT and FFA on ischemic stroke with AF was investigated by comparing four different logistic regression models. Comparison of these models showed that EFT and FFA significantly improved the goodness-of-fit and Table 4. Clinical characteristics between stroke patients with AF and without AF
Ischemic stroke without AF (n = 179) Ischemic stroke with AF (n =35) p-value
In hospital death, n (%) 12 (6.7) 8 (22.9) 0.007
NIHSS admission 3.4 ± 4.2 7.4 ± 5.4 < 0.001
mRS discharge 1.6 ± 1.5 2.8 ± 2.1 0.004
All values are presented as the mean ± SD.
AF: atrial fibrillation, mRS: modified Rankin Scale, NIHSS: National Institutes of Health Stroke Scale.
Table 5. Risk factors significantly associated with the ischemic stroke patients having AF according to logistic regression models
Risk factors Simple Multivariable
Odds ratio (95% CI) p-value Odds ratio (95% CI) p-value
Age 1.083 (1.040–1.133) < 0.001 1.096 (1.029–1.168) 0.004
Male gender 2.623 (1.149–6.189) 0.023
Heart rate 1.032 (1.010–1.057) 0.005
Left atrial size 1.156 (1.075–1.243) < 0.001 1.109 (1.029–1.168) 0.024
Coronary artery disease 3.479 (1.262–9.595) 0.016
Heart failure 7.292 (1.852–28.714) 0.004
eGFR 0.982 (0.966–0.996) 0.017
Free fatty acid 1.002 (1.001–1.002) < 0.001 1.002 (1.001–1.003) < 0.001
Epicardial fat thickness 2.031 (1.454–2.938) < 0.001 1.968 (1.190–3.254) 0.008
AF: atrial fibrillation, eGFR: estimated glomerular filteration rate.
Table 6. Incremental values of free fatty acid and epicardial fat thickness assessed by the goodness-of-fit and discriminability
Likelihood ratio test Discriminability
LogLik Diff. p-value* c-index (%) Diff.(%) p-value†
Model 1 −68.51 73.21
Model 2 −59.48 83.27
Model 3 −50.80 88.49
Model 4 −47.15 91.06
Model 1 vs. Model 2 9.03 < 0.001 10.06 0.011
Model 1 vs. Model 3 17.70 < 0.001 15.27 0.001
Model 1 vs. Model 4 21.35 < 0.001 17.85 < 0.001
c-index: Harrell's concordance index, Diff: difference, LogLik: loglikelihood, Model 1: age, Model 2: Model 1 + EFT, Model 3: Model 1 + FFA, Model 4: Model 1 + EFT + FFA.
*p-value is based on the loglikelihood ratio test.
†p-value is based on the Delong's test.
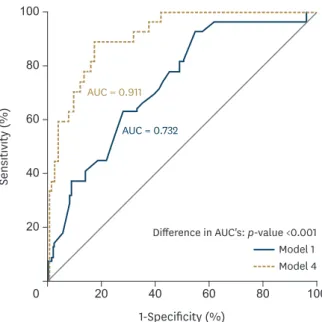
discriminability of Model 1 (log likelihood difference, 21.35; p < 0.001; c-index difference, 17.9%; p < 0.001) (Figure 1).
DISCUSSION
It is critically important to detect AF in patients with stroke to predict prognosis and determine the optimal treatment direction. We found that, among patients with ischemic stroke, those with AF had poorer prognosis, significantly higher serum FFA level, and a significantly higher mean EFT than those without AF. In addition, serum FFA level was significantly correlated with EFT and serum FFA level and EFT were independently associated with stroke with AF.
Some previous studies have concluded that EFT performs well in predicting the risk of AF.31)32) Also, there is evidence supporting that abnormal levels of plasma FFAs are associated with an increased risk of AF,8) and that FFAs can predict the prognosis of AF.33)34) Seo et al.35) reported that FFA was highest in cardioembolic stroke compared with other stroke subtypes, and also that FFA was higher in patients with AF than in those without AF. We recently demonstrated that FFA is a promising biomarker for predicting outcome events in stroke with AF, in addition to the CHADS2 and CHA2DS2-VASc scoring systems.36) The present study is the first to report that both EFT and FFA are independent prognostic factors of ischemic stroke with AF.
We suggest two possible mechanisms that can explain our results. First, since FFA is involved in the formation of visceral fat such as epicardial fat, increased FFA levels can cause thicker EFT, which can contribute to the occurrence of AF. An increase in FFA tracer storage per adipocyte is associated with AF.37) In obesity, increased numbers of adipocytes in epicardial fat tissue can cause high arrhythmogenesis in LA myocytes. This arrhythmogenesis might play an important role in the pathophysiology of AF.16) Abed et al.17) demonstrated that obesity
1-Specificity (%) 60
40
20
0 20 40 60 80 100
Sensitivity (%)
80 100
Difference in AUC's: p-value <0.001 AUC = 0.732
AUC = 0.911
Model 1 Model 4
Figure 1. Comparison of four different logistic regression models of the incremental effect of EFT and FFA on ischemic stroke with AF. Comparison of these models showed that EFT and FFA significantly improved the goodness-of-fit and discriminability of Model 1 (log likelihood difference, 21.35; p < 0.001; c-index difference, 17.9%; p < 0.001).
AF: atrial fibrillation, AUC: area under curve, EFT: epicardial fat thickness, FFA: free fatty acid.
progression changes LA size, conduction, histology, and expression of profibrotic mediators;
moreover, these changes were associated with more persistent AF. Second, increased levels of FFAs might result in ion channel changes due to their properties, which could increase arrhythmogenesis in LA myocytes. A recent study demonstrated that the FFA stearic acid in sheep atrial myocytes disrupts their t-tubular architecture and remodels properties of membrane ionic currents, with potential implications for arrhythmogenesis.38)
Similar to a previous study reporting that ischemic stroke due to cardioembolism had poorer prognosis than ischemic stroke, due to macro- or microangiopathy,5) we also report a higher rate of in-hospital death and significantly higher mRS and NIHSS values in the ischemic stroke with AF group. Since a cardioembolism source can cause major stroke without atherosclerosis of the cerebral vessel, it is difficult to predict stroke occurrence. In cardioembolic stroke, structural diseases such as mitral valve disease or patent foramen ovale can be detected by echocardiography. However, patients with paroxysmal AF, which is not always detected by 24-hour Holter monitoring, could be missed. An ongoing prospective study is testing possible correlations between detection of AF by an implantable ECG recorder and gene mutations in patients with cryptogenic stroke/TIA; results will be available in 2018.39) Additive biomarkers or clinical variables that have the power to discriminate between ischemic stroke with or without AF would be helpful for outlining future directions, specifically how to best determine whether AF is present and/or whether to start anticoagulant therapy. The results from our study will be useful for identifying undetected AF in patients with ischemic stroke.
Our study has several limitations. First, the studied population with AF was relatively small (n = 35), limiting generalization of our results. Second, we assessed AF by documented ECG or Holter monitoring, meaning that patients with paroxysmal AF without documented ECG could have been missed. Third, with respect to baseline characteristics, the ischemic stroke with AF group showed higher prevalence of old age, heart failure, coronary artery disease, and statin use; these characteristics might have influenced the development of stroke or prognosis. Fourth, the retrospective design could have led to selection bias. Fifth, we did not analyze abdominal circumference; thus, an effect of central obesity cannot be ruled out.
Finally, serum FFA levels were based on a single measurement. Future studies are needed to test whether serum FFA levels change over time and whether FFA levels on subsequent tests remain a predictor of the severity of stroke with AF.
CONCLUSION
To the best of our knowledge, this is the first work to demonstrate associations of EFT and serum FFA with ischemic stroke with AF. Echocardiographic EFT and serum FFA levels could facilitate the identification of patients with ischemic stroke with AF.
REFERENCES
1. Kim BJ, Kim JS. Ischemic stroke subtype classification: an asian viewpoint. J Stroke 2014;16:8-17.
PUBMED | CROSSREF
2. Sanak D, Hutyra M, Kral M, et al. Paroxysmal atrial fibrillation in young cryptogenic ischemic stroke: A 3-week ECG Holter monitoring study. Biomed Pap Med Fac Univ Palacky Olomouc Czech Repub 2015;159:283-7.
PUBMED | CROSSREF
3. Mozaffarian D, Benjamin EJ, Go AS, et al.American Heart Association Statistics Committee and Stroke Statistics Subcommittee. Heart disease and stroke statistics--2015 update: a report from the American Heart Association. Circulation 2015;131:e29-322.
PUBMED | CROSSREF
4. Tsang TS, Petty GW, Barnes ME, et al. The prevalence of atrial fibrillation in incident stroke cases and matched population controls in Rochester, Minnesota: changes over three decades. J Am Coll Cardiol 2003;42:93-100.
PUBMED | CROSSREF
5. Grau AJ, Weimar C, Buggle F, et al. Risk factors, outcome, and treatment in subtypes of ischemic stroke:
the German stroke data bank. Stroke 2001;32:2559-66.
PUBMED | CROSSREF
6. Gage BF, Waterman AD, Shannon W, Boechler M, Rich MW, Radford MJ. Validation of clinical
classification schemes for predicting stroke: results from the National Registry of Atrial Fibrillation. JAMA 2001;285:2864-70.
PUBMED | CROSSREF
7. European Heart Rhythm AssociationEuropean Association for Cardio-Thoracic SurgeryCamm AJ, Kirchhof P, Lip GY, et al. Guidelines for the management of atrial fibrillation: the Task Force for the Management of Atrial Fibrillation of the European Society of Cardiology (ESC). Eur Heart J 2010;31:2369-429.
PUBMED | CROSSREF
8. Khawaja O, Bartz TM, Ix JH, et al. Plasma free fatty acids and risk of atrial fibrillation (from the Cardiovascular Health Study). Am J Cardiol 2012;110:212-6.
PUBMED | CROSSREF
9. Djoussé L, Benkeser D, Arnold A, et al. Plasma free fatty acids and risk of heart failure: the Cardiovascular Health Study. Circ Heart Fail 2013;6:964-9.
PUBMED | CROSSREF
10. Al Chekakie MO, Welles CC, Metoyer R, et al. Pericardial fat is independently associated with human atrial fibrillation. J Am Coll Cardiol 2010;56:784-8.
PUBMED | CROSSREF
11. Ouchi N. Obesity: Progress in diagnosis and treatment; Topics, IV. Recent topics; 3. Obesity and new secretory factors; 2) Sfrp 5 acts as a novel adipocytokine that affects metabolic function. Nihon Naika Gakkai Zasshi 2011;100:1002-7.
PUBMED | CROSSREF
12. Chhabra L, Spodick DH. Role of epicardial fat in atrial fibrillation after coronary artery bypass surgery. Am J Cardiol 2014;113:2090.
PUBMED | CROSSREF
13. Hendrickson SC, St Louis JD, Lowe JE, Abdel-aleem S. Free fatty acid metabolism during myocardial ischemia and reperfusion. Mol Cell Biochem 1997;166:85-94.
PUBMED | CROSSREF
14. Mazzali G, Fantin F, Zoico E, et al. Heart fat infiltration in subjects with and without coronary artery disease. J Clin Endocrinol Metab 2015;100:3364-71.
PUBMED | CROSSREF
15. Pantanowitz L. Fat infiltration in the heart. Heart 2001;85:253.
PUBMED | CROSSREF
16. Lin YK, Chen YC, Chen JH, Chen SA, Chen YJ. Adipocytes modulate the electrophysiology of atrial myocytes: implications in obesity-induced atrial fibrillation. Basic Res Cardiol 2012;107:293.
PUBMED | CROSSREF
17. Abed HS, Samuel CS, Lau DH, et al. Obesity results in progressive atrial structural and electrical remodeling: implications for atrial fibrillation. Heart Rhythm 2013;10:90-100.
PUBMED | CROSSREF
18. Hirata Y, Yamada H, Kusunose K, et al. Clinical utility of measuring epicardial adipose tissue thickness with echocardiography using a high-frequency linear probe in patients with coronary artery disease. J Am Soc Echocardiogr 2015;28:1240-1246.e1.
PUBMED | CROSSREF
19. Tok D, Çağli K, Kadife I, et al. Impaired coronary flow reserve is associated with increased
echocardiographic epicardial fat thickness in metabolic syndrome patients. Coron Artery Dis 2013;24:191-5.
PUBMED | CROSSREF
20. Kim BJ, Kim BS, Kang JH. Echocardiographic epicardial fat thickness is associated with arterial stiffness.
Int J Cardiol 2013;167:2234-8.
PUBMED | CROSSREF
21. Kim BJ, Kim BS, Kang JH. Echocardiographic epicardial fat thickness is associated with coronary artery calcification - results from the CAESAR study. Circ J 2015;79:818-24.
PUBMED | CROSSREF
22. Sengul C, Cevik C, Ozveren O, et al. Echocardiographic epicardial fat thickness is associated with carotid intima-media thickness in patients with metabolic syndrome. Echocardiography 2011;28:853-8.
PUBMED | CROSSREF
23. Stojanovska J, Kazerooni EA, Sinno M, et al. Increased epicardial fat is independently associated with the presence and chronicity of atrial fibrillation and radiofrequency ablation outcome. Eur Radiol 2015;25:2298-309.
PUBMED | CROSSREF
24. Adams HP Jr, Bendixen BH, Kappelle LJ, et al. Classification of subtype of acute ischemic stroke.
Definitions for use in a multicenter clinical trial. TOAST. Trial of Org 10172 in Acute Stroke Treatment.
Stroke 1993;24:35-41.
PUBMED | CROSSREF
25. Oh MS, Yu KH, Lee JH, et al. Validity and reliability of a Korean version of the national institutes of health stroke scale. J Clin Neurol 2012;8:177-83.
PUBMED | CROSSREF
26. Bonita R, Beaglehole R. Recovery of motor function after stroke. Stroke 1988;19:1497-500.
PUBMED | CROSSREF
27. Levy D, Savage DD, Garrison RJ, Anderson KM, Kannel WB, Castelli WP. Echocardiographic criteria for left ventricular hypertrophy: the Framingham Heart Study. Am J Cardiol 1987;59:956-60.
PUBMED | CROSSREF
28. Shim IK, Cho KI, Kim HS, Heo JH, Cha TJ. Impact of Gender on the Association of Epicardial Fat Thickness, Obesity, and Circadian Blood Pressure Pattern in Hypertensive Patients. J Diabetes Res 2015;2015:924539.
PUBMED | CROSSREF
29. Harrell FE Jr, Califf RM, Pryor DB, Lee KL, Rosati RA. Evaluating the yield of medical tests. JAMA 1982;247:2543-6.
PUBMED | CROSSREF
30. DeLong ER, DeLong DM, Clarke-Pearson DL. Comparing the areas under two or more correlated receiver operating characteristic curves: a nonparametric approach. Biometrics 1988;44:837-45.
PUBMED | CROSSREF
31. Acet H, Ertaş F, Akıl MA, et al. New inflammatory predictors for non-valvular atrial fibrillation:
echocardiographic epicardial fat thickness and neutrophil to lymphocyte ratio. Int J Cardiovasc Imaging 2014;30:81-9.
PUBMED | CROSSREF
32. Soeki T, Sata M. Role of epicardial adipose tissue in atrial fibrillation. Circ J 2012;76:2738-9.
PUBMED | CROSSREF
33. Spence JD. Free fatty acids and stroke from atrial fibrillation. Can J Neurol Sci 2011;38:803.
PUBMED | CROSSREF
34. Jickling GC, Spence JD. Free fatty acids to predict recurrent ischemic stroke. Neurology 2014;82:1110-1.
PUBMED | CROSSREF
35. Seo WK, Kim J, Kim YH, et al. Elevated free fatty acid is associated with cardioembolic stroke subtype.
Can J Neurol Sci 2011;38:874-9.
PUBMED | CROSSREF
36. Choi JY, Jung JM, Kwon DY, et al. Free fatty acid as an outcome predictor of atrial fibrillation-associated stroke. Ann Neurol 2016;79:317-25.
PUBMED | CROSSREF
37. Koutsari C, Dumesic DA, Patterson BW, Votruba SB, Jensen MD. Plasma free fatty acid storage in subcutaneous and visceral adipose tissue in postabsorptive women. Diabetes 2008;57:1186-94.
PUBMED | CROSSREF
38. O'Connell RP, Musa H, Gomez MS, et al. Free fatty acid effects on the atrial myocardium: membrane ionic currents are remodeled by the disruption of T-tubular architecture. PLoS One 2015;10:e0133052.
PUBMED | CROSSREF
39. Petrovičová A, Kurča E, Brozman M, et al. Detection of occult paroxysmal atrial fibrilation by implantable long-term electrocardiographic monitoring in cryptogenic stroke and transient ischemic attack population: a study protocol for prospective matched cohort study. BMC Cardiovasc Disord 2015;15:160.
PUBMED | CROSSREF