White Blood Cell, Hemoglobin and Platelet Distribution Width as Short-Term Prognostic Markers in Patients with Acute Myocardial Infarction
The aim of this study was to assess the prognostic value of combined use of white blood cell (WBC), hemoglobin (Hb), and platelet distribution width (PDW) in patients with acute myocardial infarction (AMI). This study included 1,332 consecutive patients with AMI.
Patients were categorized into complete blood cell (CBC) group 0 (n = 346, 26.0%), 1 (n = 622, 46.7%), 2 (n = 324, 24.3%), and 3 (n = 40, 3.0%) according to the sum of the value defined by the cut-off levels of WBC (1, ≥ 14.5 × 10³/μL; 0, < 14.5 × 10³/μL), Hb (1, < 12.7 g/dL; 0, ≥ 12.7 g/dL), and PDW (1, ≥ 51.2%; 0: < 51.2%). In-hospital death occurred in 59 (4.4%) patients. Patients who died during index hospitalization had higher WBC and PDW and lower Hb. The patients could be stratified for in-hospital mortality according to CBC group; 1.2%, 2.7%, 9.0%, and 22.5% in CBC groups 0, 1, 2, and 3 (P < 0.001), respectively. In multivariate logistic regression analysis, CBC group ≥ 2 (odds ratio, 3.604; 95% confidence interval, 1.040-14.484, P = 0.043) was an independent predictor for in-hospital death. The prognostic impact of the combined use of CBC markers remained significant over 12 months. In conclusions, combination of WBC, Hb, and PDW, a cheap and simple hematologic marker, is useful in early risk stratification of patients with AMI.
Keywords: Hemoglobins; Leukocytes; Platelet Distribution Width; Myocardial Infarction Myung Hwan Bae, Jang Hoon Lee,
Dong Heon Yang, Hun Sik Park, Yongkeun Cho, and Shung Chull Chae Department of Internal Medicine, Kyungpook National University School of Medicine, Daegu, Korea
Received: 11 September 2013 Accepted: 11 February 2014 Address for Correspondence:
Shung Chull Chae, MD
Department of Internal Medicine, Kyungpook National University Hospital, 200 Dongduk-ro, Jung-gu, Daegu 700-721, Korea
Tel: +82.53-420-5527, Fax: +82.53-426-2046 E-mail: [email protected]
This research was supported by Kyungpook National University Research Fund, 2012
http://dx.doi.org/10.3346/jkms.2014.29.4.519 • J Korean Med Sci 2014; 29: 519-526
INTRODUCTION
Effective risk stratification is important for management of pa- tients with acute myocardial infarction (AMI) (1, 2). Complete blood cell (CBC) is a simple, easily and widely performed labo- ratory test. Among several CBC markers, the predictive value of white blood cell (WBC) and hemoglobin (Hb) for short- and long-term survival in patients with AMI has been relatively well established (3-8), although some studies have refuted this asso- ciation (9-11).
Although thromboembolic events are among the major causes of mortality in patients with AMI (12, 13), limited evalua- tion of platelet distribution width (PDW), a progressive platelet activation marker, has been conducted in patients with coronary artery disease (CAD), with conflicting results (14-17).
Simple combination of these CBC markers, all connected in some way with AMI prognosis, has never been tested in risk as- sessment for AMI. We attempted to determine whether the combined use of WBC, Hb, and PDW had prognostic value in patients with AMI.
MATERIALS AND METHODS
This observational study included 1,365 consecutive patients with AMI who were enrolled in the Korea Acute Myocardial In- farction Registry (KAMIR) from the authors’ single center be- tween November 2005 and February 2009. KAMIR is a Korean, prospective, open, observational, multicenter on-line registry of AMI supported by the Korean Society of Cardiology since November 2005. Details of KAMIR have been published (18).
PDW levels were collected retrospectively, because they had not been entered into the KAMIR database. AMI was diagnosed by characteristic clinical presentation, serial changes on ECG suggesting infarction, and an increase in cardiac enzymes (19).
ST-segment elevation myocardial infarction (STEMI) was de- fined by new ST elevation in ≥ 2 contiguous leads, measuring
> 0.2 mV in leads V1–3, or 0.1 mV in all other leads. Peripheral blood samples for laboratory tests, except for lipid profile, were collected at admission. Peripheral venous blood specimens were sampled in VacutainerTM tubes containing K-ethylenedi- aminetetraacetic acid and applied immediately to an automat- ed hematologic analyzer, K-4500 (TOA Medical Electronics, Kobe, Japan) for WBC count, Hb concentration, and PDW. Oth- Cardiovascular Disorders
er biochemical variables were measured using standard labora- tory techniques. The estimated glomerular filtration rate (eGFR) was calculated according to the Cockcroft–Gault formula. In ad- dition to laboratory findings, baseline demographic characteris- tics, initial vital signs, and cardiovascular risk factors were evalu- ated. Hypertension was defined as a previous medical diagnosis of hypertension, use of antihypertensive medications or blood pressure ≥ 140/90 mmHg. History of hyperlipidemia was de- fined as the diagnosis previously made by a physician or treat- ment with lipid-lowering medications. Analysis of ECG in all pa- tients was performed by the attending cardiologists.
We assessed in-hospital and 12-month mortalities. At 12 months after the index AMI, follow-up data were obtained by review of the medical records and/or telephone interview with the patient or family members.
Data are presented as mean ± standard deviation for continu- ous variables and percentages for categorical variables. N-termi- nal Pro-B-type natriuretic peptide (NT-ProBNP) was log-trans- formed to reduce the effect of skewed distribution of the data.
Patients were categorized as with and without in-hospital mor- tality. Receiver-operating characteristics (ROC) curve analysis was used for determination of the cut-off values for prediction of
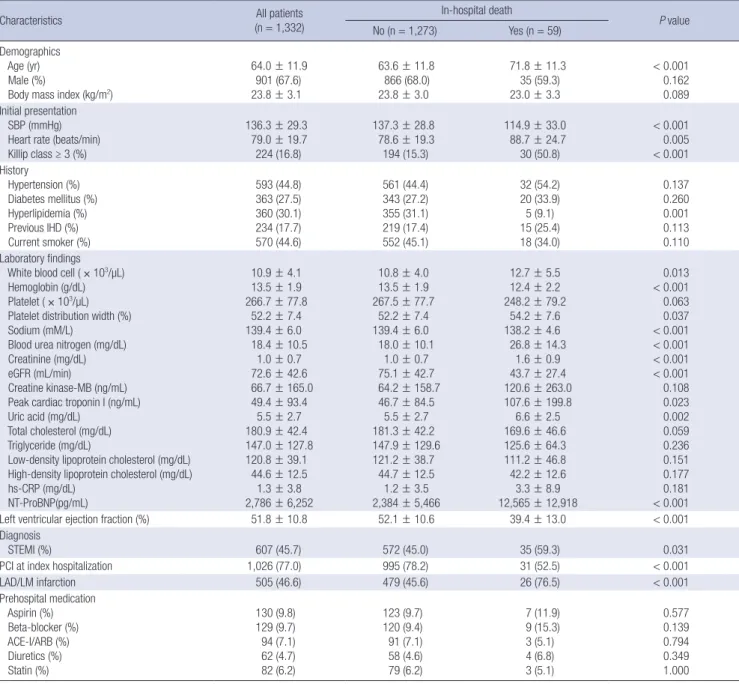
Table 1. Baseline clinical characteristics of the patients with and without in-hospital death
Characteristics All patients
(n = 1,332)
In-hospital death
P value No (n = 1,273) Yes (n = 59)
Demographics Age (yr) Male (%)
Body mass index (kg/m2)
64.0 ± 11.9 901 (67.6) 23.8 ± 3.1
63.6 ± 11.8 866 (68.0) 23.8 ± 3.0
71.8 ± 11.3 35 (59.3) 23.0 ± 3.3
< 0.001 0.162 0.089 Initial presentation
SBP (mmHg) Heart rate (beats/min) Killip class ≥ 3 (%)
136.3 ± 29.3 79.0 ± 19.7 224 (16.8)
137.3 ± 28.8 78.6 ± 19.3 194 (15.3)
114.9 ± 33.0 88.7 ± 24.7 30 (50.8)
< 0.001 0.005
< 0.001 History
Hypertension (%) Diabetes mellitus (%) Hyperlipidemia (%) Previous IHD (%) Current smoker (%)
593 (44.8) 363 (27.5) 360 (30.1) 234 (17.7) 570 (44.6)
561 (44.4) 343 (27.2) 355 (31.1) 219 (17.4) 552 (45.1)
32 (54.2) 20 (33.9) 5 (9.1) 15 (25.4) 18 (34.0)
0.137 0.260 0.001 0.113 0.110 Laboratory findings
White blood cell ( × 103/µL) Hemoglobin (g/dL) Platelet ( × 103/µL) Platelet distribution width (%) Sodium (mM/L)
Blood urea nitrogen (mg/dL) Creatinine (mg/dL) eGFR (mL/min)
Creatine kinase-MB (ng/mL) Peak cardiac troponin I (ng/mL) Uric acid (mg/dL)
Total cholesterol (mg/dL) Triglyceride (mg/dL)
Low-density lipoprotein cholesterol (mg/dL) High-density lipoprotein cholesterol (mg/dL) hs-CRP (mg/dL)
NT-ProBNP(pg/mL)
10.9 ± 4.1 13.5 ± 1.9 266.7 ± 77.8
52.2 ± 7.4 139.4 ± 6.0 18.4 ± 10.5
1.0 ± 0.7 72.6 ± 42.6 66.7 ± 165.0 49.4 ± 93.4
5.5 ± 2.7 180.9 ± 42.4 147.0 ± 127.8 120.8 ± 39.1
44.6 ± 12.5 1.3 ± 3.8 2,786 ± 6,252
10.8 ± 4.0 13.5 ± 1.9 267.5 ± 77.7
52.2 ± 7.4 139.4 ± 6.0 18.0 ± 10.1
1.0 ± 0.7 75.1 ± 42.7 64.2 ± 158.7 46.7 ± 84.5
5.5 ± 2.7 181.3 ± 42.2 147.9 ± 129.6 121.2 ± 38.7
44.7 ± 12.5 1.2 ± 3.5 2,384 ± 5,466
12.7 ± 5.5 12.4 ± 2.2 248.2 ± 79.2
54.2 ± 7.6 138.2 ± 4.6 26.8 ± 14.3
1.6 ± 0.9 43.7 ± 27.4 120.6 ± 263.0 107.6 ± 199.8 6.6 ± 2.5 169.6 ± 46.6 125.6 ± 64.3 111.2 ± 46.8 42.2 ± 12.6 3.3 ± 8.9 12,565 ± 12,918
0.013
< 0.001 0.063 0.037
< 0.001
< 0.001
< 0.001
< 0.001 0.108 0.023 0.002 0.059 0.236 0.151 0.177 0.181
< 0.001
Left ventricular ejection fraction (%) 51.8 ± 10.8 52.1 ± 10.6 39.4 ± 13.0 < 0.001
Diagnosis
STEMI (%) 607 (45.7) 572 (45.0) 35 (59.3) 0.031
PCI at index hospitalization 1,026 (77.0) 995 (78.2) 31 (52.5) < 0.001
LAD/LM infarction 505 (46.6) 479 (45.6) 26 (76.5) < 0.001
Prehospital medication Aspirin (%) Beta-blocker (%) ACE-I/ARB (%) Diuretics (%) Statin (%)
130 (9.8) 129 (9.7) 94 (7.1) 62 (4.7) 82 (6.2)
123 (9.7) 120 (9.4) 91 (7.1) 58 (4.6) 79 (6.2)
7 (11.9) 9 (15.3) 3 (5.1) 4 (6.8) 3 (5.1)
0.577 0.139 0.794 0.349 1.000
SBP, systolic blood pressure; IHD, ischemic heart disease; eGFR, estimated glomerular filtration rate; hs-CRP, high-sensitivity C-reactive protein; NT-ProBNP, N-terminal Pro–B- type natriuretic peptide; STEMI, ST-segment elevation myocardial infarction; PCI, percutaneous coronary intervention; LAD/LM, left anterior descending/Left main; ACE-I/ARB, angiotensin-converting enzyme inhibitor/ angiotensin II receptor blocker.
in-hospital mortality. Comparisons were made using the Stu- dent’s t-test for continuous variables and the chi-square test for categorical variables. Multivariate logistic regression analysis and Cox proportional hazard model were used for determina- tion of independent parameters for in-hospital and 12-month mortalities, respectively. Sequential models were developed in order to examine the incremental prognostic value of the para- meters. Incremental factors added to the model at each step were considered significant when the difference in the log-likelihood associated with each model corresponded to P < 0.05. Twelve- month survival was analyzed by the Kaplan-Meier method. The P values were 2-sided, and P < 0.05 was considered significant.
SPSS version 15.0 for Windows (SPSS Inc, Chicago, IL, USA) was used in performance of statistical analysis.
Ethics statement
KAMIR was approved by the institutional review board of Kyung- pook National University Hospital (No. KNUH-07-0093). Inform- ed consent was waived by the board.
RESULTS
Of the consecutive 1,365 patients, 15 patients were on hemodi- alysis due to end stage renal disease and 18 patients who had underlying malignancy were excluded, leaving 1,332 patients in the final analysis. Baseline characteristics of the patients are shown in Table 1. The mean age of patients was 64 ± 12 yr and
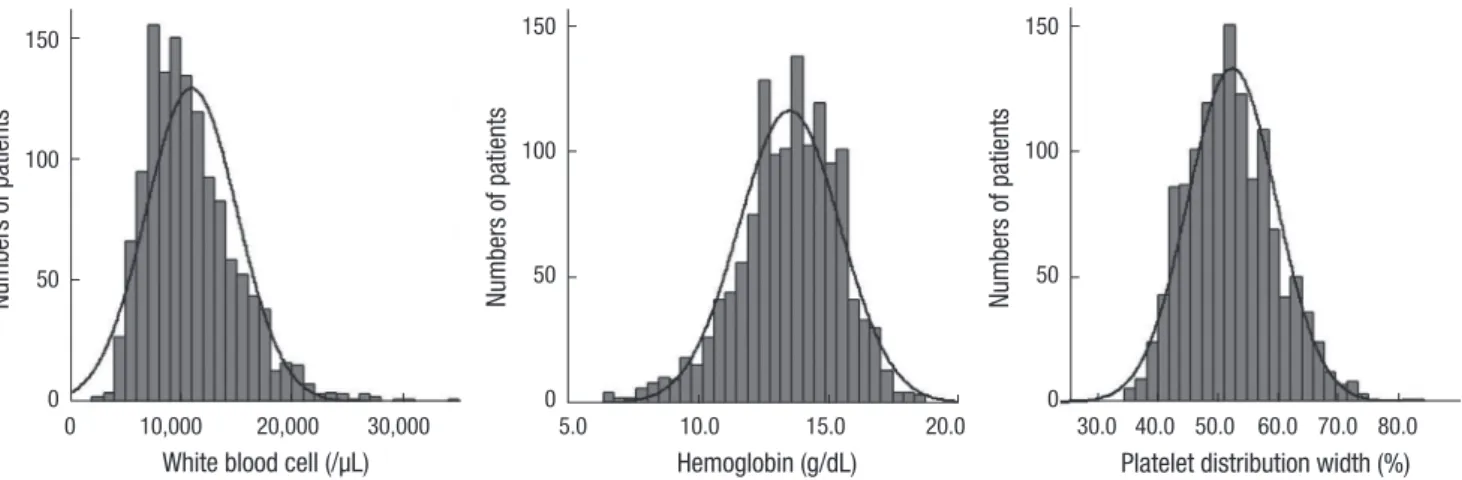
901 (67.6%) were men. Mean levels of WBC, Hb, and PDW were 10.9 ± 4.1 × 10³/μL, 13.5 ± 1.9 g/dL, and 52.2 ± 7.4%, respec- tively (Fig. 1). WBC count showed positive correlation with the Killip class (r = 0.148), levels of creatinine (r = 0.081), peak car- diac troponin I (cTnI) (r = 0.189), and Hb (r = 0.174), but show- ed negative correlation with age (r = -0.130) and left ventricular ejection fraction (LVEF) (r = -0.091) (Table 2). Hb level showed negative correlation with age (r = -0.442), Killip class (r = -0.242), levels of creatinine (r = -0.289), and log NT-ProBNP (r = -0.427), but showed positive correlation with LVEF (r = 0.137) and WBC count (r = 0.174). PDW showed weak positive correlation with Killip class (r = 0.091) and levels of creatinine (r = 0.075) and log NT-ProBNP (r = 0.096).
During the index admission, there were 59 (4.4%) in-hospital deaths. In the univariate analysis, age, heart rate, Killip class ≥ 3, levels of WBC, PDW, blood urea nitrogen, peak cTnI, uric acid, and NT-ProBNP were significantly higher; and systolic blood pressure (SBP), previous history of hyperlipidemia, levels of Hb, sodium, and eGFR were significantly lower in patients with in- hospital death. Echocardiographic data were not available in 95 patients, including 34 (58%) who died before undergoing echo- cardiographic examination. Therefore, it was not included in the multivariate analysis. STEMI was more common in patients with in-hospital death. Percutaneous coronary intervention (PCI) was performed less frequently at index hospitalization among patients with in-hospital death and left anterior descen- ding artery location of infarct-related artery was significantly
Table 2. Correlation among baseline characteristics including white blood cell, hemoglobin, and PDW
Markers Correlation coefficients
Age LVEF Killip class Creatinine Log NT-ProBNP Peak cTnI WBC Hemoglobin PDW
WBC -0.130* -0.091* 0.148* 0.081* 0.023 0.189* 0.174* -0.007
Hemoglobin -0.442* 0.137* -0.242* -0.289* -0.427* 0.068* 0.174* 0.021
PDW 0.017 -0.030 0.091* 0.075* 0.096* -0.005 -0.007 0.021
*Means P value < 0.05. LVEF, left ventricular ejection fraction; Log NT-ProBNP, log N-terminal Pro–B-type natriuretic peptide; Peak cTnI, peak cardiac troponin I; WBC, white blood cell; PDW, platelet distribution width.
150
100
50
0
Numbers of patients
White blood cell (/µL) 0 10,000 20,000 30,000
150
100
50
0
Numbers of patients
Hemoglobin (g/dL)
5.0 10.0 15.0 20.0 150
100
50
0
Numbers of patients
Platelet distribution width (%) 30.0 40.0 50.0 60.0 70.0 80.0 Fig. 1. Histograms of the distribution of baseline white blood cell (10.9 ± 4.1 × 10³/µL, range 2.7-34.8 ± 103/µL), hemoglobin (13.5 ± 1.9 g/dL, range 6.4-18.6 g/dL), and platelet distribution width (52.2 ± 7.4%, range 35.3-82.9%).
higher in patients with in-hospital death. However, regarding gender, body mass index, current smoking status, pre-hospital medication, history of hypertension, diabetes mellitus, and ischemic heart disease, levels of creatine kinase-MB, cholester- ol, and high-sensitivity C-reactive protein, no significant differ- ences were observed between the groups.
WBC count (12.7 ± 5.5 × 10³/μL vs 10.8 ± 4.0 × 10³/μL, P = 0.013) and PDW (54.2 ± 7.6% vs 52.2 ± 7.4%, P = 0.037) were significantly higher in the group with in-hospital death than in the group without. However, Hb level was significantly lower in patients with in-hospital death (12.4 ± 2.2 g/dL vs 13.5 ± 1.9 g/dL, P < 0.001). Area under the ROC curve for prediction of in-hos- pital death was 0.602 (95% CI, 0.517-0.687) for WBC count, 0.669 (95% CI, 0.595-0.742) for Hb, and 0.581 (95% CI, 0.507-0.655) for PDW. The best cut-off levels of WBC, Hb, and PDW by ROC curve analysis were 14.5 × 10³/μL, 12.7 g/dL, and 51.2%, respec- tively. Patients with high Killip class and high serum levels of creatinine and NT-ProBNP had significantly lower hemoglobin level and higher WBC and PDW (Table 3). Patients were catego- rized into four CBC groups; group 0 (n = 346, 26.0%), 1 (n = 622, 46.7%), 2 (n = 324, 24.3%), and 3 (n = 40, 3.0%) according to the sum of values defined by the cut-off levels of WBC (1, ≥ 14.5 ×
103/μL; 0, < 14.5 × 10³/μL), Hb (1, < 12.7 g/dL; 0, ≥ 12.7 g/dL), and PDW (1, ≥ 51.2%; 0, < 51.2%). CBC group showed positive correlation with age (r = 0.189, P < 0.001), Killip class (r = 0.243, P < 0.001), levels of creatinine (r = 0.238, P < 0.001), and log NT-ProBNP (r = 0.278, P < 0.001), but showed negative correla- tion with LVEF (r = -0.124, P < 0.001). Significant differences in in-hospital death were observed among CBC group 0 (1.2%), 1 (2.7%), 2 (9.0%), and 3 (22.5%) (P < 0.001) (Fig. 2).
In multivariate logistic regression analysis, after adjusting for multiple clinical prognostic factors, WBC ≥ 14.5 × 10³/μL (odds ratio [OR], 2.077; 95% confidence interval [CI], 0.674-6.398, P = 0.203), Hb < 12.7 g/dL (OR, 1.285; 95% CI, 0.374-4.415, P = 0.691), and PDW ≥ 51.2% (OR, 1.697; 95% CI, 0.495-5.819, P = 0.401) were not independent predictors for in-hospital death when they were entered separately into the model (Table 4). However, when the sum of the three CBC markers was entered into the model, CBC group ≥ 2 (OR, 3.604; 95% CI, 1.040-12.484, P = 0.043) was an independent predictor for in-hospital death in addition to SBP (OR, 0.962; 95% CI, 0.943-0.981, P < 0.001), Kil- lip class ≥ 3 (OR, 3.432; 95% CI, 1.053-11.181, P = 0.041), left an- terior descending artery infarction (OR, 4.194; 95% CI, 1.046- 16.812, P = 0.043), log NT-ProBNP (OR, 3.853; 95% CI, 1.461- Table 3. Clinical characteristics of patients with acute myocardial infarction according to the levels of white blood cell, hemoglobin, and platelet distribution width
Characteristics
White blood cell
P value
Hemoglobin
P value
Platelet distribution width
P value
< 14.5 × 10³/µL (n = 1,101)
≥ 14.5 × 10³/µL (n = 231)
< 12.7 g/dL (n = 417)
≥ 12.7 g/dL (n = 915)
< 51.2%
(n = 612)
≥ 51.2%
(n = 720) Demographics
Age (yr) Male (%) BMI (kg/m2)
64.4 ± 11.7 743 (67.5) 23.9 ± 3.0
62.1 ± 12.4 158 (68.4) 23.4 ± 3.3
0.007 0.787 0.066
70.8 ± 10.0 173 (41.5) 22.7 ± 3.1
60.8 ± 11.4 728 (79.6) 24.3 ± 2.9
< 0.001
< 0.001
< 0.001
63.7 ± 12.0 395 (64.5) 23.8 ± 3.2
64.2 ± 11.8 506 (70.3) 23.8 ± 3.0
0.512 0.026 0.842 Initial presentation
SBP (mmHg) Heart rate (beats/min) Killip class ≥ 3 (%)
137.6 ± 29.1 77.8 ± 18.5 159 (14.5)
130.0 ± 29.8 85.0 ± 23.7 65 (28.1)
0.001
< 0.001
< 0.001
132.3 ± 32.4 81.8 ± 22.4 116 (27.9)
138.1 ± 27.6 77.8 ± 18.2 108 (11.8)
0.003 0.002
< 0.001
137.6 ± 29.8 78.3 ± 18.1 83 (13.6)
135.3 ± 2 8.9 79.6 ± 20.8
141 (19.6)
0.185 0.237 0.004 History
Hypertension (%) Diabetes mellitus (%) Hyperlipidemia (%) Previous IHD (%)
504 (46.1) 306 (28.0) 297 (30.2) 209 (19.1)
89 (38.9) 57 (25.0) 63 (29.7) 25 (11.0)
0.046 0.353 0.893 0.003
214 (52.1) 141 (34.4) 96 (26.2) 84 (20.5)
379 (41.6) 222 (24.4) 264 (31.8) 150 (16.5)
< 0.001
< 0.001 0.048 0.073
276 (45.4) 159 (26.2) 173 (30.7) 89 (14.7)
317 (44.3) 204 (28.6) 187 (29.5) 145 (20.3)
0.699 0.327 0.655 0.009 Laboratory findings
WBC ( × 103/µL) Hemoglobin (g/dL) PDW (%) Sodium (mM/L) Creatinine (mg/dL) Peak cTnI (ng/mL) NT-ProBNP (pg/mL)
9.5 ± 2.5 13. 4 ± 1.9 52.2 ± 7.3 139.5 ± 6.2 1.0 ± 0.5 43.8 ± 88.2 2,506 ± 5,801
17.7 ± 3.1 13.8 ± 2.1 52.5 ± 7.9 139.0 ± 4.4 1.2 ± 0.9 75.6 ± 111.4 4,083 ± 7,904
< 0.001 0.008 0.664 0.260 0.009
< 0.001
< 0.001
10.3 ± 4.4 11.2 ± 1.3 52.1 ± 7.4 138.1 ± 9.0 1.2 ± 1.0 45.6 ± 99.5 5,942 ± 9,154
11.2 ± 3.9 14.5 ± 1.2 52.3 ± 7.4 140.0 ± 3.8 0.9 ± .0.3 51.1 ± 90.5 1,383 ± 3,588
< 0.001
< 0.001 0.691
< 0.001
< 0.001 0.321
< 0.001
10.9 ± 4.0 13.5 ± 1.8 46.0 ± 3.6 139.3 ± 7.4 1.0 ± 0.5 51.7 ± 94.4 2,051 ± 4,934
10.9 ± 4.2 13.4 ± 2.0 57.6 ± 5.2 139.4 ± 4.4 1.1 ± 0.7 47.4 ± 92.5 3,415 ± 7,134
0.888 0.683
< 0.001 0.746 0.001 0.410
< 0.001 LVEF (%) 52.1 ± 10.9 50.5 ± 10.6 0.052 49.8 ± 11.1 52.7 ± 10.5 < 0.001 52.1 ± 10.6 51.3 ± 11.0 0.345 Diagnosis
STEMI (%) 452 (41.2) 155 (67.1) < 0.001 165 (39.8) 442 (48.4) 0.004 293 (48.1) 314 (43.6) 0.101 PCI at index hospitalization 846 (76.8) 180 (77.9) 0.722 271 (65.0) 755 (82.5) < 0.001 493 (80.6) 533 (74.0) 0.005
LAD/LM infarction 406 (45.4) 99 (52.1) 0.093 129 (44.9) 376 (47.2) 0.516 235 (46.1) 270 (47.0) 0.752
In-hospital death (%) 36 (3.3) 23 (10.0) < 0.001 37 (8.9) 22 (2.4) < 0.001 17 (2.8) 42 (5.8) 0.007 12-month mortality (%) 70 (6.4) 36 (15.6) < 0.001 64 (15.3) 42 (4.6) < 0.001 30 (4.9) 76 (10.6) < 0.001 BMI, body mass index; SBP, systolic blood pressure; IHD, ischemic heart disease; WBC, white blood cell; PDW, platelet distribution width; Peak cTnI, peak cardiac troponin I;
NT-ProBNP, N-terminal Pro–B-type natriuretic peptide; LVEF, left ventricular ejection fraction; STEMI, ST-segment elevation myocardial infarction; PCI, percutaneous coronary intervention; LAD/LM, left anterior descending/Left main.
25
20
15
10
5
0 Group 0 (n = 346)
In-hospital death (%)
Group 1 (n = 622)
Group 2 (n = 324)
Group 3 (n = 40) 1.2
2.7 P < 0.001
9.0
22.5
Fig. 2. In-hospital death categorized according to the cut-off levels of white blood cell, hemoglobin, and platelet distribution width. Significant differences in in-hospital death were observed among CBC groups 0 (1.2%), 1 (2.7%), 2 (9.0%), and 3 (22.5%) (P <
0.001).
Table 4. Multivariate logistic regression analysis for the in-hospital death (n = 1,332)
Variables Model 1 Model 2 Model 3 Model 4
OR P value OR P value OR P value OR 95% CI P value
Age 1.056 0.099 1.050 0.141 1.506 0.091 1.058 0.990-1.132 0.098
Male 1.141 0.825 1.125 0.840 1.096 0.876 1.255 0.388-4.058 0.705
Heart rate 1.011 0.415 1.012 0.380 1.012 0.366 1.007 0.981-1.033 0.613
SBP 0.959 < 0.001 0.959 < 0.001 0.960 < 0.001 0.962 0.943-0.981 < 0.001
Hyperlipidemia 0.387 0.216 0.382 0.212 0.392 0.223 0.413 0.092-1.851 0.248
Killip class ≥ 3 3.375 0.043 3.597 0.033 3.327 0.045 3.432 1.053-11.181 0.041
PCI at index hospitalization 0.560 0.500 0.531 0.453 0.590 0.537 0.773 0.142-4.217 0.766
LAD/LM infarction 3.175 0.092 3.040 0.103 3.269 0.087 4.194 1.046-16.812 0.043
Creatinine ≥ 2 4.000 0.072 4.696 0.041 4.838 0.036 3.965 0.908-17.318 0.067
Sodium 0.991 0.713 0.994 0.802 0.990 0.685 0.985 0.936-1.037 0.561
Log NT-ProBNP 3.930 0.005 3.723 0.006 3.909 0.005 3.853 1.461-10.162 0.006
Peak cTnI 1.004 0.003 1.004 0.002 1.004 0.004 1.004 1.001-1.006 0.012
WBC ≥ 14.5 × 10³/µL 2.077 0.203
Hb < 12.7 g/dL 1.285 0.691
PDW ≥ 51.2% 1.697 0.401
CBC group ≥ 2 3.604 1.040-12.484 0.043
OR, odds ratio; BMI, body mass index; CI, confidence interval; SBP, systolic blood pressure; PCI, percutaneous coronary intervention; LAD/LM, left anterior descending/Left main;
Log NT-ProBNP, log N-terminal Pro–B-type natriuretic peptide; Peak cTnI, peak cardiac troponin I; WBC, white blood cell; PDW, platelet distribution width; CBC, complete blood cell.
110 105 100 95 90 85 80 75 70 65
60 Conventional
risk factor Conventional risk factor + peak cTnl
Conventional risk factor + peak cTnl + log NT-Pro
BNP
Conventional risk factor + peak cTnl + log NT-Pro BNP
+ CBC group ≥ 2 P < 0.001
P < 0.001 P = 0.001
P = 0.038
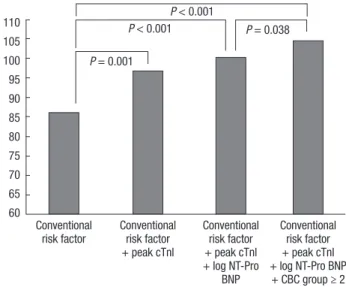
Fig. 3. Incremental prognostic value of combined use of white blood cell, hemoglo- bin, and platelet distribution width in the Cox proportional-hazard model. CBC Group
≥ 2 has incremental prognostic value. Conventional risk factors included age, gender, heart rate, systolic blood pressure, hyperlipidemia, Killip class ≥ 3, percutaneous cor- onary intervention at index hospitalization, left anterior descending artery infarction, creatinine ≥ 2 mg/dL, and sodium.
10.162, P = 0.006), and peak cTnI (OR, 1.004; 95% CI, 1.001-1.006, P = 0.012). In addition, CBC group ≥ 2 had incremental prog- nostic value (chi-square = 4.3, P = 0.038) (Fig. 3).
During the 12-month follow-up period after the index ad- mission, 52 patients were lost, leaving 1280 patients in the anal- ysis for 12-month mortality, and there were 106 (8.3%) all cause deaths. Kaplan-Meier curves showed a significant gradual in- crease in the risk of 12-month mortality according to the sum of the CBC markers (3.0%, 5.4%, 14.7%, and 46.2% of groups 0, 1, 2, and 3, P < 0.001) (Fig. 4A). When patients with in-hospital death
were excluded, 12-month mortality was still significantly differ- ent among the CBC groups (1.8%, 2.6%, 6.0%, and 30.0% of group 0, 1, 2, and 3, P < 0.001) (Fig. 4B). In the Cox-proportional haz- ard model, CBC group ≥ 2 (hazard ratio, 2.067; 95% CI, 1.017- 4.204, P = 0.045) was an independent predictor for 12-month mortality (Table 5).
DISCUSSION
In the current study, the combination of WBC, Hb, and PDW
was useful in prediction of in-hospital death in patients with AMI, although they did not have independent value, individual- ly. In addition, it had an important incremental prognostic value to the combination of conventional risk factors, peak cTnI and NT-ProBNP, which are strong prognostic markers in AMI, both STEMI and non-STEMI (1, 20). The prognostic impact of the combined use of CBC markers remained significant over 12 months after index admission.
CBC, a cheap and simple hematologic marker, has been used for risk stratification of patients with AMI (3-8). Among several CBC markers, the predictive values of WBC and hemoglobin in relation to short- and long-term survival in patients with AMI has been relatively well established (3-8). Inflammation has been shown to be an important risk factor for development of cardiovascular events and several studies have also reported an association of elevated WBC count with increased risk of short- and long-term mortality in patients with AMI (3-7). Although
the mechanism responsible for these associations is unknown, several hypotheses have been postulated, including a leukocyte- mediated diminished microcirculatory perfusion (21) and greater thrombus formation at the site of the atherosclerotic plaque (22), leukocyte-mediated no reflow (23), indirect cardio- toxicity mediated through proinflammatory cytokines (24), and negative inotropic effects on the myocardium via the nitric oxide synthesis pathway (25). Anemia, also a common comorbidity in patients with AMI, is associated with increased mortality (6-8).
In a recent study with STEMI patients, lower hemoglobin level
≤ 12.5 g/dL, similar to the cut-off level of hemoglobin (12.65 g/
dL) in our study, was an independent predictor for in-hospital mortality (8). The relationship between low hemoglobin and in- creased mortality could basically be explained by lower oxygen delivery to myocardial tissue (26, 27). However, negative studies for the prognostic value of CBC markers in AMI patients have also been reported (9-11). In STEMI patients who underwent primary PCI, WBC count did not show statistical association with an increased incidence of one-month and/or 12-month death (9, 10). Hemoglobin was not an independent predictor for 12-month death in patients with STEMI who underwent PCI (11). In our previous study with AMI patients, WBC and hemo- globin were not associated with six-month major adverse cardi- ac events (28). In the current study, after adjusting for multiple confounding variables, an elevated WBC count and lower he- moglobin were also not independent predictors for in-hospital and 12-month death. Patients with high WBC count and/or low hemoglobin had concomitantly low LVEF, high Killip class, high creatinine, and high NT-ProBNP.
Unlike WBC and hemoglobin, limited evaluation of PDW has been conducted in patients with CAD, with conflicting results (14-17). In a small study reported by Ihara et al. (16), lower PDW was observed in patients with angiographic coronary artery ste- nosis. However, in a small study of 194 patients reported by Khan- Table 5. Cox-Proportional Hazard Model for 12-month death (n = 1,280)
Variables Hazard ratio 95% CI P value
Age 1.061 1.021-1.102 0.002
Male 1.283 0.673-2.448 0.449
Heart rate 1.005 0.991-1.019 0.510
SBP 0.979 0.970-0.989 < 0.001
Hyperlipidemia 0.571 0.245-1.331 0.194
Killip class ≥ 3 2.435 1.241-4.777 0.010
PCI at index hospitalization 0.434 0.200-0.938 0.034
LAD/LM infarction 2.603 1.262-5.373 0.010
Creatinine ≥ 2 1.528 0.558-4.181 0.409
Sodium 0.998 0.963-1.033 0.892
Log NT-ProBNP 2.731 1.589-4.693 < 0.001
Peak cTnI 1.002 1.000-1.003 0.051
CBC group ≥ 2 2.067 1.017-4.204 0.045
CI, confidence interval; SBP, systolic blood pressure; PCI, percutaneous coronary in- tervention; LAD/LM, left anterior descending/Left main; Log NT-ProBNP, log N-termi- nal Pro–B-type natriuretic peptide; Peak cTnI, peak cardiac troponin I; CBC, complete blood cell.
Fig. 4. Kaplan-Meier curves for 12-month mortality according to the sum of values defined by the cut-off levels of CBC markers in all patients (A) and in-hospital survivors (B).
0 60 120 180 240 300 360 Follow-up duration (days)
100 80 60 40 20 0
12-month mortality (%)
Group 0 (n = 336) Group 1 (n = 593) Group 2 (n = 312) Group 3 (n = 39)
3.0% P = 0.099 P < 0.001 P < 0.001 14.7%
5.4%
46.2%
0 60 120 180 240 300 360
Follow-up duration (days) B
A
100 80 60 40 20 0
12-month mortality (%)
Group 0 (n = 332) Group 1 (n = 576) Group 2 (n = 283) Group 3 (n = 30)
P = NS 1.8%
8.0%
30.0%
2.6% P = 0.013
P < 0.001
dekar et al. (17), significantly higher PDW was observed in pa- tients with AMI and unstable angina, compared to those with stable CAD and the control group. Thromboembolic events are a major cause of mortality in patients with AMI (12, 13). Reliable markers of platelet activation, such as thrombin-antithrombin complex, β-thromboglobulin, and soluble platelet P-selectin have been investigated. However, these indices cannot be in- cluded in routine laboratory tests. Activation of platelets causes morphologic changes, including both spherical transformation and pseudopodia formation (29). Progressively activated plate- lets with pseudopodia formation could have heterogeneous size, giving larger PDW. Therefore, PDW could be an important, simple, effortless, and cost effective tool that can be used more extensively for prediction of impending acute events. In the cur- rent study, PDW of patients with in-hospital death was signifi- cantly higher than that of those without in-hospital death.
The combination of WBC and Hb was studied with regard to the combined use of CBC markers for risk stratification (6, 7). In the ANIN Myocardial Infarction Registry, a U-shaped relation- ship of Hb levels and mortality was observed for patients with higher leukocytosis, whereas, in patients with lower WBC count, higher mortality was related solely to the lowest Hb quintile (6).
Another study from the Korean Acute Myocardial infarction Registry reported that patients with anemia and high neutro- phil/lymphocyte (N/L) had higher mortality at six months after STEMI, compared to patients with no anemia and low N/L (7).
However, to the best of our knowledge, a triple combination of CBC markers, all connected in some way with AMI prognosis, had never been used in risk assessment for AMI. In the current study, combined use of WBC, hemoglobin, and PDW, which are readily available CBC data in the early in-hospital period, showed good correlation with age, Killip class, NT-ProBNP, and LVEF which are well known as prognostic markers in patients with AMI. Furthermore, a triple combination of CBC markers was useful for prediction of in-hospital and 12-month mortality in patients with AMI.
There are several limitations to this study. First a single cut-off level for hemoglobin (12.7 g/dL) was used for prediction of in- hospital death. In general, differences in hemoglobin levels and definition of anemia were observed between male and female.
However, because best cut-off level of hemoglobin by ROC curve analysis did not differ between genders, we used a single cut-off value for hemoglobin. Second, information on the WBC differential count was not available. However, Gurm et al. re- ported that total WBC count was a better prognostic marker for long-term prognosis than the WBC components (30).
In conclusion, combination of WBC, Hb, and PDW, a cheap and simple hematologic marker, is useful in early risk stratifica- tion of patients with AMI.
DISCLOSURE
The authors have no conflicts of interest to disclose.
ORCID
Myung Hwan Bae http://orcid.org/0000-0001-7677-4895 Jang Hoon Lee http://orcid.org/0000-0002-7101-0236 Dong Heon Yang http://orcid.org/0000-0002-1646-6126 Hun Sik Park http://orcid.org/0000-0001-7138-1494 Yongkeun Cho http://orcid.org/0000-0001-9455-0190 Shung Chull Chae http://orcid.org/0000-0002-9871-4895 REFERENCES
1. Haaf P, Balmelli C, Reichlin T, Twerenbold R, Reiter M, Meissner J, Schaub N, Stelzig C, Freese M, Paniz P, et al. N-terminal pro B-type na- triuretic peptide in the early evaluation of suspected acute myocardial infarction. Am J Med 2011; 124: 731-9.
2. Lee DH, Jeong MH, Rhee JA, Choi JS, Lee KH, Lee MG, Sim DS, Park KH, Yoon NS, Yoon HJ, et al. Predictors of long-term survival in acute coronary syndrome patients with left ventricular dysfunction after per- cutaneous coronary intervention. Korean Circ J 2012; 42: 692-7.
3. Barron HV, Cannon CP, Murphy SA, Braunwald E, Gibson CM. Associa- tion between white blood cell count, epicardial blood flow, myocardial perfusion, and clinical outcomes in the setting of acute myocardial in- farction: a thrombolysis in myocardial infarction 10 substudy. Circula- tion 2000; 102: 2329-34.
4. Han YC, Yang TH, Kim DI, Jin HY, Chung SR, Seo JS, Jang JS, Kim DK, Kim DK, Kim KH, et al. Neutrophil to lymphocyte ratio predicts long- term clinical outcomes in patients with ST-segment elevation myocardial infarction undergoing primary percutaneous coronary intervention. Ko- rean Circ J 2013; 43: 93-9.
5. Palmerini T, Mehran R, Dangas G, Nikolsky E, Witzenbichler B, Gua- gliumi G, Dudek D, Genereux P, Caixeta A, Rabbani L, et al. Impact of leukocyte count on mortality and bleeding in patients with myocardial infarction undergoing primary percutaneous coronary interventions:
analysis from the Harmonizing Outcome with Revascularization and Stent in Acute Myocardial Infarction trial. Circulation 2011; 123: 2829- 37.
6. Kruk M, Przyłuski J, Kalińczuk L, Pregowski J, Kadziela J, Kaczmarska E, Petryka J, Kepka C, Klopotowski M, Chmielak Z, et al. Hemoglobin, leu- kocytosis and clinical outcomes of ST-elevation myocardial infarction treated with primary angioplasty: ANIN Myocardial Infarction Registry.
Circ J 2009; 73: 323-9.
7. Cho KH, Jeong MH, Ahmed K, Hachinohe D, Choi HS, Chang SY, Kim MC, Hwang SH, Park KH, Lee MG, et al. Value of early risk stratification using hemoglobin level and neutrophil-to-lymphocyte ratio in patients with ST-elevation myocardial infarction undergoing primary percuta- neous coronary intervention. Am J Cardiol 2011; 107: 849-56.
8. Dündar C, Oduncu V, Erkol A, Tanalp AC, Sırma D, Karagöz A, Karabay CY, Kılıçgedik A, Pala S, Tigen K, et al. In-hospital prognostic value of hemoglobin levels on admission in patients with acute ST segment ele-
vation myocardial infarction undergoing primary angioplasty. Clin Res Cardiol 2012; 101: 37-44.
9. Smit JJ, Ottervanger JP, Slingerland RJ, Kolkman JJ, Suryapranata H, Hoorntje JC, Dambrink JH, Gosselink AT, de Boer MJ, Zijlstra F, et al.
Comparison of usefulness of C-reactive protein versus white blood cell count to predict outcome after primary percutaneous coronary interven- tion for ST elevation myocardial infarction. Am J Cardiol 2008; 101: 446- 51.
10. Pellizzon GG, Dixon SR, Stone GW, Cox DA, Mattos L, Boura JA, Grines LL, Addala S, O’Neill WW, Grines CL. Relation of admission white blood cell count to long-term outcomes after primary coronary angio- plasty for acute myocardial infarction (the Stent PAMI Trial). Am J Car- diol 2003; 91: 729-31.
11. Vis MM, Engström AE, Sjauw KD, Tjong FV, Baan J Jr, Koch KT, DeVries JH, Tijssen JG, de Winter RJ, Piek JJ, et al. Plasma glucose and not hemo- globin or renal function predicts mortality in patients with STEMI com- plicated with cardiogenic shock. J Cardiovasc Med (Hagerstown). 2010;
11: 827-31.
12. Kramer MC, Rittersma SZ, de Winter RJ, Ladich ER, Fowler DR, Liang YH, Kutys R, Carter-Monroe N, Kolodgie FD, van der Wal AC, et al. Re- lationship of thrombus healing to underlying plaque morphology in sudden coronary death. J Am Coll Cardiol 2010; 55: 122-32.
13. Heestermans AA, van Werkum JW, Zwart B, van der Heyden JA, Kelder JC, Breet NJ, van’t Hof AW, Dambrink JH, Koolen JJ, Brueren BR, et al.
Acute and subacute stent thrombosis after primary percutaneous coro- nary intervention for ST-segment elevation myocardial infarction: inci- dence, predictors and clinical outcome. J Thromb Haemost 2010; 8:
2385-93.
14. Vagdatli E, Gounari E, Lazaridou E, Katsibourlia E, Tsikopoulou F, Labrianou I. Platelet distribution width: a simple, practical and specific marker of activation of coagulation. Hippokratia 2010; 14: 28-32.
15. Ihara A, Matsumoto K, Kawamoto T, Shouno S, Kawamoto J, Katayama A, Yoshitatsu M, Izutani H. Relationship between hemostatic markers and platelet indices in patients with aortic aneurysm. Pathophysiol Hae- most Thromb 2006; 35: 451-6.
16. Ihara A, Kawamoto T, Matsumoto K, Shouno S, Hirahara C, Morimoto T, Noma Y. Relationship between platelet indexes and coronary angio- graphic findings in patients with ischemic heart disease. Pathophysiol Haemost Thromb 2006; 35: 376-9.
17. Khandekar MM, Khurana AS, Deshmukh SD, Kakrani AL, Katdare AD, Inamdar AK. Platelet volume indices in patients with coronary artery disease and acute myocardial infarction: an Indian scenario. J Clin Pathol 2006; 59: 146-9.
18. Lee JH, Park HS, Chae SC, Cho Y, Yang DH, Jeong MH, Kim YJ, Kim KS, Hur SH, Seong IW, et al. Predictors of six-month major adverse cardiac
events in 30-day survivors after acute myocardial infarction (from the Korea Acute Myocardial Infarction Registry). Am J Cardiol 2009; 104:
182-9.
19. Myocardial infarction redefined: a consensus document of the Joint European Society of Cardiology/American College of Cardiology Com- mittee for the redefinition of myocardial infarction. Eur Heart J 2000;
21: 1502-13.
20. Sabatine MS, Morrow DA, de Lemos JA, Gibson CM, Murphy SA, Rifai N, McCabe C, Antman EM, Cannon CP, Braunwald E. Multimarker ap- proach to risk stratification in non-ST elevation acute coronary syn- dromes: simultaneous assessment of troponin I, C-reactive protein, and B-type natriuretic peptide. Circulation 2002; 105: 1760-3.
21. Thiagarajan RR, Winn RK, Harlan JM. The role of leukocyte and endo- thelial adhesion molecules in ischemia-reperfusion injury. Thromb Hae- most 1997; 78: 310-4.
22. Goel MS, Diamond SL. Neutrophil enhancement of fibrin deposition under flow through platelet-dependent and -independent mechanisms.
Arterioscler Thromb Vasc Biol 2001; 21: 2093-8.
23. Engler RL, Schmid-Schönbein GW, Pavelec RS. Leukocyte capillary plugging in myocardial ischemia and reperfusion in the dog. Am J Pathol 1983; 111: 98-111.
24. Mann DL, Young JB. Basic mechanisms in congestive heart failure. Rec- ognizing the role of proinflammatory cytokines. Chest 1994; 105: 897- 904.
25. Finkel MS, Oddis CV, Jacob TD, Watkins SC, Hattler BG, Simmons RL.
Negative inotropic effects of cytokines on the heart mediated by nitric ox- ide. Science 1992; 257: 387-9.
26. Levy PS, Kim SJ, Eckel PK, Chavez R, Ismail EF, Gould SA, Ramez Salem M, Crystal GJ. Limit to cardiac compensation during acute isovolemic hemodilution: influence of coronary stenosis. Am J Physiol 1993; 265:
H340-9.
27. Wahr JA. Myocardial ischaemia in anaemic patients. Br J Anaesth 1998;
81: 10-5.
28. Bae MH, Lee JH, Lee SH, Park SH, Yang DH, Park HS, Cho Y, Jun JE, Chae SC. Serum uric acid as an independent and incremental prognos- tic marker in addition to N-terminal pro-B-type natriuretic peptide in patients with acute myocardial infarction. Circ J 2011; 75: 1440-7.
29. Jagroop IA, Clatworthy I, Lewin J, Mikhailidis DP. Shape change in hu- man platelets: measurement with a channelyzer and visualisation by electron microscopy. Platelets 2000; 11: 28-32.
30. Gurm HS, Bhatt DL, Lincoff AM, Tcheng JE, Kereiakes DJ, Kleiman NS, Jia G, Topol EJ. Impact of preprocedural white blood cell count on long term mortality after percutaneous coronary intervention: insights from the EPIC, EPILOG, and EPISTENT trials. Heart 2003; 89: 1200-4.