INTRODUCTION
Asthma is a highly prevalent, chronic respiratory condition characterized by reversible airflow obstruction, airway hyper- responsiveness and airway inflammation producing frequent exacerbations. There are 300 million people worldwide affected by asthma.1 The public health burden of asthma has increased over the past 2 decades, and acute exacerbation of asthma is a particularly important and costly problem, because morbidity and mortality due to asthma are closely related to the frequen- cy and severity of the exacerbations.2 Identification of causal
factors is vital for prevention and management of exacerba- tions. In Western countries, viral infections are responsible for up to 80%-85% of exacerbations in childhood asthma.3-6 In con- trast, viral infections are involved in <50% of asthma exacerba-
Prevalence of Respiratory Viral Infections in Korean Adult
Asthmatics With Acute Exacerbations: Comparison With Those With Stable State
Ki-Hyun Seo,
1Da-Jeong Bae,
2Ji-Na Kim,
3Ho-Sung Lee,
1Yong-Hoon Kim,
1Jong-Sook Park,
4Myung-Shin Kim,
5Hun-Soo Chang,
2Ji-Hye Son,
2Dong-Gyu Baek,
2Jun-Suk Lee,
6Choon-Sik Park
4*
1Division of Allergy and Respiratory Disease, Soonchunhyang University Cheonan Hospital, Cheonan, Korea
2Department of Interdisciplinary Program in Biomedical Science Major Graduate School of Soonchunhyang University, Asan, Korea
3Genome Research Center and Division of Allergy and Respiratory Disease, Soonchunhyang University Bucheon Hospital, Bucheon, Korea
4Division of Allergy and Respiratory Disease, Department of Internal Medicine, Soonchunhyang University Bucheon Hospital, Bucheon, Korea
5Division of Allergy and Respiratory Disease, Soonchunhyang University Gumi Hospital, Gumi, Korea
6College of Korean Medicine, Sangji University, Wonju, Korea
This is an Open Access article distributed under the terms of the Creative Commons Attribution Non-Commercial License (http://creativecommons.org/licenses/by-nc/4.0/) which permits unrestricted non-commercial use, distribution, and reproduction in any medium, provided the original work is properly cited.
Purpose: Viral infections are involved in ~50% of exacerbations among Caucasian adult asthmatics. However, there have been few reports on the causative virus of exacerbations in Korean adult asthmatics. Thus, we compared frequencies and types of viruses between lower respiratory tract illnesses (LRTIs) with exacerbations (exacerbated LRTIs) and those without exacerbations (stable LRTIs) to evaluate contribution of respiratory virus- es to exacerbations. Methods: Viral RNA was extracted from sputum using the Viral Gene-spin™ Kit. Reverse transcription-polymerase chain reac- tion (RT-PCR) was performed to detect adenovirus (ADV), metapneumovirus (MPV), parainfluenza virus (PIV) 1/2/3, influenza virus (IFV) A, IFV B, re- spiratory syncytial virus (RSV) A/B, and rhinovirus (RV) A. Results: Among the 259 patients, 210 underwent a single sputum examination, and the remaining 49 underwent 2 to 4 sputum examinations. Virus was detected in 68 of the 259 exacerbated episodes and in 11 of the 64 stable episodes.
Among the exacerbated episodes, RV was the most frequently detected virus, followed by influenza A, parainfluenza, RSV A/B, and ADV. Among the 11 stable episodes, RV was most frequently detected. Detection rates of these viruses did not differ between the 2 groups (P>0.05). Thirty-five patients underwent the virus examination at 2 episodes of exacerbation, while 14 patients underwent at each time of exacerbated and stable epi- sodes. Virus detection rate at the second examination was significantly higher in cases with 2 exacerbation episodes than in those with initial exac- erbation and sequential stable episodes (P=0.003). A seasonal pattern was noted in the detection rates of RV (September to December), IFV (Janu- ary to April), PIV (May to September), and RSV A/B (September to April). Conclusions: Respiratory viruses were identified in approximately 20% of LRTI irrespective of the presence of asthma exacerbation. RV and IFV A/B were most frequently detected. A group of patients experienced frequent viral infections followed by asthma exacerbations.
Key Words: Asthma; virus; exacerbation; season; sputum
Correspondence to: Choon-Sik Park, MD, Division of Allergy and Respiratory Medicine, Department of Internal Medicine, Soonchunhyang University Bucheon Hospital, 170 Jomaru-ro, Wonmi-gu, Bucheon 14584, Korea.
Tel: +82-32-621-5105; Fax: +82-32-621-2023; E-mail: [email protected] Received: February 5, 2017; Revised: May 22, 2017; Accepted: May 23, 2017
•Ki-Hyun Seo and Da-Jeong Bae contributed equally to this paper.
•There are no financial or other issues that might lead to conflict of interest.
Allergy Asthma Immunol Res. 2017 November;9(6):491-498.
https://doi.org/10.4168/aair.2017.9.6.491 pISSN 2092-7355 • eISSN 2092-7363
tions among adult asthmatics.7-12
Among various respiratory tract viruses, including rhinovirus (RV), influenza virus (IFV), adenovirus (ADV), human meta- pneumovirus (hMPV), parainfluenza virus (PIV), coronavirus, and respiratory syncytial virus (RSV),13 RV, and IFV trigger exac- erbations in children with asthma most frequently.14 In Korea, the prevalence of respiratory viruses is reported to be similar to that in Western countries. Of the respiratory viruses that cause asthma exacerbations, up to 60%-70% are RV, while IFV and RSV are responsible for a substantial proportion of exacerba- tions in children with asthma.15,16 However, there have been few reports on the prevalence of viruses related to asthma exacer- bations in Korean adult asthmatics.
This prompted us to evaluate the prevalence of respiratory vi- ruses in the sputum of asthmatics with lower respiratory tract illnesses (LRTIs) and to compare the frequencies and types of viruses detected in patients with exacerbations (exacerbated LRTIs) with those in subjects without exacerbations (stable LR- TIs) to evaluate the contribution of respiratory viruses to asth- ma exacerbation.
MATERIALS AND METHODS Study subjects
The study was prospectively carried out in a tertiary hospital in Korea from June 2009 to June 2014. Asthma was previously diagnosed based on the Global Initiative for Asthma guidelines (GINA report: global strategy for asthma management and pre- vention 2011 May 4. Available at: http://www.ginasthma.org/
uploads/users/files/GINA_Report2011_May4.pdf). All subjects had a clinical diagnosis of asthma supported by at least one of the following criteria: 1) an increase in the forced expiratory volume in 1 second (FEV1) of >12% or 200 mL after inhalation of 400 µg albuterol, 2) a reduction in the FEV1 of 20% in re- sponse to a provocative concentration of <10 mg/mL inhaled methacholine (PC20), and 3) an increase in the FEV1 >20%
over 14 days after inhaled or systemic corticosteroid use. The subjects underwent a standardized assessment, which includ- ed analyses of induced sputum specimens, complete blood cell count with differential counts, total immunoglobulin E (IgE) measurement, chest radiography, body mass index (BMI) mea- surement, and allergy skin-prick tests at the initial visit. Twenty- four common inhalant allergens, including dust mites (Derma- tophagoides farina and Dermatophagoides pteronyssinus), cat fur, dog fur, cockroaches, grass pollens, tree pollens, ragweed pollens, and Aspergillus species (Bencard Co., Brentford, UK) were used in the skin-prick tests. This study was prospectively performed by including the patients of the Soonchunhyang asthma cohort (n=1,843), and their characteristics were sum- marized in our previous publication.17 Among them, we re- cruited those who complained the aggravation of the lower re- spiratory symptoms and were able to expectorate good quality
sputum samples. Exclusion criteria were the presence of paren- chymal lung diseases, such as pulmonary tuberculosis, bron- chiectasis, lung cancer, idiopathic interstitial lung diseases, and abnormal lung infiltrations on chest radiography.
Sputum was obtained within 2 weeks from the time when re- spiratory tract infections were suspected if the common symp- toms of upper respiratory tract illnesses (URTIs), such as cough, sore throat, runny nose, post-nasal drip, nasal congestion, and low-grade fever, or those of LRTIs, such as shortness of breath, weakness, fever, coughing, sputum production, and wheezing were present. An exacerbation was diagnosed when pre-exist- ing dyspnea and wheezing became aggravated within 14 days before the study, together with a post-bronchodilator FEV1
<80% of the personal best.18 We divided them into exacerbated LRTI and stable LRTI. Informed written consent was obtained from all subjects and all procedures were approved by the Eth- ics Committee of Soonchunhyang University Bucheon Hospi- tal (SCH-2017-01-009).
Sputum preparation
Sputum was induced using isotonic saline containing a short- acting bronchodilator, and the samples were processed within 2 hours of collection, as previously described.19 Briefly, all por- tions with visibly greater solidity were carefully selected and placed in pre-weighed Eppendorf tubes. The samples were di- luted by adding 8 volumes of Dulbecco’s phosphate-buffered saline. The total cell count was determined using a hemocy- tometer. Supernatants and cell fractions were separated by cen- trifugation (500×g for 5 minutes). Five hundred cells were dif- ferentially counted on slides produced by cytocentrifugation af- ter staining with Diff-Quick (American Scientific Products, Mc- Graw Park, IL, USA). Sputum samples that contained >10%
squamous epithelial cells were not included.
Viral RNA extraction and multiplex reverse transcription- polymerase chain reaction (RT-PCR)
Viral RNA was extracted from 300 µL of the total sputum sam- ples diluted in 8×Dulbecco’s phosphate-buffered saline (DPBS) using the Viral Gene-spinTM Kit (iNtRON Biotechnolo- gy, Seoul, Korea) as recommended by the manufacturer. The isolated RNA was reverse-transcribed into cDNA following the protocol of the RevertAid First Strand cDNA Synthesis Kit (Thermo-Scientific, Waltham, MA, USA): 8 µL of purified RNA, 1 µL of 0.2 µg/µL random hexamer primer and 3 µL of diethyl- pyrocarbonate (DEPC)-treated water were mixed and heated at 80°C for 3 minutes. To this mixture, 4 µL of 5×reaction buffer, 1 µL RiboLock RNase inhibitor (20 U/µL), 10 mM dNTP mix and 1 µL of RevertAid M-MuLVRT (200 U/µL) were added, followed by incubation at 37°C for 90 minutes and 94°C for 2 minutes.
Respiratory viruses were identified using the Seeplex® RV 7 De- tection Kit (Seegene, Seoul, Korea) according to the manufac- turer’s protocol, as follows: 3 µL of cDNA, 5×RV2 primer, 8-me-
thoxypsoralen solution and 2×multiplex Master Mix were mixed and heated at 94°C for 15 minutes. Forty amplification cycles were carried out in a thermal cycler (94°C for 0.5 min- utes, 60°C for 1.5 minutes, and 72°C for 1.5 minutes). Amplifica- tion was completed by a final extension step at 72°C for 10 min- utes. RT-PCR products were visualized by electrophoresis on an ethidium bromide-stained 2% agarose gel to identify ADV, hMPV, PIV 1/2/3, IFV A, IFV B, RSV A/B, and RV A.
Statistical analysis
The statistical analyses were performed using SPSS 13.0 (IBM, Armonk, NY, USA). Comparisons of clinical and physiological parameters between the exacerbation and stable groups were conducted using Pearson’s χ2 test and an independent t test for discrete and continuous variables, respectively. Fisher’s exact test was applied for comparisons of the detection frequencies between the exacerbation and stable groups. Data are ex- pressed as means±standard error (SE) of the mean. Values of P<0.05 were deemed to indicate statistical significance.
RESULTS
Clinical characteristics of the subjects
We obtained 353 sputum samples from 283 asthmatics with
URTI or LRTI symptoms, including an increased amount of sputum without asthma exacerbation (stable state) or with asthma exacerbation (exacerbated state). Among them, 30 spu- tum samples were discarded because of inadequate quality.
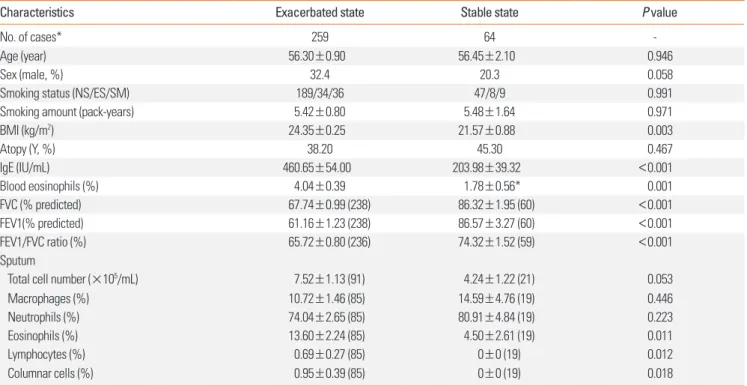
This, PCR detection of respiratory viruses was performed in 323 samples from 259 asthmatics (259 samples from subjects in an exacerbated state and 64 from those in a stable state). The clini- cal profiles of subjects in both states are presented in Table 1.
The exacerbated cases had significantly lower FEV1, forced vi- tal capacity (FVC), and FEV1/FVC values compared with those in a stable state (P<0.001). The total IgE level and eosinophil percentage in the peripheral blood and sputum were signifi- cantly higher in the exacerbated cases than in the stable cases (P=0.010-0.001).
Respiratory viruses detected
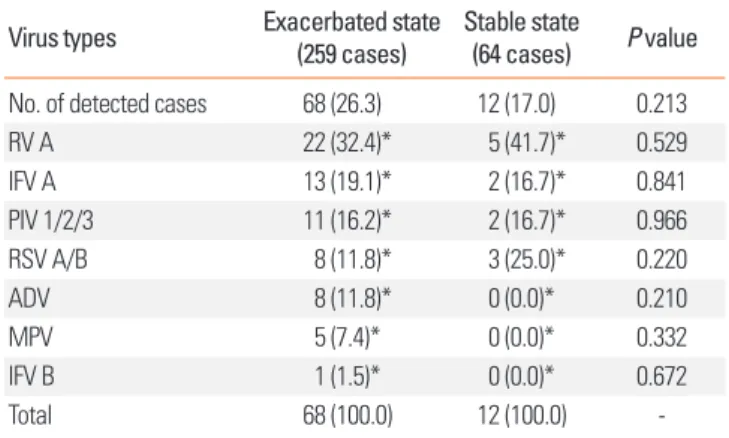
Respiratory viruses were detected in 68 (26.3%) of the 259 ex- acerbated-state sputum samples and in 12 of the 64 stable-state samples (17.0%; P=0.213; Fig. 1A). RV was the most frequently detected virus in both the exacerbated and stable cases (32.4%
vs 41.7%; P=0.529; Table 2). In the exacerbated cases, IFV A/B was the second most frequently detected virus (20.6%), fol- lowed by PIV 1/2/3 (16.2%), RSV A/B (11.8%), ADV (11.8%), and hMPV (11.8%). In the stable cases, RSV A/B (25.0%) was
Table 1. Demographic characteristics and laboratory findings of the subjects
Characteristics Exacerbated state Stable state P value
No. of cases* 259 64 -
Age (year) 56.30±0.90 56.45±2.10 0.946
Sex (male, %) 32.4 20.3 0.058
Smoking status (NS/ES/SM) 189/34/36 47/8/9 0.991
Smoking amount (pack-years) 5.42±0.80 5.48±1.64 0.971
BMI (kg/m2) 24.35±0.25 21.57±0.88 0.003
Atopy (Y, %) 38.20 45.30 0.467
IgE (IU/mL) 460.65±54.00 203.98±39.32 <0.001
Blood eosinophils (%) 4.04±0.39 1.78±0.56* 0.001
FVC (% predicted) 67.74±0.99 (238) 86.32±1.95 (60) <0.001
FEV1(% predicted) 61.16±1.23 (238) 86.57±3.27 (60) <0.001
FEV1/FVC ratio (%) 65.72±0.80 (236) 74.32±1.52 (59) <0.001
Sputum
Total cell number (×105/mL) 7.52±1.13 (91) 4.24±1.22 (21) 0.053
Macrophages (%) 10.72±1.46 (85) 14.59±4.76 (19) 0.446
Neutrophils (%) 74.04±2.65 (85) 80.91±4.84 (19) 0.223
Eosinophils (%) 13.60±2.24 (85) 4.50±2.61 (19) 0.011
Lymphocytes (%) 0.69±0.27 (85) 0±0 (19) 0.012
Columnar cells (%) 0.95±0.39 (85) 0±0 (19) 0.018
Data are presented as means±SE; numbers in parentheses are the numbers of cases; P values were calculated by Pearson's χ2 test and independent t test for dis- crete and continuous variables, respectively.
NS, non-smoker; ES, ex-smoker; SM, smoker; BMI, body mass index; Y, yes; IgE, immunoglobulin E; FVC, forced vital capacity; FEV1, forced expiratory volume in 1 second; SE, standard error.
*A total of 259 patients were enrolled: 210 underwent a single sputum examination and 49 underwent 2 to 4 sputum examinations, for a total of 323 examinations.
Number of cases is the number of cases of exacerbated and stable asthma in subjects with lower respiratory tract infections.
the second most frequently detected, followed by PIV 1/2/3 (16.7%) and IFV A/B (16.7%) (Table 2 and Fig. 1B). There was no difference in the virus distribution between the exacerbated and stable groups (P=0.664; Fig. 1B).
Virus detection during follow-up
Of the subjects, 210 (44 stable and 166 exacerbated cases) un- derwent one sputum examination, and the remaining 49 un- derwent 2 to 4 sputum examinations. Seventy samples were obtained from 35 subjects during 2 exacerbations (exacerbat- ed/exacerbated). A further 28 samples were obtained from 14 subjects with exacerbations and a stable LRTI state (exacerbat-
ed/stable) (Table 3). Virus was detected at both examinations in 3 of the exacerbated/exacerbated cases (+/+, 8.6%), at one examination in 6 cases (+/−, 17.1%) and 8 cases (−/+, 22.9%), and at neither examination in 18 cases (−/−, 51.4%). Among the exacerbated/stable cases, virus was detected at one examina- tion in 11 cases (78.6%): 10 cases at the first examination (+/−, 71.4%) and 1 case at the second examination (−/+, 7.1%); it was not detected in 3 cases (−/−, 21.4%). There was a significant dif- ference in the virus-positive and -negative rates between the 2 groups (P=2.00×10⁻⁴). Interestingly, among the 14 exacerbat- ed/stable cases, 10 (71.4%) had virus-positive initial sputum samples (exacerbated state) but virus-negative second sputum samples (stable state). Accordingly, the exacerbated/stable group had a significantly higher frequency of an initial positive sample and a follow-up negative sample than did the exacer- bated/exacerbated group (17.1%; P=0.003; Table 3).
Fig. 1. Virus detection rates (A) and frequencies (B) in cases with lower respiratory infections with exacerbated (n=259) and those with stable state (n=69). P val- ues calculated by Pearson’s χ2 test (A) and Fisher’s exact test (B). P values for the rate of virus detection in the exacerbated and stable states were 0.213 (A) and 0.664 (B), respectively.
Virus detection state (%) Virus species (%)
Exacerbation
73.7 81.3
26.3 18.8
Asthma state P=0.213
Exacerbation Asthma state
P=0.664
Non-exacerbation Non-exacerbation
100
80
60
40
20
0
100
80
60
40
20
0 Negative
Positive Rhinovirus A
Influenza A
Parainfluenza virus 1/2/3 RSV A/B
Adenovirus Metapneumovirus Influenza B
A B
32.4 41.7
16.7
16.7
25.0 19.1
16.2 11.8 11.8
7.4 1.5
Table 2. Frequencies of virus detection Virus types Exacerbated state
(259 cases) Stable state
(64 cases) P value No. of detected cases 68 (26.3) 12 (17.0) 0.213
RV A 22 (32.4)* 5 (41.7)* 0.529
IFV A 13 (19.1)* 2 (16.7)* 0.841
PIV 1/2/3 11 (16.2)* 2 (16.7)* 0.966
RSV A/B 8 (11.8)* 3 (25.0)* 0.220
ADV 8 (11.8)* 0 (0.0)* 0.210
MPV 5 (7.4)* 0 (0.0)* 0.332
IFV B 1 (1.5)* 0 (0.0)* 0.672
Total 68 (100.0) 12 (100.0) -
Numbers of detected cases are the numbers of virus detections among the to- tal number of cases in each group. Values in parentheses are the proportions of virus-positive cases.
RV, rhinovirus; IFV, influenza virus; PIV, parainfluenza virus; RSV, respiratory syn- cytial virus; ADV, adenovirus; MPV, metapneumovirus.
*P values for comparisons of virus detection frequencies were calculated by Fisher's exact test.
Table 3. Virus detection rates in the exacerbated/exacerbated and exacerbat- ed/stable cases with 2 or more examinations
Virus status (initial/follow-up)
Asthma state
P value*
Exacerbated/
exacerbated Exacerbated/
stable
+/+ 3 (8.6) 0 (0.0) 0.003
+/− 6 (17.1) 10 (71.4)†
−/+ 8 (22.9) 1 (7.1)
−/− 18 (51.4) 3 (21.4)
Total 35 (100.0) 14 (100.0)
Values are presented as number (%).
*P values calculated by Fisher's exact test; †P=2.00×10⁻⁴ by Fisher’s exact test for post hoc comparison of the +/− frequencies of exacerbated/exacerbated and exacerbated/stable cases among 49 subjects.
Seasonal variation in virus detection
A seasonal pattern was noted in the rates of detection of respi- ratory virus. RV was prevalent in September to December, IFV in January to April, PIV in May to September, and RSV A/B in September to April (Fig. 2).
DISCUSSION
In the present study, of the viruses evaluated, RV was most frequently related to exacerbations of asthma in Korean adult asthmatics. RV was responsible for one-third (32.4%) of the vi- ral infections in exacerbated cases. This frequency is in good agreement with previous reports on Caucasians. RV URTI and LRTI were frequently associated with asthma exacerbations in child and adult Caucasian asthmatics.14 Nicholson et al.8 re- ported that 33% of 229 acute exacerbation cases were RV-posi- tive by RT-PCR. A longitudinal study of adult patients reported an RV detection rate of 20% in 30 asthmatics.7 In a study of 42 adult asthmatics hospitalized due to respiratory viral infection, RV was detected in 30% of the subjects by RT-PCR.10 Thus, RV constitutes ~30% of the respiratory viruses related to asthma ex-
acerbations in both Korean and Caucasian adult asthmatics.
The prevalence of respiratory viruses differs markedly accord- ing to age and geography.13 The frequency of RV detection is significantly lower in adult asthmatics than in child asthmatics.
Indeed, viruses were detected in ~80% of child asthmatics with acute exacerbations; RV caused 70%-90% of these episodes.6
Interestingly, the frequency of RV detection was higher in non-exacerbated stable LRTI cases than in exacerbated LRTI cases in our study (45.5% vs 32.4%), although the difference was not significant. Thus, because RV was detected in almost half of the stable LRTI cases, the relationship between RV infection and asthma exacerbations seems to be inconsistent: detection of RV in sputum does not always induce an asthma exacerba- tion. Other studies of adult asthmatics have reported similar re- sults. In an 11 month longitudinal study of 31 atopic asthmatics aged 15-56 years, 30 viruses were detected, 18 (60%) of which were associated with asthma exacerbations.7 In these popula- tions, RV was detected in 14/30 (46.6%) asthmatics and 3/9 (33.3%) non-asthmatics. A longitudinal study of adult asthmat- ics reported that one-third of symptomatic respiratory tract vi- ral infections were not associated with worsening of asthma Fig. 2. Seasonal variation of respiratory virus in study cases. RV was prevalent in the fall, and IFV A was detected predominantly in January, February, and March.
PIV was detected predominantly from May to September and RSV from September to April. RV, rhinovirus; IFV, influenza virus; PIV, parainfluenza virus; RSV, respira- tory syncytial virus.
Prevalence (%)Prevalence (%)Prevalence (%) Prevalence (%)Prevalence (%)Prevalence (%)
Jan Feb Mar Apr May Jun Jul Aug Sep Oct Nov Dec
Jan Feb Mar Apr May Jun Jul Aug Sep Oct Nov Dec
Jan Feb Mar Apr May Jun Jul Aug Sep Oct Nov Dec
Jan Feb Mar Apr May Jun Jul Aug Sep Oct Nov Dec
Jan Feb Mar Apr May Jun Jul Aug Sep Oct Nov Dec
Jan Feb Mar Apr May Jun Jul Aug Sep Oct Nov Dec Rhinovirus A virus (n=27)
Influenza A/B virus (n=16)
Parainfluenza virus 1/2/3 (n=13)
RSV A/B (n=12)
Adenovirus (n=8)
Metapneumovirus (n=5) 30
20
10
0
40 30 20 10 0
25 20 15 10 5 0
30
20
10
0
40 30 20 10 0
70 60 50 40 30 20 10 0
symptoms.10 In a recent longitudinal cohort study of couples (1 with asthma and 1 without) that evaluated the presence of RV in nasal secretions at 2-week intervals over a 3-month period, the incidence of RV infection was similar in those with asthma and those without (10.1% vs 8.5%).9 In a study of children, the rate of RV isolation was almost identical in those with wheezy bronchitis (28.6%) and those with upper respiratory illness (29.5%).20 These studies and our data suggest that RV is related to both acute exacerbations of asthma and stable LRTI without asthma exacerbations.
Although the prevalence of virus infections is similar in asth- matic children with vs without exacerbations, respiratory symp- toms are more severe in the presence of viral infections, in that cold and asthma symptoms are more than 2-fold longer in du- ration and loss of control is more frequent in virus-positive compared with virus-negative respiratory tract illness in chil- dren (47% vs 22%).5 Adults with asthma are not at increased risk of RV infection, but those infected with RV have more severe and longer-lasting LRTI symptoms and greater decreases in peak expiratory flow rate than do healthy individuals.9
In the present study, IFV A was the second most frequently detected virus. Thus, RV and IFV constituted 51.5% of the viral infections in subjects with exacerbated asthma. A similar fre- quency has been reported in adult asthmatics.21 However, RV and IFV infections are more prevalent among subjects with asthma exacerbations compared with those without exacerba- tions in Korean children.22
In the present study, respiratory viruses were detected in the sputum of subjects with exacerbated (26.3%) and stable (17.2%) asthma. This detection rate is lower than that initially expected.
In a 1979 study of children, the detection rate was 26.4%.20 In that study, virus isolation was performed by cell culture.20 In contrast, respiratory viruses can now be identified by virus cul- ture, serology, immunofluorescence antigen detection, and PCR-based tests.13 Since the development of PCR assays in the 1990s, their sensitivity has improved markedly. Thus, our de- tection rate is relatively low, likely due to inadequate sputum samples. Virus detection is usually performed in the upper air- way because collection of sputum from young children and some adult asthmatics is not feasible. In our study, viruses were detected in sputum samples, not in nasopharyngeal washings or swabs. Use of this method may have resulted in the low fre- quency of RV detection in our study, because RV usually infects the upper respiratory tract.9 However, in our comparison study of sputum and nasal swabs in asthmatics with LRTIs,23 the con- cordance rate of virus detection was 95.2%, and the detection rate was higher in sputum than in nasal swabs. Thus, use of sputum did not seem to be a cause of the low frequency of RV detection in our study. The second reason is the delayed sam- pling of sputum in our study. An exacerbation was defined as aggravation of pre-existing symptoms of dyspnea and wheez- ing within 14 days before the study and a post-bronchodilator
FEV1 <80% of the predicted value or the personal best.18 RV has an incubation period of 2 days and is shed for 7 days after development of symptoms.24,25 FEV1 decreases significantly af- ter infection, reaching a minimum at 2 days after experimental RV inoculation.26 Because our study was a cross-sectional de- sign, we did not analyze the lag time between the appearance of LRTI symptoms and sputum virus analysis. Therefore, a lag time of >7 days in some patients may have resulted in the low detection rate.
A subset of asthmatics is particularly susceptible to recurrent exacerbations.2 In our study, the initial sputum samples (exac- erbation) were positive for virus, while the second sputum sam- ples (stable state) were negative in 10 of 14 cases (71.4%). This frequency was higher than that in the exacerbated/exacerbated group (17.1%; P=2.50×10⁻⁴). These data indicate that a subset of patients is susceptible to asthma exacerbation in the pres- ence of viral LRTI. In addition to viruses, asthma exacerbation can be caused by other agents, including allergens (dust mites, pollen, and animal dander),27 occupational exposure (grains, flours, cleaning agents, metals, irritants, and woods), hormones (menstrual asthma), drugs (acetylsalicylic acid [ASA], nonste- roidal anti-inflammatory drugs [NSAIDs], and beta-blockers), exercise, stress, smoking exposure,28 and air pollutants.29,30 The factors that trigger exacerbations differ among individuals.
Thus, exacerbation of asthma may be a result of the complex interplay among respiratory viruses, host airway susceptibility factors, and environmental modifiers. A case-control study of 60 adult patients compared those hospitalized with acute asth- ma with 2 control groups: patients with stable asthma and pa- tients hospitalized for non-asthma conditions.2 Compared with the controls, a significantly higher proportion of acute asthmat- ics were both sensitized and exposed to allergens, including dust mites, cat, and dog allergens. Intriguingly, the combina- tion of high exposure to 1 or more allergens and virus detection significantly increased the risk of hospitalization for asthma compared with controls with stable asthma.27 These results in- dicate synergism among allergen sensitization, exposure to a high level of a sensitizing allergen, and viral infection in induc- ing asthma deterioration.31,32 In our study, the frequency of vi- rus detection was not different between atopics and non-atop- ics (data not shown). Although all of these factors are expected to predispose asthmatics to viral infections,33 determining whether the exacerbation is due to viral infection or other causes is not feasible at present.
The predominant respiratory virus depends on the season.34 In our study, the number of cases was highest in late fall and early winter. However, the virus detection rate was ~45% in Feb- ruary and March and <20% in May, July, and August. These data indicate that symptoms of LRTI with asthma exacerbation in early spring may be due mainly to viral infections, and that those in late spring to summer may be due mainly to other en- vironmental factors. In addition, virus prevalence varied mark-
edly: RV was predominant during fall and early winter, while IFV A was predominant during winter. IFV A is the predomi- nant respiratory virus in winter in Korea.35 RSV was predomi- nant during fall, winter and early spring, and PIV was predomi- nant during late spring and early fall. The seasonal variation re- ported in the present study is in agreement with that previously reported.34
In summary, the presence of respiratory viruses was analyzed in 323 sputum samples from asthmatics with manifestations of LRTI to evaluate their contribution to asthma exacerbations.
Virus was detected in approximately one-fifth of the subjects with exacerbated and stable disease. In both states, RV was the most frequently detected virus, followed by IFV A, which is comparable with those of Caucasian studies. Forty-nine pa- tients underwent an examination for viruses during 2 episodes of exacerbation and at the time of each exacerbated and stable episode. The virus detection rate at the second examination was significantly higher in cases with 2 exacerbation episodes than in those with sequential exacerbation and stable episodes, suggesting a presence of susceptible asthmatics to exacerbation in case of LTRI. Seasonal variations in detection rates and types of virus show the similar patterns to those of Caucasian asth- matics.
ACKNOWLEDGMENTS
The sputum samples for this study were provided by the Soonchunhyang University Hospital Biobank, a member of the National Biobank of Korea, which is supported by the Ministry of Health, Welfare, and Family Affairs, Korea.
This work was supported by a Research Program funded by the Korea Centers for Disease Control and Prevention (fund code 2015-ER7402-00) and by a Soonchunhyang University Re- search Fund grant to CS Park.
REFERENCES
1. Masoli M, Fabian D, Holt S, Beasley R; Global Initiative for Asthma (GINA) Program. The global burden of asthma: executive summa- ry of the GINA Dissemination Committee report. Allergy 2004;59:
469-78.
2. Dougherty RH, Fahy JV. Acute exacerbations of asthma: epidemi- ology, biology and the exacerbation-prone phenotype. Clin Exp Al- lergy 2009;39:193-202.
3. Murray CS, Simpson A, Custovic A. Allergens, viruses, and asthma exacerbations. Proc Am Thorac Soc 2004;1:99-104.
4. Tan WC. Viruses in asthma exacerbations. Curr Opin Pulm Med 2005;11:21-6.
5. Olenec JP, Kim WK, Lee WM, Vang F, Pappas TE, Salazar LE, et al.
Weekly monitoring of children with asthma for infections and ill- ness during common cold seasons. J Allergy Clin Immunol 2010;
125:1001-1006.e1.
6. Johnston SL, Pattemore PK, Sanderson G, Smith S, Lampe F, Jo- sephs L, et al. Community study of role of viral infections in exacer-
bations of asthma in 9–11 year old children. BMJ 1995;310:1225-9.
7. Beasley R, Coleman ED, Hermon Y, Holst PE, O’Donnell TV, Tobi- as M. Viral respiratory tract infection and exacerbations of asthma in adult patients. Thorax 1988;43:679-83.
8. Nicholson KG, Kent J, Ireland DC. Respiratory viruses and exacer- bations of asthma in adults. BMJ 1993;307:982-6.
9. Corne JM, Marshall C, Smith S, Schreiber J, Sanderson G, Holgate ST, et al. Frequency, severity, and duration of rhinovirus infections in asthmatic and non-asthmatic individuals: a longitudinal cohort study. Lancet 2002;359:831-4.
10. Atmar RL, Guy E, Guntupalli KK, Zimmerman JL, Bandi VD, Bax- ter BD, et al. Respiratory tract viral infections in inner-city asthmat- ic adults. Arch Intern Med 1998;158:2453-9.
11. Sokhandan M, McFadden ER Jr, Huang YT, Mazanec MB. The con- tribution of respiratory viruses to severe exacerbations of asthma in adults. Chest 1995;107:1570-4.
12. Teichtahl H, Buckmaster N, Pertnikovs E. The incidence of respira- tory tract infection in adults requiring hospitalization for asthma.
Chest 1997;112:591-6.
13. Tregoning JS, Schwarze J. Respiratory viral infections in infants:
causes, clinical symptoms, virology, and immunology. Clin Micro- biol Rev 2010;23:74-98.
14. Friedlander SL, Busse WW. The role of rhinovirus in asthma exac- erbations. J Allergy Clin Immunol 2005;116:267-73.
15. Choi EH, Lee HJ, Kim SJ, Eun BW, Kim NH, Lee JA, et al. The asso- ciation of newly identified respiratory viruses with lower respirato- ry tract infections in Korean children, 2000–2005. Clin Infect Dis 2006;43:585-92.
16. Kim WK, Gern JE. Updates in the relationship between human rhi- novirus and asthma. Allergy Asthma Immunol Res 2012;4:116-21.
17. Kim TB, Jang AS, Kwon HS, Park JS, Chang YS, Cho SH, et al. Identi- fication of asthma clusters in two independent Korean adult asth- ma cohorts. Eur Respir J 2013;41:1308-14.
18. Park SW, Kim DJ, Chang HS, Park SJ, Lee YM, Park JS, et al. Associa- tion of interleukin-5 and eotaxin with acute exacerbation of asth- ma. Int Arch Allergy Immunol 2003;131:283-90.
19. Park SW, Lee YM, Jang AS, Lee JH, Hwangbo Y, Kim DJ, et al. Devel- opment of chronic airway obstruction in patients with eosinophilic bronchitis: a prospective follow-up study. Chest 2004;125:1998- 2004.
20. Horn ME, Brain EA, Gregg I, Inglis JM, Yealland SJ, Taylor P. Respi- ratory viral infection and wheezy bronchitis in childhood. Thorax 1979;34:23-8.
21. Minor TE, Dick EC, Baker JW, Ouellette JJ, Cohen M, Reed CE. Rhi- novirus and influenza type A infections as precipitants of asthma.
Am Rev Respir Dis 1976;113:149-53.
22. Kwon JM, Shim JW, Kim DS, Jung HL, Park MS, Shim JY. Preva- lence of respiratory viral infection in children hospitalized for acute lower respiratory tract diseases, and association of rhinovirus and influenza virus with asthma exacerbations. Korean J Pediatr 2014;
57:29-34.
23. Park JS, Kim JN, Kim MS, Seo KH, Uh ST, Kim YH, et al. Compari- son of virus detected in sputum and nasal washing fluids from ex- acerbated asthmatics. Proceedings of the 2016 KAAACI Annual Spring Congress; 2016 May 6–7; Seoul. Seoul: Korean Academy of Asthma, Allergy and Clinical Immunology; 2016. 185 p.
24. Douglas RG Jr, Cate TR, Gerone PJ, Couch RB. Quantitative rhino- virus shedding patterns in volunteers. Am Rev Respir Dis 1966;94:
159-67.
25. Harris JM 2nd, Gwaltney JM Jr. Incubation periods of experimental rhinovirus infection and illness. Clin Infect Dis 1996;23:1287-90.
26. Grünberg K, Timmers MC, de Klerk EP, Dick EC, Sterk PJ. Experi- mental rhinovirus 16 infection causes variable airway obstruction in subjects with atopic asthma. Am J Respir Crit Care Med 1999;
160:1375-80.
27. Green RM, Custovic A, Sanderson G, Hunter J, Johnston SL, Wood- cock A. Synergism between allergens and viruses and risk of hospi- tal admission with asthma: case-control study. BMJ 2002;324:763.
28. Weiss ST, Utell MJ, Samet JM. Environmental tobacco smoke expo- sure and asthma in adults. Environ Health Perspect 1999;107 Sup- pl 6:891-5.
29. Sunyer J, Spix C, Quénel P, Ponce-de-León A, Pönka A, Baruman- dzadeh T, et al. Urban air pollution and emergency admissions for asthma in four European cities: the APHEA Project. Thorax 1997;
52:760-5.
30. Goldsmith CA, Kobzik L. Particulate air pollution and asthma: a review of epidemiological and biological studies. Rev Environ
Health 1999;14:121-34.
31. Lim JS, Woo SI, Kwon HI, Baek YH, Choi YK, Hahn YS. Clinical characteristics of acute lower respiratory tract infections due to 13 respiratory viruses detected by multiplex PCR in children. Korean J Pediatr 2010;53:373-9.
32. Griswold SK, Nordstrom CR, Clark S, Gaeta TJ, Price ML, Camargo CA Jr. Asthma exacerbations in North American adults: who are the “frequent fliers” in the emergency department? Chest 2005;127:
1579-86.
33. Rodrigo GJ, Rodrigo C, Hall JB. Acute asthma in adults: a review.
Chest 2004;125:1081-102.
34. Seo YB, Song JY, Choi MJ, Kim IS, Yang TU, Hong KW, et al. Etiolo- gy and clinical outcomes of acute respiratory virus infection in hos- pitalized adults. Infect Chemother 2014;46:67-76.
35. Seo YB, Cheong HJ, Song JY, Noh JY, Kim IS, Song DJ, et al. Epide- miologic differences of four major respiratory viruses between children, adolescents, and adults in Korea. J Infect Chemother 2014;20:672-7.