ISSN 2234-3806 • eISSN 2234-3814
https://doi.org/10.3343/alm.2018.38.4.331
Usefulness of Enhanced Liver Fibrosis, Glycosylation Isomer of Mac-2 Binding Protein, Galectin-3, and
Soluble Suppression of Tumorigenicity 2 for Assessing Liver Fibrosis in Chronic Liver Diseases
Hee-Won Moon, M.D.1, Mikyoung Park, M.D.1, Mina Hur, M.D.1, Hanah Kim, M.D.1, Won Hyeok Choe, M.D.2, and Yeo-Min Yun, M.D.1
Departments of Laboratory Medicine1 and Internal Medicine2, Konkuk University School of Medicine, Seoul, Korea
Background: Liver biopsies have been partially replaced by noninvasive methods for as- sessing liver fibrosis. We explored the usefulness of four novel biomarkers, enhanced liver fibrosis (ELF), glycosylation isomer of Mac-2 binding protein (M2BPGi), galectin-3, and soluble suppression of tumorigenicity 2 (sST2), in association with liver fibrosis.
Methods: ELF, M2BPGi, galectin-3, and sST2 were assayed in 173 patients with chronic liver diseases. The results were analyzed according to fibrosis grade (F0/1, F2, and F3/4) by transient elastography (TE).
Results: ELF, M2BPGi, galectin-3, and sST2 values differed significantly according to TE grade; ELF and M2BPGi values were higher in F2 and F3/4 than in F0/1 (P ≤0.001, all), sST2 values were higher in F3/4 than in F0/1 and F2 (P <0.05), and galectin-3 values were higher in F3/4 than in F0/1 (P =0.0036). ELF and M2BPGi showed good TE fibrosis detection performance (area under the curves [AUC], 0.841 and 0.833 for ≥F2; and 0.837 and 0.808 for ≥F3). The sensitivity and specificity for predicting TE grade F≥2 were 84.1%
and 76.7% for ELF and 63.6% and 91.5% for M2BPGi.
Conclusions: This is the first study to compare the liver fibrosis assessment of four novel biomarkers: ELF, M2BPGi, galectin-3, and sST2. The biomarkers varied significantly ac- cording to TE grade, and each biomarker showed a different trend. ELF and M2BPGi seem to have comparable good performance for detecting liver fibrosis.
Key Words: Liver fibrosis, Biomarker, ELF, M2BPGi, Galectin-3, sST2
Received: August 9, 2017
Revision received: November 14, 2017 Accepted: January 29, 2018
Corresponding author: Mina Hur Department of Laboratory Medicine, Konkuk University School of Medicine, Konkuk University Medical Center, 120-1 Neungdong-ro, Gwangjin-gu, Seoul 05030, Korea
Tel: +82-2-2030-5581 Fax: +82-2-2636-6764 E-mail: [email protected]
© Korean Society for Laboratory Medicine This is an Open Access article distributed under the terms of the Creative Commons Attribution Non-Commercial License (http://creativecom- mons.org/licenses/by-nc/4.0) which permits unrestricted non-commercial use, distribution, and reproduction in any medium, provided the original work is properly cited.
INTRODUCTION
Liver fibrosis, defined as the excessive accumulation of extracel- lular matrix, can occur in all chronic liver diseases (CLD) [1, 2].
Progressive liver fibrosis is a major cause of morbidity, ultimately resulting in hepatocellular carcinoma (HCC) and death without proper treatment [3]. Although liver fibrosis has been consid- ered irreversible, liver fibrosis regression has been achieved by
alleviating hepatic inflammation and damage with potent antivi- ral agents [4]. Accurate assessment and monitoring of the de- gree of liver fibrosis is important for the management of patients with CLD [5].
Liver biopsy (LB) has long been regarded as the reference method for assessing and grading liver fibrosis [6]. However, it is invasive and has limitations including sampling errors, inter- and intra-observer variability, and procedural complications [6,
2017-03-16 https://crossmark-cdn.crossref.org/widget/v2.0/logos/CROSSMARK_Color_square.svg
7]. It is difficult to perform repeated LB examinations to monitor fibrotic burden in clinical practice; thus, many noninvasive meth- ods have been suggested as an alternative to LB [7]. Transient elastography (TE) measures liver elasticity using a low frequency elastic wave transmitted through the liver and is considered a highly reproducible and reliable option for grading liver fibrosis, except in some cases such as obesity [5, 8-10].
Suggested blood biomarkers range from simple tests using routine laboratory parameters, such as the aspartate aminotrans- ferase-to-platelet ratio index (APRI), to more complex equations such as the FibroTest (FT) or Enhanced Liver Fibrosis (ELF) Test (Siemens Diagnostics, Tarrytown, NY, USA) [11, 12]. Recently, glycosylation isomer of Mac-2 binding protein (M2BPGi, Wiste- ria floribunda agglutinin [WFA]-positive Mac-2 binding protein, WFA+-M2BP) has emerged as a novel biomarker for estimating liver fibrosis and predicting HCC; however, this biomarker has been evaluated mainly in Japanese populations [13-16]. Galec- tin-3 and the soluble isoform of suppression of tumorigenicity 2 (sST2) have emerged as biomarkers of heart failure (HF), mainly reflecting cardiac fibrosis [17, 18]. These proteins are involved in inflammation and fibrosis in various, non-cardiac conditions [19-21] and play prognostic roles [22, 23]. Given their possible involvement in liver fibrosis, further investigations could shed important light on these markers [24].
This study aimed to evaluate the usefulness of four new bio- markers, ELF, M2BPGi, galectin-3, and sST2, for assessing liver fibrosis status. We examined the association of these biomark- ers with fibrosis grade and determined the optimal cut-off values for their application in patients with CLD. In addition, we evalu- ated the association between these biomarkers and prognostic scores.
METHODS 1. Study population
This study was approved by the Institutional Review Board (KUH- 1200072) of the Konkuk University Medical Center, Seoul, Ko- rea, prior to collecting the first sample from the first patient. We included a total of 173 patients (105 males and 68 females) with CLD, who visited our center from October 2016 to February 2017 and completed TE and blood sampling on the day. We excluded patients when their TE measurements failed or their residual blood samples were insufficient for other tests. To evaluate prog- nosis, the model for end-stage liver disease (MELD) and Child- Turcotte-Pugh (CTP) scores were calculated at enrollment [25, 26]. Clinical and laboratory data, including underlying diseases,
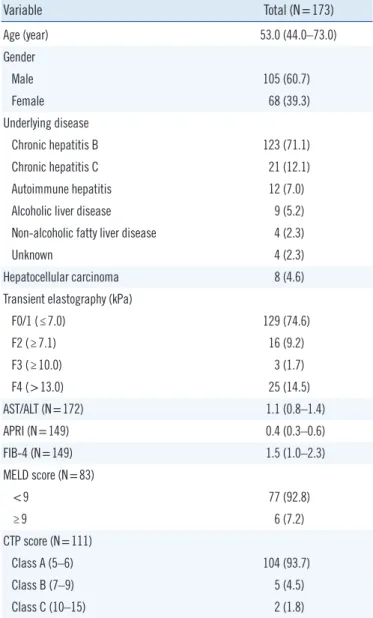
APRI, and fibrosis-4 index (FIB-4), were collected by reviewing the medical records. The characteristics of the study population are summarized in Table 1.
TE was performed by a well-trained technician using the Fi- broScan device (Echosens, Paris, France), as previously describ ed [9]. TE results with at least 10 valid measurements and a suc- cess rate of at least 60% were considered reliable. The degree of fibrosis was graded as follows: F0/1≤7.0 kilopascal (kPa), pre- sumed no or minimal fibrosis; F2≥7.1 kPa, presumed moder- ate fibrosis; F3≥10.0 kPa, presumed severe fibrosis; and F4≥13 kPa, presumed cirrhosis [10].
Table 1. Characteristics of the study population
Variable Total (N=173)
Age (year) 53.0 (44.0–73.0)
Gender
Male 105 (60.7)
Female 68 (39.3)
Underlying disease
Chronic hepatitis B 123 (71.1)
Chronic hepatitis C 21 (12.1)
Autoimmune hepatitis 12 (7.0)
Alcoholic liver disease 9 (5.2)
Non-alcoholic fatty liver disease 4 (2.3)
Unknown 4 (2.3)
Hepatocellular carcinoma 8 (4.6)
Transient elastography (kPa)
F0/1 (≤7.0) 129 (74.6)
F2 (≥7.1) 16 (9.2)
F3 (≥10.0) 3 (1.7)
F4 (>13.0) 25 (14.5)
AST/ALT (N=172) 1.1 (0.8–1.4)
APRI (N=149) 0.4 (0.3–0.6)
FIB-4 (N=149) 1.5 (1.0–2.3)
MELD score (N=83)
<9 77 (92.8)
≥9 6 (7.2)
CTP score (N=111)
Class A (5–6) 104 (93.7)
Class B (7–9) 5 (4.5)
Class C (10–15) 2 (1.8)
Data are presented as median (interquartile range) or number (percentage).
Abbreviations: APRI, aspartate aminotransferase to platelet ratio index; FIB- 4, fibrosis-4; MELD, model for end-stage liver disease; CTP, Child-Turcotte- Pugh.
The residual samples were collected following routine blood tests, divided into small aliquots to avoid repeated freezing and thawing, and then stored at –70°C until use. Frozen samples were thawed at room temperature (20 to 26°C) and gently mixed immediately prior to biomarker measurement. The data were analyzed anonymously and this study required neither study- specific intervention nor any other intervention; therefore, writ- ten informed consent from enrolled patients was exempted.
2. Assays
For the ELF test, hyaluronic acid (HA), tissue inhibitor of matrix metalloproteinases-1 (TIMP-1), and aminoterminal propeptide of procollagen type III (PIIINP) concentrations were measured using an ADVIA Centaur XP automated immunoanalyzer (Sie- mens Healthcare Diagnostics, Tarrytown, NY, USA). ELF values were calculated using the algorithm (ELF=2.278+0.851 ln[HA]
+0.751 ln[PIIINP]+0.394 ln[TIMP-1]). The values were inter- preted as: <7.7, none to mild; ≥7.7 –<9.8, moderate; and ≥9.8, severe, according to the manufacturer’s recommendation; re- sults above moderate (≥7.7) were considered positive [27]. M2- BPGi was measured using an HISCL-5000 immunoanalyzer (Sysmex Co., Kobe, Japan) based on the 2-step sandwich che- miluminescent enzyme immunoassay [13]. The measured val- ues of M2BPGi conjugated to WFA were indexed with obtained values using the following equation: cut-off index (COI)=(S-N)/
(C-N), where S is the light intensity of the sample, C is the cut- off value, and N is the light intensity of the negative control. The positive control was supplied as a calibration solution prelimi- narily standardized to yield a COI value of 1.0. The sample was
considered positive when the COI was >1.00 (1+, 1.00 ≤COI
<3.00; 2+, COI ≥3.00) [13]. Galectin-3 concentrations were measured using the VIDAS automated enzyme-linked fluores- cent assay (bioMérieux, Marcy-l’Etoile, France). sST2 concen- trations were measured using the Presage ST2 Assay (Critical Diagnostics, San Diego, CA, USA), which is based on a quanti- tative sandwich monoclonal ELISA.
3. Statistical analysis
Data were expressed as median and interquartile range (IQR) or number and percentage. The difference between the continu- ous variables was analyzed using the Mann-Whitney U test, and the difference between categorical variables was analyzed using the chi-square test, Fisher’s exact test, or the Cochran-Armitage test for trend. Differences between biomarkers were assessed according to TE grade (F0/F1, F2, and F3/4), MELD score, and CTP score. Agreement between assays was determined using Cohen’s Kappa statistic (agreement: <0.20, none; 0.21–0.39, minimal; 0.40–0.59, weak; 0.60–0.79, moderate; 0.80–0.90, strong; >0.90, nearly perfect) [28]. The TE grade prediction performance of each biomarker (F≥2 and F≥3) was assessed using ROC curves. The area under the curve (AUC) with 95%
confidence interval (CI) was calculated; good performance was defined as AUC >0.8 [29]. The TE grade prediction sensitivity and specificity of each biomarker were also calculated. Statisti- cal analysis was performed using MedCalc Statistical Software (version 15.8, MedCalc Software, Mariakerke, Belgium) and IBM SPSS Statistics 22.0 (IBM Corporation, Armonk, NY, USA).
P <0.05 was considered statistically significant.
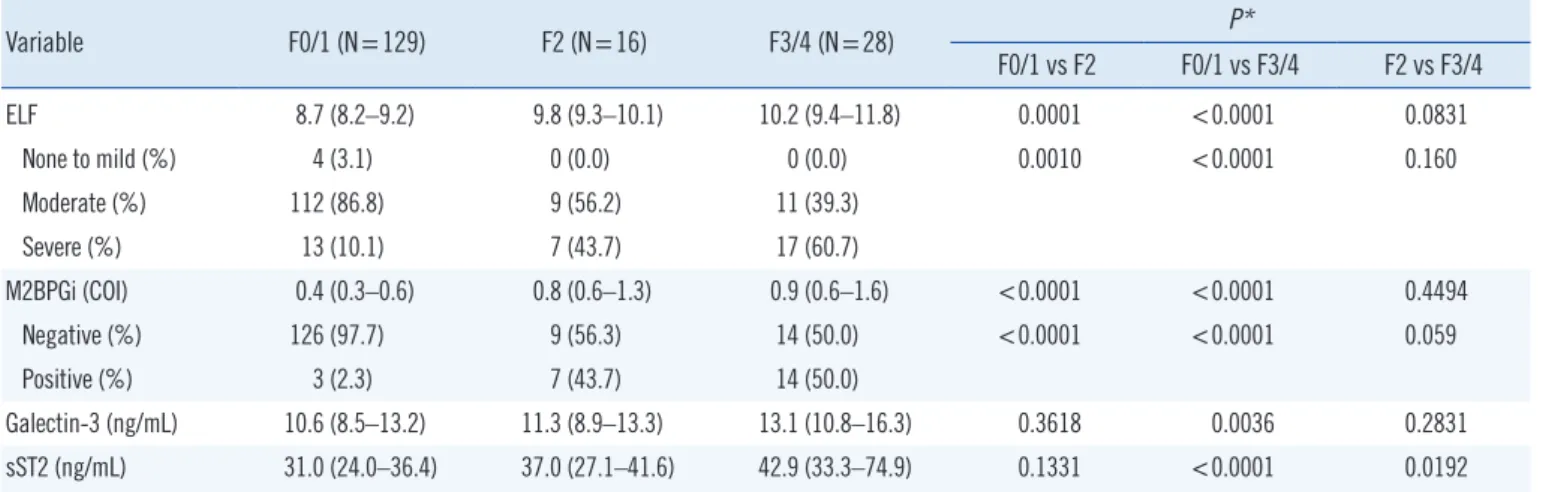
Table 2. Comparison of biomarkers according to TE grade
Variable F0/1 (N=129) F2 (N=16) F3/4 (N=28) P*
F0/1 vs F2 F0/1 vs F3/4 F2 vs F3/4
ELF 8.7 (8.2–9.2) 9.8 (9.3–10.1) 10.2 (9.4–11.8) 0.0001 <0.0001 0.0831
None to mild (%) 4 (3.1) 0 (0.0) 0 (0.0) 0.0010 <0.0001 0.160
Moderate (%) 112 (86.8) 9 (56.2) 11 (39.3)
Severe (%) 13 (10.1) 7 (43.7) 17 (60.7)
M2BPGi (COI) 0.4 (0.3–0.6) 0.8 (0.6–1.3) 0.9 (0.6–1.6) <0.0001 <0.0001 0.4494
Negative (%) 126 (97.7) 9 (56.3) 14 (50.0) <0.0001 <0.0001 0.059
Positive (%) 3 (2.3) 7 (43.7) 14 (50.0)
Galectin-3 (ng/mL) 10.6 (8.5–13.2) 11.3 (8.9–13.3) 13.1 (10.8–16.3) 0.3618 0.0036 0.2831
sST2 (ng/mL) 31.0 (24.0–36.4) 37.0 (27.1–41.6) 42.9 (33.3–74.9) 0.1331 <0.0001 0.0192
Data are presented as median (interquartile range) or number (percentage).
*Mann-Whitney U test (galectin-3 and sST2); chi-square test or Fisher’s exact test (ELF and M2BPGi).
Abbreviations: TE, transient elastography; ELF, enhanced liver fibrosis; M2BPGi, Mac-2-binding protein glycosylation isomer; sST2, soluble suppression of tumorigenicity 2.
RESULTS
1. Comparison of biomarkers according to TE grade
ELF, M2BPGi, galectin-3, and sST2 values differed significantly according to TE grade (Table 2 and See Supplemental Data Fig.
S1). All four biomarkers increased in F3/4 compared with F0/1 (P <0.0001 except galectin-3, P =0.0036). ELF and M2BPGi values were higher in F2 than in F0/1 (P ≤0.001, all); however, no significant differences were observed between F2 and F3/4.
In contrast, sST2 concentration increased in F3/4 compared with F2 (P =0.0192); however, no significant difference was ob- served between F0/1 and F2. The positivity of ELF and M2BPGi increased according to TE grade (both P <0.0001 by Cochran- Armitage test for trend).
2. Comparison of ROC curves for prediction of TE grade
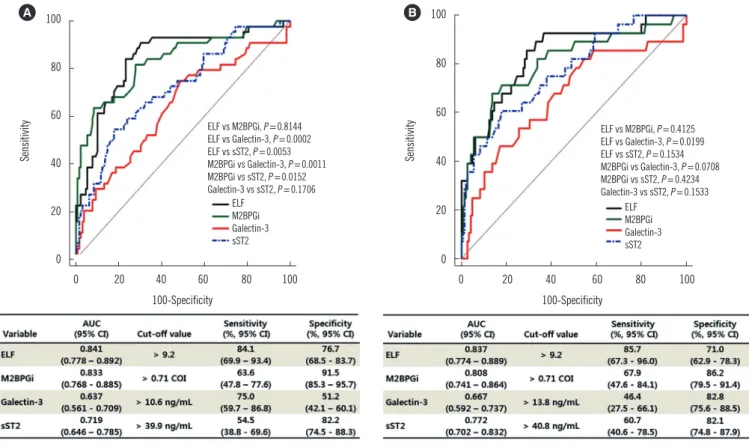
Both ELF and M2BPGi predicted TE grade F≥2 and F≥3 with good performance (AUC of 0.841 and 0.837, respectively, for ELF; AUC of 0.833 and 0.808, respectively, for M2BPGi; Fig. 1).The AUCs of ELF and M2BPGi were greater than those of galec- tin-3 and sST2 for detecting TE grade F≥2 (P =0.0002, 0.0053
and P =0.0011, 0.0152, respectively). TE grade F≥2 prediction sensitivity and specificity were 84.1% and 76.7% for ELF and 63.6% and 91.5% for M2BPGi. For TE grade F ≥3, only ELF showed a greater AUC compared with galectin-3 (P =0.0199).
3. Distribution and agreement of fibrosis grades according to TE, ELF, and M2BPGi
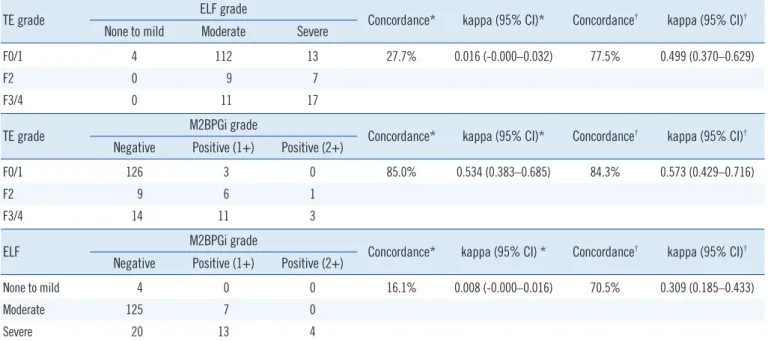
Concordance and agreement between TE grade, ELF, and M2B- PGi were determined using both the manufacturer-suggested cut-off values for ELF and M2BPGi (7.7 and COI of 1.0, respec- tively) and their optimal cut-off values derived from ROC curve analyses (ELF >9.2; M2BPGi, COI of 0.71). Using the pre-set cut-off values for detecting TE grade F≥2, only M2BPGi showed a concordance of 85.0% with weak agreement (kappa 0.534, 95% CI=0.383–0.685; Table 3). The concordance between TE grade and ELF and between ELF and M2BPGi was very low (27.7% and 16.1%, respectively) with no agreement. When the optimal cut-off values for ELF and M2BPGi were used, the con- cordance between TE, ELF, and M2BPGi improved, ranging from 70.5% to 84.3%.
Fig. 1. Comparison of the receiver operating characteristics curves for predicting transient elastography grade F≥2 (A) and F≥3 (B).
Abbreviations: TE, transient elastography; ELF, enhanced liver fibrosis; M2BPGi, Mac-2-binding protein glycosylation isomer; sST2, soluble suppression of tumorigenicity 2.
100
80
60
40
20
0
0 20 40 60 80 100 100-Specificity
Sensitivity
ELF vs M2BPGi, P =0.8144 ELF vs Galectin-3, P =0.0002 ELF vs sST2, P =0.0053 M2BPGi vs Galectin-3, P =0.0011 M2BPGi vs sST2, P =0.0152 Galectin-3 vs sST2, P =0.1706
ELF M2BPGi Galectin-3 sST2
A 100
80
60
40
20
0
0 20 40 60 80 100 100-Specificity
Sensitivity
ELF vs M2BPGi, P =0.4125 ELF vs Galectin-3, P =0.0199 ELF vs sST2, P =0.1534 M2BPGi vs Galectin-3, P =0.0708 M2BPGi vs sST2, P =0.4234 Galectin-3 vs sST2, P =0.1533
ELF M2BPGi Galectin-3 sST2 B
4. Comparison of each biomarker according to MELD and CTP scores
The distribution of the four biomarkers did not differ between high and low MELD scores (Table 4). In terms of CTP scores, the distribution of ELF, M2BPGi, and sST2 values differed sig- nificantly between high and low CTP scores (P =0.0096, 0.0320, and 0.0258, respectively).
DISCUSSION
We evaluated the usefulness of the emerging biomarkers ELF, M2BPGi, galectin-3, and sST2 for assessing liver fibrosis and prognostic values in CLD. All biomarker values differed signifi- cantly according to fibrosis grade; ELF (≥7.7 score) and M2B- PGi (≥1+) liver fibrosis positivity increased significantly accord- ing to TE grade (both P <0.0001) (Table 2 and See Supplemen- Table 3. Distribution and agreement of fibrosis grades according to TE, ELF, and M2BPGi
TE grade ELF grade
Concordance* kappa (95% CI)* Concordance† kappa (95% CI)† None to mild Moderate Severe
F0/1 4 112 13 27.7% 0.016 (-0.000–0.032) 77.5% 0.499 (0.370–0.629)
F2 0 9 7
F3/4 0 11 17
TE grade M2BPGi grade
Concordance* kappa (95% CI)* Concordance† kappa (95% CI)† Negative Positive (1+) Positive (2+)
F0/1 126 3 0 85.0% 0.534 (0.383–0.685) 84.3% 0.573 (0.429–0.716)
F2 9 6 1
F3/4 14 11 3
ELF M2BPGi grade
Concordance* kappa (95% CI) * Concordance† kappa (95% CI)† Negative Positive (1+) Positive (2+)
None to mild 4 0 0 16.1% 0.008 (-0.000–0.016) 70.5% 0.309 (0.185–0.433)
Moderate 125 7 0
Severe 20 13 4
*The agreement between groups was calculated based on TE grade F≥2 and the suggested cut-off values for ELF and M2BPGi (7.7 and COI of 1.0, respec- tively); †The agreement between groups was calculated based on TE grade F≥2 and the optimal cut-off values for ELF and M2BPGi (9.2 and COI of 0.71, respectively).
Abbreviations: TE, transient elastography; ELF, enhanced liver fibrosis; M2BPGi, Mac-2-binding protein glycosylation isomer; sST2, soluble suppression of tumorigenicity 2.
Table 4. Comparison of each biomarker according to MELD and CTP scores
MELD<9 (N=77) MELD≥9 (N=6) P* CTP <7 (N=104) CTP ≥7 (N=7) P*
ELF 9.1 (8.3–9.8) 9.2 (8.4–9.7) 0.9477 9.1 (8.5–9.8) 10.6 (9.7–12.1) 0.0096
None to mild (%) 1 (1.3) 0 (0.0) 0.7704 1 (1.0) 0 (0.0) 0.0632
Moderate (%) 56 (73.7) 6 (85.7) 77 (74.8) 3 (37.5)
Severe (%) 19 (25.0) 1 (14.3) 25 (24.3) 5 (62.5)
M2BPGi (COI) 0.4 (0.3–0.7) 0.5 (0.2–1.2) 0.9935 0.5 (0.3–0.8) 1.1 (0.6–2.4) 0.0320
Negative (%) 64 (84.2) 5 (71.4) 0.3359 85 (82.5) 4 (50.0) 0.0479
Positive (%) 12 (15.8) 2 (28.6) 18 (17.5) 4 (50.0)
Galectin-3 (ng/mL) 10.7 (8.7–12.9) 10.4 (8.6–15.7) 0.5443 10.8 (8.7–13.2) 13.7 (11.5–15.3) 0.0830
sST2 (ng/mL) 31.3 (24.9–39.8) 36.0 (27.9–42.1) 0.5443 31.9 (27.7–39.8) 44.6 (35.0–72.9) 0.0258
Data are presented as median (interquartile range) or number (percentage).
*Mann-Whitney U test (galectin-3 and sST2); chi-square test or Fisher’s exact test (ELF and M2BPGi).
Abbreviations: APRI, aspartate aminotransferase to platelet ratio index; FIB-4, fibrosis-4; MELD, model for end-stage liver disease; CTP, Child-Turcotte-Pugh;
TE, transient elastography; ELF, enhanced liver fibrosis; M2BPGi, Mac-2-binding protein glycosylation isomer; sST2, soluble suppression of tumorigenicity 2.
tal Data Fig. S1). However, the distribution patterns of the bio- markers varied. While ELF and M2BPGi could discriminate F0/1 and F2, they could not discriminate F2 and F3/4. In contrast, sST2 could discriminate F2 and F3/4, but could not discrimi- nate F0/1 and F2. Compared with ELF and M2BPGi, sST2 ap- pears to be related to more advanced fibrosis grades.
ELF and M2BPGi use different targets for assessing fibrosis.
ELF incorporates HA, TIMP-1, and P3NP, which are all involved in extracellular matrix synthesis and degradation [30]. During the progression of liver disease and fibrosis, the N-glycosylation of M2BP is altered, and it binds to galectin-3, β-1 integrins, col- lagens, and fibronectin [15]. M2BPGi assays measure the WFA- positive, glycosylation isomer of M2BP. Previous studies have shown that ELF has a better ability to discriminate moderate fi- brosis (F≥2) [31], whereas M2BPGi possesses a better capac- ity to discriminate severe fibrosis (F≥3) [13]. However, our data did not show this trend; thus, further studies are needed to gain more insight.
ELF and M2BPGi were comparable in ROC curve analyses, exhibiting equally good performance for detecting TE grade F≥
2 and F≥3 (Fig. 1). Considering the number of laboratory mark- ers, M2BPGi, which uses a single marker, would be a more prac- tical option than ELF, which requires three markers. However, the respective agreement between TE, ELF, and M2BPGi was weak (Table 3); the reported values of ELF and M2BPGi were interpreted semi-quantitatively using manufacturer-provided, pre-defined cut-off values. Our data indicate that the optimal cut-off values of ELF and M2BPGi for detecting liver fibrosis dif- fered from the manufacturer-provided cut-off values (9.2 vs 7.7 and 0.71 COI vs 1.00 COI, respectively). Using the manufac- turer-recommended cut-off (7.7), ELF showed too many positive results compared with TE and poor agreement with TE or M2B- PGi. A higher cut-off value would be desirable to improve the performance of ELF. The recent guidelines of the National Insti- tute for Health and Care Excellence (NICE) recommend the use of ELF for monitoring advanced liver fibrosis in non-alcoholic fatty liver disease and suggest a cut-off of 10.51 [32].
To the best of our knowledge, this is the first study to evaluate the four biomarkers, ELF, M2BPGi, galectin-3, and sST2, in as- sociation with liver fibrosis. Galectin-3, a paracrine factor mainly secreted by activated macrophages, has been identified as a critical regulator in inflammation and fibrogenesis [19], while sST2 is known to be involved in non-cardiac inflammation [21].
Both are promising markers for systemic inflammation and fi- brosis process, and their evaluation in various clinical conditions would be valuable. In this study, galectin-3 and sST2 increased
significantly in liver fibrosis; however, their ability to detect liver fibrosis was not superior to that of the more specific and vali- dated liver biomarkers, ELF and M2BPGi. Galectin-3 and sST2 might reflect systemic fibrosis rather than organ-specific fibro- sis. Further studies are necessary to elucidate the diagnostic and prognostic roles of galectin-3 and sST2 in relation to liver fi- brosis. Regarding prognosis, although all four biomarkers were unrelated to MELD score, higher values of ELF, M2BPGi, and sST2 were associated with high CTP score (Table 4). Additional data are required to evaluate the independent roles of these bio- markers in prognosis prediction.
This study has several limitations. We could not assess the degree of liver fibrosis based on LB, which is still considered the gold standard; however, its utilization is restricted because of in- vasiveness and has been mostly replaced by non-invasive ap- proaches [10]. From a practical viewpoint, it was difficult to en- roll patients who had undergone LB, because our hospital uses TE to assess liver fibrosis in most routine situations. Recently, a non-invasive approach implementing both elastographic and serologic tests has been proposed. In this approach, the con- cordance between elastographic and serologic tests is assessed and LB is limited solely to patients with discordant results [33].
In addition, our study population was not sufficiently large for each grade of liver fibrosis, especially high-grade fibrosis. Be- cause the performance of each biomarker may differ according to fibrosis grade, further large-scale studies would be needed to elucidate the clinical usefulness of each biomarker. Our study focused on novel, potential fibrosis markers; thus, we excluded the analysis of conventional markers, including APRI or FIB-4, because they have been extensively studied.
In conclusion, we evaluated four potential biomarkers, ELF, M2BPGi, galectin-3, and sST2, for assessing liver fibrosis in pa- tients with CLD. The values of each biomarker differed signifi- cantly according to fibrosis grade and showed a different trend.
ELF and M2BPGi exhibited equally good performance for de- tecting moderate and severe liver fibrosis. Optimal cut-off values should be applied for the interpretation of liver fibrosis, following validation in each population. Large-scale, prospective studies are required to elucidate the clinical usefulness of galectin-3 and sST2 for assessing liver fibrosis.
Authors’ Disclosures of Potential Conflicts of Interest
No potential conflicts of interest relevant to this article were re- ported.
REFERENCES
1. Friedman SL. Mechanisms of hepatic fibrogenesis. Gastroenterology 2008;134:1655-69.
2. Kim JH, Kim MN, Han KH, Kim SU. Clinical application of transient elastography in patients with chronic viral hepatitis receiving antiviral treatment. Liver Int 2015;35:1103-15.
3. Lok AS. Hepatitis B: liver fibrosis and hepatocellular carcinoma. Gastro- enterol Clin Biol 2009;33:911-5.
4. Dienstag JL, Schiff ER, Wright TL, Perrillo RP, Hann HW, Goodman Z, et al. Lamivudine as initial treatment for chronic hepatitis B in the Unit- ed States. N Engl J Med 1999;341:1256-63.
5. Kim SU, Kim BK, Han KH. Clinical application of liver stiffness measure- ment using transient elastography: a surgical perspective. Digestion 2013;
88:258-65.
6. Bravo AA, Sheth SG, Chopra S. Liver biopsy. N Engl J Med 2001;344:
495-500.
7. Rousselet MC, Michalak S, Dupré F, Croué A, Bedossa P, Saint-André JP, et al. Sources of variability in histological scoring of chronic viral hep- atitis. Hepatology 2005;41:257-64.
8. Tsochatzis EA, Gurusamy KS, Ntaoula S, Cholongitas E, Davidson BR, Burroughs AK. Elastography for the diagnosis of severity of fibrosis in chronic liver disease: a meta-analysis of diagnostic accuracy. J Hepatol 2011;54:650-9.
9. Kim MN, Kim SU, Kim BK, Park JY, Kim DY, Ahn SH, et al. Increased risk of hepatocellular carcinoma in chronic hepatitis B patients with tran- sient elastography-defined subclinical cirrhosis. Hepatology 2015;61:
1851-9.
10. Friedrich-Rust M, Poynard T, Castera L. Critical comparison of elastog- raphy methods to assess chronic liver disease. Nat Rev Gastroenterol Hepatol 2016;13:402-11.
11. Castéra L, Sebastiani G, Le Bail B, de Lédinghen V, Couzigou P, Alberti A.
Prospective comparison of two algorithms combining non-invasive meth- ods for staging liver fibrosis in chronic hepatitis C. J Hepatol 2010;52:
191-8.
12. Imbert-Bismut F, Ratziu V, Pieroni L, Charlotte F, Benhamou Y, Poynard T, et al. Biochemical markers of liver fibrosis in patients with hepatitis C virus infection: a prospective study. Lancet 2001;357:1069-75.
13. Kuno A, Ikehara Y, Tanaka Y, Ito K, Matsuda A, Sekiya S, et al. A serum
“sweet-doughnut” protein facilitates fibrosis evaluation and therapy as- sessment in patients with viral hepatitis. Sci Rep 2013;3:1065.
14. Abe M, Miyake T, Kuno A, Imai Y, Sawai Y, Hino K, et al. Association between Wisteria floribunda agglutinin-positive Mac-2 binding protein and the fibrosis stage of non-alcoholic fatty liver disease. J Gastroenterol 2015;50:776-84.
15. Yamasaki K, Tateyama M, Abiru S, Komori A, Nagaoka S, Saeki A, et al.
Elevated serum levels of Wisteria floribunda agglutinin-positive human Mac-2 binding protein predict the development of hepatocellular carci- noma in hepatitis C patients. Hepatology 2014;60:1563-70.
16. Ito K, Kuno A, Ikehara Y, Sugiyama M, Saito H, Aoki Y, et al. LecT-Hepa, a glyco-marker derived from multiple lectins, as a predictor of liver fibro-
sis in chronic hepatitis C patients. Hepatology 2012;56:1448-56.
17. Wettersten N and Maisel AS. Biomarkers for heart failure: an update for practitioners of internal medicine. Am J Med 2016;129:560-7.
18. Yancy CW, Jessup M, Bozkurt B, Butler J, Casey DE Jr, Drazner MH, et al. 2013 ACCF/AHA guideline for the management of heart failure: a re- port of the American College of Cardiology Foundation/American Heart Association Task Force on practice guidelines. Circulation 2013;128:
e240-327.
19. Henderson NC and Sethi T. The regulation of inflammation by galectin-3.
Immunol Rev 2009;230:160-71.
20. Hsieh WC, Mackinnon AC, Lu WY, Jung J, Boulter L, Henderson NC, et al. Galectin-3 regulates hepatic progenitor cell expansion during liver in- jury. Gut 2015;64:312-21.
21. Mueller T and Dieplinger B. The Presage(®) ST2 Assay: analytical con- siderations and clinical applications for a high-sensitivity assay for mea- surement of soluble ST2. Expert Rev Mol Diagn 2013;13:13-30.
22. Hur M, Kim H, Kim HJ, Yang HS, Magrini L, Marino R, et al. Soluble ST2 has a prognostic role in patients with suspected sepsis. Ann Lab Med 2015;35:570-7.
23. Kim H, Hur M, Moon HW, Yun YM, Di Somma S; GREAT Network. Multi- marker approach using procalcitonin, presepsin, galectin-3, and soluble suppression of tumorigenicity 2 for the prediction of mortality in sepsis.
Ann Intensive Care 2017;7:27.
24. Pejnovic N, Jeftic I, Jovicic N, Arsenijevic N, Lukic ML. Galectin-3 and IL-33/ST2 axis roles and interplay in diet-induced steatohepatitis. World J Gastroenterol 2016;22:9706-17.
25. Kamath PS, Kim WR, Advanced Liver Disease Study Group. The model for end-stage liver disease (MELD). Hepatology 2007;45:797-805.
26. Murray KF, Carithers RL Jr, AASLD. AASLD practice guidelines: evalua- tion of the patient for liver transplantation. Hepatology 2005;41:1407- 32.
27. Lichtinghagen R, Pietsch D, Bantel H, Manns MP, Brand K, Bahr MJ.
The Enhanced Liver Fibrosis (ELF) score: normal values, influence fac- tors and proposed cut-off values. J Hepatol 2013;59:236-42.
28. McHugh ML. Interrater reliability: the kappa statistic. Biochem Med (Za- greb) 2012;22:276-82.
29. Weinstein MC and Fineberg HV. Clinical decision analysis. Philadelphia:
WB Saunders, 1980.
30. Parkes J, Guha IN, Roderick P, Harris S, Cross R, Manos MM, et al. En- hanced Liver Fibrosis (ELF) test accurately identifies liver fibrosis in pa- tients with chronic hepatitis C. J Viral Hepat 2011;18:23-31.
31. Kim BK, Kim HS, Park JY, Kim DY, Ahn SH, Chon CY, et al. Prospective validation of ELF test in comparison with Fibroscan and FibroTest to pre- dict liver fibrosis in Asian subjects with chronic hepatitis B. PLoS One 2012;7:e41964.
32. National Institute for Health and Care Excellence. Non-alcoholic fatty liver disease (NAFLD): assessment and management. NICE guideline [NG49], July 2016.
33. Tapper EB and Lok AS. Use of liver imaging and biopsy in clinical prac- tice. N Engl J Med 2017;377:756-68.
Supplemental Data Fig. S1. Distribution of each biomarker according to TE grade. Boxes designate the interquartile range (25 to 75 per- centile) and the middle line represents the median. The error bar represents minimum and maximum values.
Abbreviations: TE, transient elastography; ELF, enhanced liver fibrosis; M2BPGi, Mac-2-binding protein glycosylation isomer; sST2, soluble suppression of tumorigenicity 2.
17 15 13 11 9
7
F0/1 F2 F3/4
ELF
P <0.0001 P =0.0001 P =0.0831 A
35 28 21 14 7
0
F0/1 F2 F3/4
Galectin-3 (ng/mL)
P =0.0036 P =0.3618 P =0.2831 C
10 8 6 4 2
0
F0/1 F2 F3/4
M2BPGi (COI)
P <0.0001 P <0.0001 P =0.4494 B
150 120 90 60 30
0
F0/1 F2 F3/4
sST2 (ng/mL)
P <0.0001 P =0.1331 P =0.0192 D