Vol. 18, No. 4 pp. 143-153, 2017
Factors Affecting Intention to Use Smartphone Healthcare Applications
Mijeong Park
Department of Nursing, Hoseo University
스마트폰 헬스케어 어플리케이션 수용의도에 영향을 미치는 요인
박미정
호서대학교 간호학과
Abstract This was a descriptive survey to determine the intention of users to use smartphone healthcare applications (SHAs) and to clarify factors that may influence such intention. The data were collected during the month of April in 2015, using a structured self-report questionnaire that was distributed to 300 participants aged 20 to 70 years; 285 complete copies were used for the final analysis. The data were analyzed using descriptive statistics, independent t-test, one-way ANOVA, Pearson correlation coefficients, and hierarchical multiple regression. First, according to the results, the average intention to use SHAs was 3.28 out of 5, which varied according to age, final education, economy level, vacation, current disease, total period of smartphone use, and etc. Second, significant correlations were shown by exercise behavior, dietary management behavior, stress management, satisfaction with smartphone use, and satisfaction with using SHAs. Third, the explanatory power of the predictive model involving all general, health-related, smartphone use-related, and SHA use-related factors was 45.5%; and the economic level, interest, status, and awareness satisfaction of patients using SHA were identified to be the main influential factors. The results indicate that SHA developers need to put efforts into improving consumers' app recognition and to develop plans in provoking consumers' interests to increase the use of SHAs.
요 약 본 연구는 스마트폰 헬스케어 어플리케이션의 수용의도와 이에 영향을 미치는 요인을 확인하기 위해 시행된 서술적 조사연구이다. 본 연구에서는 2015년 4월 자가보고식 설문지를 이용하여 20~70대 300명을 대상으로 자료를 수집하였으며, 최종적으로 285명의 자료가 기술통계, independent t-test, One-way ANOVA, Pearson correlation coefficients, hierarchical multiple regression를 이용하여 분석되었다. 연구 결과, 헬스케어 어플리케이션의 수용의도는 점수가능범위 1~5점 중 3.28점 이었으며, 연령, 교육 및 경제 수준, 직업 및 질병 여부, 스마트폰 사용 기간 등에 따라 차이가 있었고, 운동실천 정도, 식이 및 스트레스 관리 정도, 스마트폰 및 헬스케어 어플리케이션 사용 만족 정도에 따라 유의한 상관관계가 있었다. 그리고 연구 대상자의 일반적 및 건강관련 특성, 스마트폰 및 헬스케어 어플리케이션 사용 관련요인은 헬스케어 어플리케이션에 대한 수용의도를 45.5% 설명하였으며, 특히 경제수준, 헬스케어 어플리케이션에 대한 인지 만족도와 관심 여부가 수용의도에 영 향을 미치는 주요 요인으로 확인되었다. 이 연구 결과를 바탕으로 스마트폰 헬스케어 어플리케이션 개발 시 스마트폰 어플리 케이션에 대한 사용자의 인지 수준을 높이고 흥미를 이끌어 낼 수 있는 다양한 전략들을 함께 개발 및 적용할 것을 제언하는 바이다.
Keywords : Healthcare, Intention, Mobile Applications, Needs, Utilization
This work was supported by the National Research Foundation of Korea(NRF) grant funded by the Korea government(MSIP) (No.
NRF-2014R1A1A1003885).
*Corresponding Author : Mijeong Park (Hoseo University) Tel: +82-41-540-9535 email: mijeong@hoseo.edu Received March 7, 2017
Accepted April 7, 2017
Revised (1st April 3, 2017, 2nd April 6, 2017) Published April 30, 2017
1. Introduction
In Korean society, desire for healthy life and healthcare is rising now than ever with the aged population interested in the value of well-being. Recently, a groundbreaking paradigm change has occurred in the field of healthcare due to the eye-opening enhancement of information technology [1]. In the past traditional healthcare structure in which consumers should visit a certain medical facilities and request some services, crucial requirements within the medical industries were focused on health care service providers rather than on the consumers. However, the transference of the developed information technology into the medical industries has enabled diversification of methods for health care service provision to maximize the convenience and mobility of the health care services at large, and, hence, it is now possible for consumers to select and use diversified health care services on their own. Consequently, the center of the health care industries has been moved from the health care service providers to the consumers [1,3]. It is thus important in such current varying health care environments to clarify and satisfy the consumers’ needs.
One of the greatest issues in the information technology business is mobile devices, i.e., smartphones, an issue is related to health care promotion and medical service provision using smartphones [4-6]. Major counturies including Korea already has been driving policies supporting mobile health care and trying to help such business to grow as a core field. Thus, America is promoting investment and enterprise creation in the realm of health care by officially approving mobile health care systems which include ‘the U-Health Advancement Plan’, ‘the Health IT Plan’ etc, and China is supporting health industries focused on telemedicine as a core field driving ‘the digital health growing plan’, ‘the wireless cardiac health program’
etc. Korea is aggressively supporting ICT convergence industries in terms of ‘the quick administration and temporary license systems’ and ‘the ICT convergence
quality certification system’ [7-9].
The driving force for such development in mobile healthcare industries seems to include increased numbers of smartphone users on the side of demand and of samrtphones healthcare applications (SHAs) on the side of supply [10,11].
However, even though the size of the healthcare market with such SHAs is rapidly growing, research on medicine-related applications remains in its early stage [12]. As most work in this field has been conducted on the side of technology acceptance, it is difficult to find studies, domestic and abroad, that identify and reflect consumers’ desire.
A mobile healthcare application is not just a technical but also a health-promotion product. It is thus undesirable to verify it on the side of technology acceptance. Healthcare consumers’ various needs should be clarified and satisfied for the market for healthcare application services via smartphones to extend and grow.
It has been already identified in various advanced studies that smartphone user’s characteristics, such as gender, economic level, illness, smartphone usage and interest, are associated with SHA use [13-15].
Therefore, this study aims to make systematic division among smartphone users’ general characteristics, such as gender, age, and final educational level, health-related characteristics, such as current disease and exercise, smartphone-related characteristics, such as use duration, chiefly used functions, and level of satisfaction, and application-related characteristics, such as usage frequencies, interest status, and satisfaction.
By doing so, this paper identifies the influence of these above characteristics on the user’s SHA use intention.
It is expected that this study will help to better understand why it is important to segment consumers’
needs and reflect them when developing SHAs. Also, it will serve as a good basis in developing application contents to provide effective healthcare services.
2. Methods
2.1 Study Design and Participants
This was a descriptive survey to determine various factors influencing users’ SHA use intention. The participants included adults in their 20s~70s using smartphones among others who attended three churches in W City, Korea. They understood the goals and purposes and agreed to participate.
The number of participants necessary was estimated using G*Power 3.1.5. With 24 being the number for predictive factors, 0.05 the significance level, 0.15 the effect size, and 0.95 the power, the number of participants necessary for multiple regression was estimated to be 238 [16]. Thus, this study tried to distribute and collect copies of the questionnaire among 300 participants, with 50 in each age group from 20s to 70s. Finally, only 285 copies were used for analysis; 15 incomplete copies were excluded.
2.2 Ethical Consideration
This study was conducted after receiving approval from the institutional review board (IRB no.
1041231-150216-HR-025-02). After giving information about the purpose of study, guarantees for anonymity and credibility, voluntary participation and rewards to participate in the study, written informed consents were obtained from all participants who agreed to engage in the study.
2.3 Measurements
To measure the participants’ SHA use intention, we modified and used Wang’s [17] measurement tool—3 questions measuring users’ intention to use travel applications on a 5-point Likert scale. Higher average scores indicate higher SHA acceptance intention. The reliability of the tool in this study (Cronbach’s α) was .92.
This study investigated participants’ general characteristics—gender, age, final educational and economic level, and job status—and health-related
characteristics—current illness, exercise, diet and stress management, hygiene, health-promoting behavior including rest and sleep, and professional health management. Health-promoting behavior, among others, was measured using Kim’s [18] measurement tool with 27 questions on a 5-point Likert scale. Higher average scores indicate higher health-promoting behavior. The reliability of the tool in this study (Cronbach’s α) was .71, .77, .66, .65, .68, and .71 for exercising, dietary management, stress management, personal hygiene, rest and sleep, and professional health management, respectively.
For smartphone-related characteristics including total use duration, average time of daily use, and chiefly used functions, we used 3 questions each about manipulation, connection, and system quality satisfaction, modifying Wang’s [17] satisfaction measurement tool for mobile phone usage. The modified tool uses a 5-point Likert scale. Higher average scores indicate higher manipulation, connection, and system quality satisfaction. The reliability (Cronbach’s α) was .88, .91, and .84 for manipulation satisfaction, connection satisfaction, and system quality satisfaction, respectively.
As for application-related characteristics including number of SHA installations, weekly usage frequencies, and interest status, we used 3 questions each about awareness, information, and availability satisfaction, modifying Wang’s [17] satisfaction measurement tool for satisfaction with travel applications. The modified tool uses a 5-point Likert scale, and higher average scores indicate higher awareness, information, and availability satisfaction. The reliability (Cronbach’s α) was .92, .87, and .94 for awareness, information, and availability satisfaction, respectively.
Wang’s measurement tool [17] was modified and employed to serve the purpose of this study. For the validity of the measurement tool, the study conducted a survey after being reviewed the validity of the modified tool by four nursing informatics professors, who had studied similar topics.
2.4 Data Collection and Analysis
Data were collected using a self-administered questionnaire from April 10 to 30, 2015. To prevent participation in research by authoritative force, data were collected through the following procedure. Before data collection, consent and cooperation for participation were sought from the responsible chief of each church. Then, a list of believers willing to participate and their contact information were obtained through the responsible chief, and the researcher called each believer on the list; explained the research purposes, confidentiality and anonymity of data, compensation for participation, and so on; and provided the date, time, and place of data collection. At the appointed date and time and in the designated place, those who decided to participate completed the form of consent for voluntary participation and answered the structured questionnaire, put them in an unmarked envelope, sealed it, and submitted it to the researcher before receiving a gift.
Collected data were analyzed using IBM PASW/WIN Version 20.0 through two-tailed tests at significance level p < .05. The analysis contents were participant characteristics, and SHA use intention was analyzed using frequencies, percentages, means, and standard deviations. The difference in SHA use intentions among users due to their characteristics, such as age, final educational and economic levels, was identified through independent t-test and one-way ANOVA, and Scheffe test was conducted as a post-hoc test. In addition, the study identified the correlation between users’ SHA use intentions and their characteristics, such as exercise practice, manipulation, connection, and system quality satisfaction through Pearson’s correlation coefficient. Lastly, the pure effects of participants’ characteristics on SHA use intention were assessed through hierarchical multiple regression.
3. Results
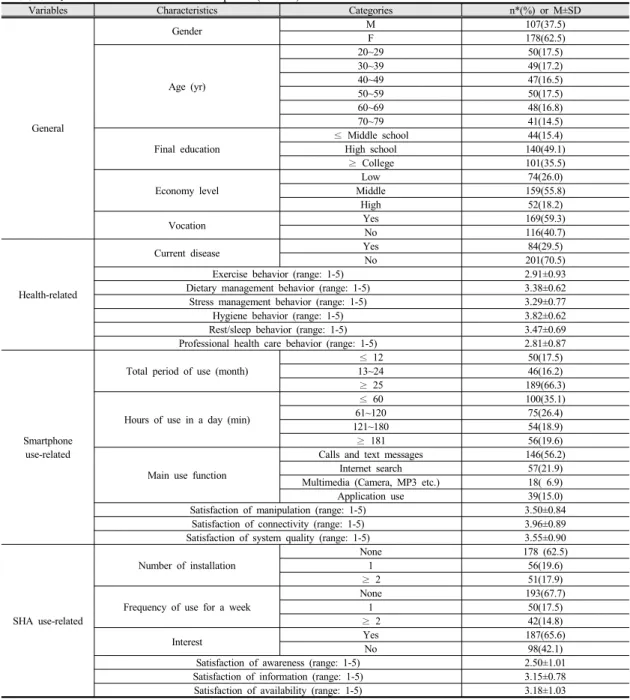
3.1 Participant CharacteristicsFor general factors, 62.5% of the participants were female; 17.5% were in their 20s, 17.2% in their 30s, 16.5% in their 40s, 17.5% in their 50s, 16.8% in their 60s, and 14.5% in their 70s (71~80); 49.1% had high school or higher educational experiences; 55.8% belonged to the middle class; and 59.3% had a vocation.
With respect to health-related factors, 29.5% of the participants currently had an illness. As for health-promotion behaviors, based on a scale from 1 to 5, the average scores were 2.91, 3.38, 3.29, 3.82, 3.47, and 2.81 for exercise, dietary, stress management, hygiene behavior, rest and sleep, and professional health management behaviors, respectively.
When it comes to factors related to smartphone use, as for the total duration of smartphone use, 66.3% of the participants had been using smartphones for 25 or more months, and, as for the time of daily use, 35.1%
occupied the majority using their smartphones for 60 or fewer minutes a day. As for mainly used functions, 56.2% occupied the majority using their smartphone for calling and texting, and 6.9%, the smallest percentage, used theirs for multimedia functions including camera functions, MP3 playing, and so on. As for satisfaction with smartphones with respect to mobile usage, based on a scale from 1 to 5, the average scores were 3.50, 3.96, and 3.55 for manipulation, connection, and system quality satisfaction,respectively .
As for factors related to SHAs, 62.5% comprised the majority having no SHAs installed, and 67.7% used no SHAs during the week before the survey. 65.6% were interested in SHAs. In the case of satisfaction with SHAs, based on a scale from 1 to 5, the average scores were 2.50, 3.15, and 3.18 for awareness, information, and availability satisfaction, respectively (Table 1).
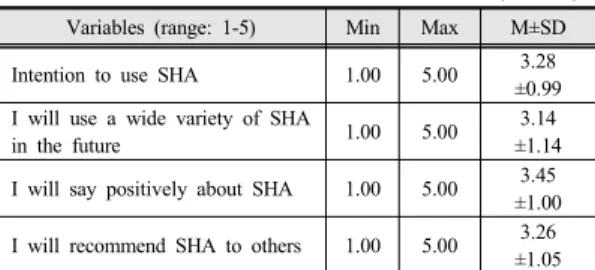
3.2 Level of intention to use healthcare application
Based on a scale from 1 to 5, the average score for participants’ SHA acceptance intention was 3.28. As for details, the average score was 3.14 for “I will use various SHAs in future,” 3.45 for “I will make positive
Table 1. Characteristics of the Participants (N=285)
Variables Characteristics Categories n*(%) or M±SD
General
Gender M 107(37.5)
F 178(62.5)
Age (yr)
20~29 50(17.5)
30~39 49(17.2)
40~49 47(16.5)
50~59 50(17.5)
60~69 48(16.8)
70~79 41(14.5)
Final education
≤ Middle school 44(15.4)
High school 140(49.1)
≥ College 101(35.5)
Economy level
Low 74(26.0)
Middle 159(55.8)
High 52(18.2)
Vocation Yes 169(59.3)
No 116(40.7)
Health-related
Current disease Yes 84(29.5)
No 201(70.5)
Exercise behavior (range: 1-5) 2.91±0.93
Dietary management behavior (range: 1-5) 3.38±0.62
Stress management behavior (range: 1-5) 3.29±0.77
Hygiene behavior (range: 1-5) 3.82±0.62
Rest/sleep behavior (range: 1-5) 3.47±0.69
Professional health care behavior (range: 1-5) 2.81±0.87
Smartphone use-related
Total period of use (month)
≤ 12 50(17.5)
13~24 46(16.2)
≥ 25 189(66.3)
Hours of use in a day (min)
≤ 60 100(35.1)
61~120 75(26.4)
121~180 54(18.9)
≥ 181 56(19.6)
Main use function
Calls and text messages 146(56.2)
Internet search 57(21.9)
Multimedia (Camera, MP3 etc.) 18( 6.9)
Application use 39(15.0)
Satisfaction of manipulation (range: 1-5) 3.50±0.84
Satisfaction of connectivity (range: 1-5) 3.96±0.89
Satisfaction of system quality (range: 1-5) 3.55±0.90
SHA use-related
Number of installation
None 178 (62.5)
1 56(19.6)
≥ 2 51(17.9)
Frequency of use for a week
None 193(67.7)
1 50(17.5)
≥ 2 42(14.8)
Interest Yes 187(65.6)
No 98(42.1)
Satisfaction of awareness (range: 1-5) 2.50±1.01
Satisfaction of information (range: 1-5) 3.15±0.78
Satisfaction of availability (range: 1-5) 3.18±1.03
*Missing responses excluded; SHA=Smartphone healthcare applications
remarks on SHAs,” and 3.26 for “I will recommend SHAs to others” (Table 2).
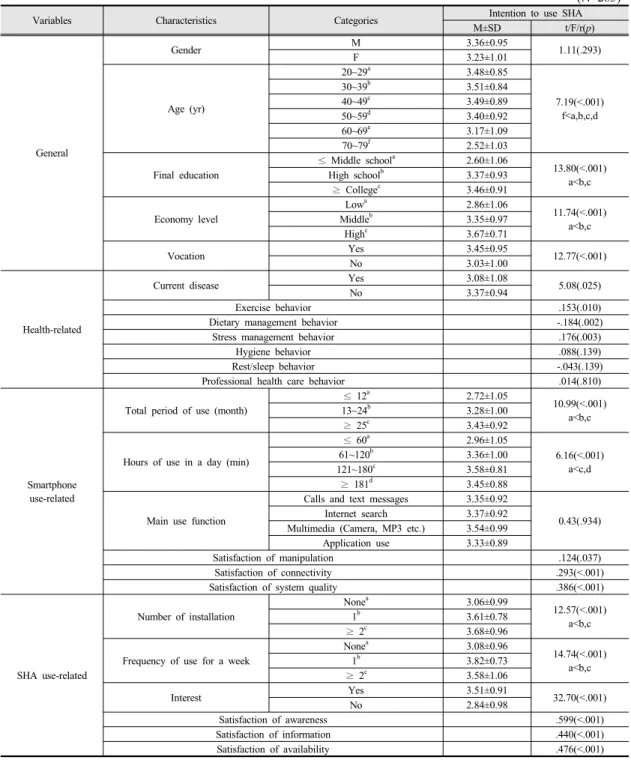
3.3 Difference and correlation of intention to use healthcare application by participants' characteristics
There were no differences in participants’ use intention with respect to gender among other general factors (t=1.11, p=.293). There were, however, significant differences with respect to age (F=7.19, p<.001), final education (F=13.80, p<.001), economic level (F=11.74, p<.001), and vocation (t=12.77, p<.001). As a result of the post-hoc test in particular,
Table 2. Level of Intention to Use SHA (N=285)
Variables (range: 1-5) Min Max M±SD
Intention to use SHA 1.00 5.00 3.28
±0.99 I will use a wide variety of SHA
in the future 1.00 5.00 3.14
±1.14 I will say positively about SHA 1.00 5.00 3.45
±1.00 I will recommend SHA to others 1.00 5.00 3.26
±1.05 SHA=Smartphone healthcare applications
those participants aged 70 or more (2.52), those with middle school or lower educational experiences (2.60), and those in the low economic level (2.86) showed a significantly low score.
Regarding the relation between health-related factors and SHA use intention, there were differences in SHA use intention regarding current illness (t=5.08, p=.025), and the group without current illness showed a high score of 3.37. Furthermore, exercise behavior (r=.153, p=.010) and stress management behavior (r=.176, p=.003), among other health-promotion behaviors, related positively to SHA use intention, and dietary management behavior related negatively (r=-.184, p=.002). However, hygiene behavior, rest and sleep, and professional health management behaviors did not show any statistically significant correlation with SHA use intention.
There were no statistically differences in SHA use intention regarding mainly used functions among other smartphone-related factors (F=0.43, p=.934). However, there were significant differences with respect to total duration of use (F=10.99, p<.001) and time for daily use (F=6.16, p<.001). As a result of the post-hoc test in particular, those who used smartphones not more than 12 months (2.72) and not more than 60 minutes a day (2.96) showed a significantly low score. On the other hand, satisfaction with mobile phone use including manipulation (r=.124, p=.037), connection (r=.293, p<.001), and system quality satisfaction (r=.386, p<.001) showed statistically meaningful positive correlations with SHA use intention.
The participants showed significant differences in their SHA use intention with respect to the
SHA-related factors including number of installed SHAs (F=12.57, p<.001), frequencies of week-based use (F=14.74, p<.001), and interest status (t=32.70, p<.001). Those who did not install SHAs (3.06) and those who never used SHAs (3.08) showed a significantly low score in the post-hoc test in particular. On the other hand, the SHA satisfactions including awareness (r=.599, p<.001), information (r=.440, p<.001), and availability satisfaction (r=.476, p<.001) showed statistically significant positive correlations with SHA use intention (Table 3).
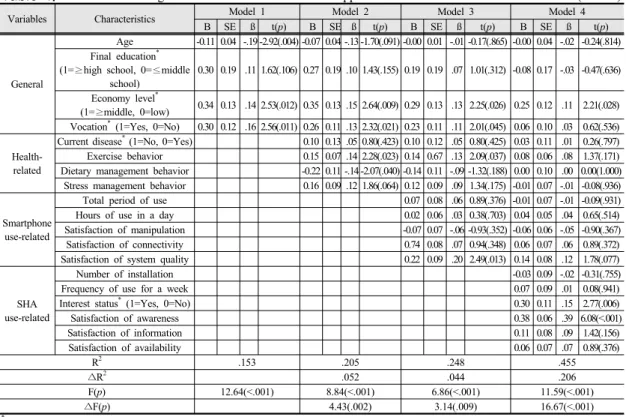
3.4 Factors influencing intention to use healthcare applications
The general factors in model 1, such as ages, final education, economic level, and vocation, accounted for 15.1% of SHA use intention (F=12.64, p<.001). As model 2, to which current illness, exercise behavior, dietary behavior, and stress management behavior had been added, accounted for 20.5% of SHA use intention (F=8.84, p<.001), it was confirmed that health-related factors additionally accounted for 5.2% of the intention. As model 3, to which total duration of using smartphones, time for daily use, manipulation satisfaction, connection satisfaction, and system quality satisfaction had been added, accounted for 24.8% of SHA use intention (F=6.86, p<.001), it was confirmed that smartphone-related factors additionally accounted for 4.4% of the intention. Furthermore, as model 4, to which the number of installed SHAs, frequencies of week-based use, interest status, awareness satisfaction, information satisfaction, and availability satisfaction had been added, accounted for 45.5% of SHA use intention (F=11.59, p<.001), it was confirmed that SHA use-related factors additionally accounted for 20.6% of the intention.
As for variables influencing SHA use intention with reference to model 4, the economy level (t=2.21, p=.028), interest status (t=2.77, p=.006), and SHA awareness satisfaction (t=6.08, p<.001) was represented by statistically significant variables (Table6 4).
Table 3. Differences and Correlation of Intention to Use Health Care Application by Participants’ Characteristics (N=285)
Variables Characteristics Categories Intention to use SHA
M±SD t/F/r(p)
General
Gender M 3.36±0.95
1.11(.293)
F 3.23±1.01
Age (yr)
20~29a 3.48±0.85
7.19(<.001) f<a,b,c,d
30~39b 3.51±0.84
40~49c 3.49±0.89
50~59d 3.40±0.92
60~69e 3.17±1.09
70~79f 2.52±1.03
Final education
≤ Middle schoola 2.60±1.06
13.80(<.001) a<b,c
High schoolb 3.37±0.93
≥ Collegec 3.46±0.91
Economy level
Lowa 2.86±1.06
11.74(<.001) a<b,c
Middleb 3.35±0.97
Highc 3.67±0.71
Vocation Yes 3.45±0.95
12.77(<.001)
No 3.03±1.00
Health-related
Current disease Yes 3.08±1.08
5.08(.025)
No 3.37±0.94
Exercise behavior .153(.010)
Dietary management behavior -.184(.002)
Stress management behavior .176(.003)
Hygiene behavior .088(.139)
Rest/sleep behavior -.043(.139)
Professional health care behavior .014(.810)
Smartphone use-related
Total period of use (month)
≤ 12a 2.72±1.05
10.99(<.001) a<b,c
13~24b 3.28±1.00
≥ 25c 3.43±0.92
Hours of use in a day (min)
≤ 60a 2.96±1.05
6.16(<.001) a<c,d
61~120b 3.36±1.00
121~180c 3.58±0.81
≥ 181d 3.45±0.88
Main use function
Calls and text messages 3.35±0.92
0.43(.934)
Internet search 3.37±0.92
Multimedia (Camera, MP3 etc.) 3.54±0.99
Application use 3.33±0.89
Satisfaction of manipulation .124(.037)
Satisfaction of connectivity .293(<.001)
Satisfaction of system quality .386(<.001)
SHA use-related
Number of installation
Nonea 3.06±0.99
12.57(<.001) a<b,c
1b 3.61±0.78
≥ 2c 3.68±0.96
Frequency of use for a week
Nonea 3.08±0.96
14.74(<.001) a<b,c
1b 3.82±0.73
≥ 2c 3.58±1.06
Interest Yes 3.51±0.91
32.70(<.001)
No 2.84±0.98
Satisfaction of awareness .599(<.001)
Satisfaction of information .440(<.001)
Satisfaction of availability .476(<.001)
SHA=Smartphone healthcare applications
Before the data analysis, this study tested the regression hypothesis about independent variables in terms of multicolineality, error terms, and outliers. As
a results, the variance inflaction factors were 1.20~2.70, which are under 10, the Durbin-Watson statistic was 1.96, which are very close to the reference
Table 4. Factors Influencing Intention to Use Health Care Application (N=285)
Variables Characteristics Model 1 Model 2 Model 3 Model 4
B SE ß t(p) B SE ß t(p) B SE ß t(p) B SE ß t(p)
General
Age -0.11 0.04 -.19 -2.92(.004) -0.07 0.04 -.13 -1.70(.091) -0.00 0.01 -.01 -0.17(.865) -0.00 0.04 -.02 -0.24(.814) Final education*
(1=≥high school, 0=≤middle school)
0.30 0.19 .11 1.62(.106) 0.27 0.19 .10 1.43(.155) 0.19 0.19 .07 1.01(.312) -0.08 0.17 -.03 -0.47(.636)
Economy level*
(1=≥middle, 0=low) 0.34 0.13 .14 2.53(.012) 0.35 0.13 .15 2.64(.009) 0.29 0.13 .13 2.25(.026) 0.25 0.12 .11 2.21(.028) Vocation* (1=Yes, 0=No) 0.30 0.12 .16 2.56(.011) 0.26 0.11 .13 2.32(.021) 0.23 0.11 .11 2.01(.045) 0.06 0.10 .03 0.62(.536)
Health- related
Current disease* (1=No, 0=Yes) 0.10 0.13 .05 0.80(.423) 0.10 0.12 .05 0.80(.425) 0.03 0.11 .01 0.26(.797) Exercise behavior 0.15 0.07 .14 2.28(.023) 0.14 0.67 .13 2.09(.037) 0.08 0.06 .08 1.37(.171) Dietary management behavior -0.22 0.11 -.14 -2.07(.040) -0.14 0.11 -.09 -1.32(.188) 0.00 0.10 .00 0.00(1.000) Stress management behavior 0.16 0.09 .12 1.86(.064) 0.12 0.09 .09 1.34(.175) -0.01 0.07 -.01 -0.08(.936)
Smartphone use-related
Total period of use 0.07 0.08 .06 0.89(.376) -0.01 0.07 -.01 -0.09(.931)
Hours of use in a day 0.02 0.06 .03 0.38(.703) 0.04 0.05 .04 0.65(.514)
Satisfaction of manipulation -0.07 0.07 -.06 -0.93(.352) -0.06 0.06 -.05 -0.90(.367)
Satisfaction of connectivity 0.74 0.08 .07 0.94(.348) 0.06 0.07 .06 0.89(.372)
Satisfaction of system quality 0.22 0.09 .20 2.49(.013) 0.14 0.08 .12 1.78(.077)
SHA use-related
Number of installation -0.03 0.09 -.02 -0.31(.755)
Frequency of use for a week 0.07 0.09 .01 0.08(.941)
Interest status* (1=Yes, 0=No) 0.30 0.11 .15 2.77(.006)
Satisfaction of awareness 0.38 0.06 .39 6.08(<.001)
Satisfaction of information 0.11 0.08 .09 1.42(.156)
Satisfaction of availability 0.06 0.07 .07 0.89(.376)
R2 .153 .205 .248 .455
∆R2 .052 .044 .206
F(p) 12.64(<.001) 8.84(<.001) 6.86(<.001) 11.59(<.001)
∆F(p) 4.43(.002) 3.14(.009) 16.67(<.001)
*dummy variable; SHA=Smartphonehealthcareapplication
value 2, and maximal Cook’s Distance was 0.04, which dose not exceed 1.0. Thus, as the basic hypothesis of the regression formula is met, the results in Table 4 are reliable.
4. Discussion
This study was conducted to identify various characteristics of smartphone users in relation to their SHA use intentions, and by doing so, to provide a basis for developing strategies of healthcare applications.
The score of the subjects’ intention to SHAs was 3.28 on the 5-point scale, which exceeds the middle point. The results support the previous studies[1,15,19]
showing that there is a growing need among smartphone users for a health management function apart from the existing functions as they are more interested in health and wellbeing. As for specific clauses about SHA acceptance intention, the average
score for the clause ‘I will say positively about SHA’
was the highest (3.45), and the average score for the clause ‘I will use a wide variety of SHAs in the future’
the lowest (3.14). From this we can conjecture that the subjects were satisfied with the SHAs they currently used but felt it difficult to learn and accept various and numerous SHAs for their healthcare. For popularizing and extending SHA services, therefore, it will be helpful to make developmental strategies that can lead users to long term use by increasing convenience and effectiveness for them rather than to make quantitative development strategies for SHAs.
The statistically meaningful differences in SHA acceptance intention with respect to general characteristics were as follows. Regarding ages, thosein their 20s, 30s, and 40s showed higher scores for SHA acceptance intention, but those in their 70s lower scores. As for educational levels, those with college or higher educational experiences got higher scores while those with middle school or lower educational
experiences showed lower scores. The advanced studies [13,14] showed that those with younger age and higher educational levels tended to use SHAs more just as described in this study. The results tell us that older people with lower educational levels are afraid of accepting complex functions of smartphones in addition to their main functions including voice calling, internet browsing, information search etc., which they regard as inappropriate. Also, in this study, it has been found out that the intention to accept SHAs was higher in both those in higher economic levels and those with vocations, while it was lower in those in lower economic levels and those with no vocations. The papers, including the one written by Krebs[15], showed that those with higher incomes had a high tendency of using SHAs. In general, educational levels, occupations, and economic levels have close correlations with each other, and hence people with lower educational experiences tend to have no job and live in lower economic levels in many cases [20]. Thus, we can assume that the results above have appeared as people with lower educational experiences and no vocation tend to be negatively aware of the additional and complex functions as well as their economic burden for SHA acceptance. In order to popularize SHAs, it is helpful to take a strategy that can enable easy and free installation and extension of SHAs and allow people to easily use functions they want.
As for differences in SHA acceptance intention with respect to health related characteristics, those participants without current illness showed higher scores than those with. This result is contrary to Kim’s [1] work, in which subjects at older ages and with chronic diseases showed higher intention to accept healthcare mobile devices than common people who were interested in maintaining good health. Such a result from this study seems to be due to the fact that the subjects participating in the survey led healthful daily lives without concern with their illness as the data collection was carried out in churches. Some subsequent work is necessary for this matter. In this
study, more intense exercise and higher stress management practice were seen to be related with higher SHA acceptance intention. The results are estimated to imply those who have participated in healthful activities with interest try healthcare management using smartphones with a high expectation on it. Thus, efforts should be made to develop quality contents that can be used in actual life by those who are highly interested in their health and willing to practice healthcare. In this study, those engaging in higher dietary management practice showed lower SHA acceptance intention, and hygiene, rest/sleep, and professional health care practice had no statistically significant correlations with SHA acceptance intention.
We can conjecture that this result is due to misbelief in applications related to dietary management and lack of the development of applications related to hygiene, rest/sleep, and professional health care practice. Some additional work seems necessary for this issue.
As for differences in SHA acceptance intention related to smartphone use, those participants using their smartphones for 12 or less months had lower scores for SHA acceptance intention. The scores were lower in those who used their smartphone for 1 or less hour a day. Also, those with higher satisfaction with the manipulation, connection, and system quality of their smartphones had higher intention to accept SHAs. As people use smartphones longer in their daily life, they tend to use various applications more [1,15,21].
Therefore, the results of this paper showed that those using smartphones for a longer hour had more positive attitude on using various applications, and ultimately had more intention to accept and maintain them. In order to promote users’ satisfaction and make them keep using SHAs, therefore, efforts should be made to develop operating contents that can create fun and interest in smartphone use as well as healthcare contents in SHA development.
Lastly, as for differences in SHA acceptance intention regarding characteristics related to SHA use, SHA acceptance intention went up as more SHAs were
installed and usage frequencies per week went up.
Also, the group with a high interest in SHAs had a significantly high SHA acceptance intention. In addition, it was reported that those subjects who had higher satisfaction with the awareness, information, and availability had higher acceptance intention. As a result from the regression analysis in this study, it has been confirmed that SHA-use related characteristics had the highest explanatory power (20.6%) about SHA acceptance intention. Especially, interest status and awareness satisfaction, including an economic level, were serving as the strongest predictive factor of SHA acceptance intention. And, SHA acceptance intention went higher as an economic level and interest in SHAs went up. Such results give an important implication that in order to popularize SHAs and expand their market size, it is imperative to develop various marketing strategies, which can raise interest and awareness of the public on the developed SHAs, apart from developing contents reflecting a need for low cost.
In this study, we have found out various factors that have influence on SHA acceptance intention. Currently, SHAs attract attention as a core industry in the next generation. In order to never fail SHAs to enter the healthcare service market, and to stably extend and activate the SHA market, quality developmental strategies focusing on increasing cost accessibility and usage convenience and developing professional health and medical contents rather than quantity developmental strategies. Also, various marketing strategies for operation and extension should be made as well as program development, and political and systematic supporting measures are necessary.
5. Conclusion
In this study, it has been confirmed that SHA use-related characteristics are the greatest factors accounting for SHA acceptance intention. In particular, it has been seen that awareness satisfaction with SHAs work as the strongest predictive factors. Thus, this
study proposes that various marketing strategies that can help users have higher interest and satisfaction as well as strategies for the development of professional health and medical contents be made as a method to increase smartphone users’ intention to accept SHAs and hence to extend and activate the SHA market.
References
[1] Y. J. Kim, “Exploratory study on acceptance intention of mobile devices and applications for healthcare services”, Journal of Contents Association, vol. 12, no. 9, pp.
369-379, 2012.
DOI: http://dx.doi.org/10.5392/JKCA.2012.12.09.369 [2] B. Chaudhry, J. Wang, S. Wu, M. Maglione, W. Mojica,
E. Roth, S. C. Morton, P. G. Shekelle, “Systematic review: impact of health information technology on quality, efficiency, and costs of medical care”, Annals of Internal Medicine, vol. 144, no. 10, pp. 742-752, 2006.
DOI:Ohttp://doi.org/10.7326/0003-4819-144-10-200605160-00125 [3] P. Chau, P. Hu, “Investigating healthcare professionals’
decisions to accept telemedicine technology: an empirical test of competing theories” Information &
Management, vol. 39, no. 4, pp:297-311. 2002.
DOI: http://dx.doi.org/10.1016/S0378-7206(01)00098-2 [4] C. Free, G. Phillips, L. Watson, L. Galli, L. Felix, P.
Edwards, V. Patel, A. Haines, “The effectiveness of mobile-health technologies to improve health care service delivery processes: a systematic review and meta-analysis”, PLoS Medicine, vol. 10, no. 1, e1001363, 2013;.
DOI: http://dx.doi.org/10.1371/journal.pmed.1001363 [5] Z. Zheng, “User acceptance of mobile healthcare
applications: an integrated model of UTAUT and HBM theory”, Korean Policy Sciences Review, vol. 19. no. 3.
pp. 203-236, 2015.
[6] L. Dennison, L. Morrison, G. Conway, L. Yardley,
“Opportunities and challenges for smartphone applications in supporting health behavior change:
qualitative study”, Journal of Medical Internet Research, vol. 15, no. 4, e86, 2013.
DOI: https://doi.org/10.2196/jmir.2583
[7] The Office of the National Coordinator for Health Information Technology (ONC) [Internet]. Federal Health IT Strategic Plan 2015-2020 [cited at 2016 Mar 3], Available from:
https://www.healthit.gov/sites/default/files/9-5-federalheal thitstratplanfinal_0.pdf.
[8] J, Sun, Y. Guo, X. Wang, Q. Zeng, “mHealth for aging china: opportunities and challenges”, Aging and Disease, vol. 7, no. 1, pp. 53067, 2006.
DOI: https://doi.org/10.14336/AD.2015.1011
[9] Jeong HY. Advances in Computer Science and its Applications. p.1241-1249, Springer, 2014.
DOI: https://doi.org/10.1007/978-3-642-41674-3
[10] Apple Press Info [Internet]. iPhone App Store Downloads Top 10 Million in First Weekend [cited at 2016 Mar 3], Available from:
http://www.apple.com/pr/library/2008/07/14iPhone-App- Store-Downloads-Top-10-Million-in-First-Weekend.html.
[11] Research 2 Guidance [Internet]. mHealth App Developer Economics 2015 [cited at 2016 Mar 3], Available from:
http://research2guidance.com/r2g/r2g-mHealth-App-Deve loper-Economics-2015.pdf
[12] K. Huckvale, S. Adomaviciute, J. T. Prieto, M. K. S.
Leow, J. Car. “Smartphone apps for calculating insulin dose: a systematic assessment”, BMC Medicine, vol. 13, no. 1, p.106, 2015.
DOI: https://doi.org/10.1186/s12916-015-0314-7 [13] A. Bianchi, J. G. Phillips, “Psychological predictors of
problem mobile phone use”, Cyber psychology &
Behavior, Vo;.8, no. 1, pp. 39~51, 2005.
DOI: https://doi.org/10.1089/cpb.2005.8.39
[14] A. Van Deursen, C. L. Bolle, S. M. Hegner, P.
Kommers, “Modeling habitual and addictive smartphone behavior: The role of smartphone usage types, emotional intelligence, social stress, self-regulation, age, and gender”, Computers in Human Behavior, vol. 45, pp.
411-420, 2015.
DOI: https://doi.org/10.1016/j.chb.2014.12.039
[15] P. Krebs, D. T. Duncan. “Health app use among US mobile phone owners: a national survey”, JMIR Mhealth Uhealth, vol. 3, no. 4, e101, 2015.
DOI: https://doi.org/10.2196/mhealth.4924
[16] F. Faul, E. Erdfelder, A. G. Lang., A. Buchner,
“G*Power 3: A flexible statistical power analysis program for the social, behavior, and biomedical sciences”, Behavior Research Methods , vol. 39, no. 2, pp. 175-191, 2007.
DOI: https://doi.org/10.3758/BF03193146
[17] Y. Wang, “A study on the influencing factors of intention to use of smart phone applications”, Unpublished master’s thesis, Chungbuk University, Cheongju, Korea, 2013.
[18] J. H. Kim, “A study on factors relation to health promotion behavior in college students”, Unpublished doctoral dissertation, Inje University, Kimhae, Korea, 2007.
[19] B. C. Zapata, J. L. Fernández-Alemán, A. Idri, A. Toval,
“Empirical studies on usability of mHealth apps: a systematic literature review. Journal of Medical System.
vol. 39, no. 2, p.1, 2015.
DOI: https://doi.org/10.1007/s10916-014-0182-2 [20] H. Yoo, H. Y. Han, H. M. Oh, M. J. Park, “The effects
of family communication and family cohesion on elderly women's depression and quality of life” Journal of the Korean Data Analysis Society, vol. 17, no. 1, pp.
469-483, 2015.
[21] Y. U. Chang, Y. S. Jung, “An empirical study on a use-diffusion model of medical service consumer's web based application usage”, Management & Information Systems Review, vol. 32, no. 5, pp. 19-43, 2013.
박 미 정(Mijeong Park) [정회원]
•2007년 8월 : 연세대학교 일반대학 원 간호학과 (간호학석사)
•2013년 2월 : 연세대학교 일반대학 원 간호학과 (간호학박사)
•2013년 3월 ~ 현재 : 호서대학교 생명보건과학대학 간호학과 조교수
<관심분야>
근골격계 건강, 운동유지, 의료정보, 교육방법