The nuclear magnetic resonance of the 75As nucleus in a RbH2AsO4 Single Crystal was in- vestigated using a Fourier-transform nuclear magnetic resonance (FT-NMR) spectrometer. The linewidths of the75As nuclei decreased with increasing temperature, and the temperature depen- dence of the chemical shift of the75As NMR spectrum was obtained as a function of temperature.
The spin-lattice relaxation times T1 of the75As nucleus were calculated in the experimental tem- perature range from 180 K to 430 K. The value of T1for75As nuclei was found to decrease linearly as the temperature was increased. Thus, the relaxation mechanism for75As in RbH2AsO4 single crystals can be concluded to be the direct process of single-phonon scattering. The activation energy for75As nuclei was found to be 6.34 meV.
PACS numbers: 76.60.-k
Keywords: RbH2AsO4crystal, NMR, Spin-lattice relaxation time, Activation energy
I. INTRODUCTION
Solid-state electrolytes are preferred over liquid elec- trolytes in general for electrochemistry applications- sen- sors, batteries, and fuel cells. MH2RO4(M = K, Rb, Cs, NH4; R = P, As) compounds have been used in the applications of fuel cell because the compounds have a superionic phase transition at high temperature [1–5].
Rubidium dihydrogen arsenates RbH2AsO4, one of the MH2RO4 compounds, are typical ferroelectrics with hy- drogen bonds and used in many optical devices. Optical properties of several materials of MH2RO4 compounds have been studied [6]. In the previous report, the energy bands in the low energy region have been interpreted on the ground of molecular orbitals (AsO4)3− ions and the multiplet structures in the high energy region are ascribed to the transitions related to the Rb+ ions [7].
RbH2AsO4is isomorphous with KH2PO4, which crys- talizes with four “molecules” per unit cell. RbH2AsO4
has a phase transition at 110 K from a low tempera- ture ferroelectric phase to a high temperature paraelec- tric phase. RbH2AsO4 single crystal has a tetragonal
∗E-mail: [email protected]
structure (space group I42d) in the paraelectric phase and an orthorhombic structure (space group Fdd2) in the ferroelectric phases [8]. The As atoms in (AsO4)3− ion are tetrahedrally surrounded by 4 oxygens. There are two Rb+ sites per unit cell in the ferroelectric phase [9].
The lattice constants of the RbH2AsO4 single crystal are a = 0.779 nm, c = 0.747 nm, and c/a = 0.958. There are two Rb+ sites per unit cell. The symmetry of the Rb+ sites in the paraelectric phase is S4 and that in the ferroelectric phase is C2. Each Rb+ ion has eight neigh- bouring protons. The As5+ ions are at the center of the O2−tetrahedral [8,10–14]. The soft phonon behaviors in Raman spectroscopic measurements for RbH2AsO4 also shows a Curie temperature of 110.1 K [15].
In RbH2AsO4salt the ferroelcectric transitions are as- sociated with the ordering of hydrogens in the O-H–O hy- drogen bonds. Each AsO4group is bonded to four AsO4
groups by four O-H–O hydrogen bonds which lie approx- imately parallel to the crystal ab-plane. Above the phase transition temperature Tc in the tetragonal paraelectric phase within each hydrogen bond the hydrogen moves between two equivalent equilibrium positions: O-H–O
This is an Open Access article distributed under the terms of the Creative Commons Attribution Non-Commercial License (http://creativecommons.org/licenses/by-nc/3.0) which permits unrestricted non-commercial use, distribution, and reproduction in any medium, provided the original work is properly cited.
Fig. 1. (Color online) Inversion recovery trace for 75As nuclei in RbH2AsO4 single crystal with delay time t at 300 K.
and O–H-O. At each instant of time two hydrogens out of four surrounding a AsO4 group are covalently bonded to the group whereas the other two hydrogens are hydro- gen bonded to the group [16,17].
87Rb quadrupole coupling and ferroelectric transition in RbH2AsO4 crystal was reported [18]. The phase transition of RbH2AsO4 from the spin-lattice relaxation study for 87Rb ions has also been investigated [19]. How- ever, the relaxation mechanism of As ion in RbH2AsO4
has not been studied yet. NMR (nuclear magnetic reso- nance) technique is important to investigate the micro- scopic information of nuclei in the host materials. FT (Fourier transform) NMR experiments is good for the study of dynamics of nuclei in the crystals.
In the present work, FT NMR spectra of host 75As nuclei in RbH2AsO4 single crystal were observed as a function of temperature. Chemical shifts of 75As nuclei were studied as a function of temperatures. The full width at half maximum of 75As nuclei was investigated with temperature dependence. The chemical shift of the nuclei was also measured as a function of temperature.
We have investigated the nuclear spin lattice relaxation of 75As nucleus in an RbH2AsO4 crystal in the temper- ature range of 180 K ∼ 430 K. The activation energy of
75As nuclei is obtained in the paraelectric phase. This
75As NMR study in RbH2AsO4is a new result.
Fig. 2. Typical FT NMR spectrum of 75As nucleus in RbH2AsO4single crystal at 300 K operating at ω0/2π = 68.509 MHz. Frequency shift of the spectrum is -3466.78 Hz.
II. EXPERIMENTAL ASPECTS
Pulsed NMR spectra of 75As nucleus in RbH2AsO4
single crystal were obtained with Bruker solid FT NMR spectrometer (DSX 400 MHz) in the Korea Basic Science Institute. The nuclear spin of As are 3/2. The natural abundance is 100% for75As [20]. The carrier frequency was fixed at ω0/2π = 68.509 MHz which is the Larmor frequency of 75As nucleus at the magnetic field 9.4 T.
An inversion-recovery pulse sequence, 180◦ (π) pulse - t (delay time) – 90◦ (π/2) pulse, was used and the pulse heights and widths were chosen so as to have sufficient frequency window when they are Fourier transformed to the frequency domain.
By using the inversion recovery pulse sequence [21], we excited the single resonance line in order to get the spin lattice relaxation time, T1. Temperature dependence of the T1 was measured from 180 to 430 K. The sample temperature was stabilized within± 0.5 K by the heater which was immersed in cold nitrogen gas of a liquid ni- trogen Dewar depending on the temperature range.
Fig. 1 shows the inversion recovery traces for75As nu- clei in RbH2AsO4crystal at 300 K as a function of time t. The typical FT75As NMR spectrum in a RbH2AsO4
crystal at 300 K is shown in Fig. 2. This spectrum was obtained by a FT of the free induction decay for 75As NMR. The spectrum is shifted by 3466.78 Hz from the operating frequency ω0/2π = 68.509 MHz because of the chemical shift. Only one resonance line can be excited to measure the T1, because it is impossible to excite homo- geneously all the resonance lines due to the large splitting between the lines. Then only one spectrum was detected for75As nucleus.
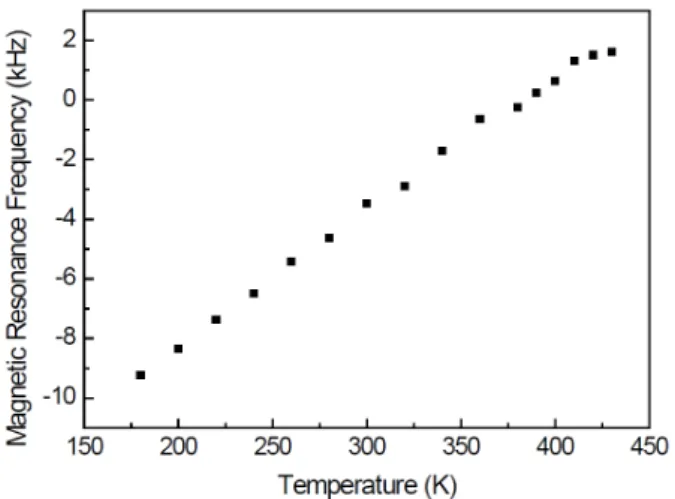
Fig. 3. Chemical shifts of76As in RbH2AsO4single crys- tal with increasing temperature. The reference frequency was set to ω0/2π = 68.509 MHz.
Fig. 4. Line width (WF W HM) of75As NMR spectra in RbH2AsO4 crystal.
III. RESULTS AND DISCUSSION
Chemical shifts of 76As in RbH2AsO4 single crystal are shown in Fig. 3 as a function of temperature. The nuclear magnetic resonance frequency is different for a
76As nucleus embedded in RbH2AsO4single crystal and for a ‘bare’ nucleus because of the diamagnetic effect of the electronic charge around 76As and polarization of the electronic shells when magnetic field 9.4 T is ap- plied. This chemical shift depends on the distribution of the electrons around the nucleus and naturally has different values in different chemical compounds. The frequency shift depends on the sample temperature and moves continuously.
The line widths, full width at half maximum, for75As nuclei in RbH2AsO4 single crystal were decreased with
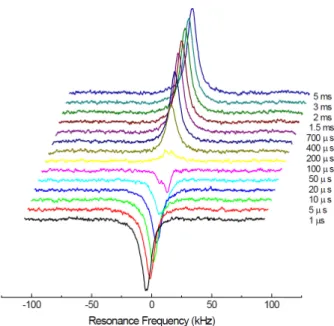
Fig. 5. (Color online) Magnetization recovery traces of
75As nuclei in RbH2AsO4crystal depends on delay time.
increasing temperature. It is usual to see motional nar- rowing of the76As nuclei NMR line width with increasing temperature. The temperature dependence of line width for 1H NMR in RbH2AsO4 of Ref. 22 is quite different from that of our75As nuclei. There are two inequivalent protons H(1) and H(2). H(1) NMR line widths above 260 K show abrupt motional narrowing, whereas H(2) NMR line widths is narrow and remains nearly constant with increasing temperature [22]. Comparing the above report of 1H NMR line width, our 75As may have no inequivalent sites in RbH2AsO4 host single crystal.
The relaxation process of nuclear magnetic moment after using a sequence of π−t−π/2 pulse in the temper- ature range 180 K∼ 430 K are obtained for RbH2AsO4
single crystal as a function of t. One of the recovery curve in RbH2AsO4 single crystal at 200 K is shown in Fig. 5. The measured magnetization recovery M was satisfactorily fitted with the single exponential function [23–25];
[M (∞)–M(t)]/2M(∞) = exp(−t/T1) , (1) where M (∞) is the equilibrium magnetization, M(t) the nuclear magnetization measured at time t, the time be- tween π and π/2 pulse.
In many crystal, the quadrupolar interaction of elec- tric quadrupole moment of the nucleus with lattice vi- bration is a very important for the origin of the spin- lattice relaxation mechanism for the nuclear spin system (I ≥ 1). The coupling can generally be written by spin- lattice Hamiltonian
H =∑
F(q)A(q), (2)
Fig. 6. (Color online) The spin lattice relaxation time rate of 75As nucleus in RbH2AsO4 single crystal with increasing temperature.
where F(q) is the lattice operator and A(q) is the spin operator of order q. The lattice operators F(q) are ex- panded as a function of stress tensor S:
F = F0+ F1S + F2S2+ F3S3+· · · (3) At temperature far below the melting point, it is rea- sonably assumed that the thermal stress to be small and the first few terms in Eq. (3) are important. The term F1S represents the direct process; the emission or ab- sorption of a single phonon. The next term F2S2 indi- cates Raman process; the absorption or emission of two phonons, or absorption of one phonon which is followed by the emission of another one. The relaxation rate T1−1 is proportional to the square of the absolute temperature T in the direct process. Meanwhile, the Raman process shows the relaxation rate T1−1 which is proportional to the square of temperature [24,26,27].
The temperature dependences of the relaxation time, T1 for the75As nuclei in a RbH2AsO4 single crystal are calculated and the relaxation rates are displayed in Fig.
6. The rate appears to be proportional to experimen- tal temperature from 180 K to 430 K. From the above theory, the relaxation mechanism of 75As nuclei in this temperature range is mainly originated from the sin- gle phonon direct process. The spin relaxation time of the87Rb nuclei in RbH2AsO4 crystal in the paraelectric phase exhibits a minimum at 260 K [19]. However, the T1 of75As nuclei in RbH2AsO4crystal does not exhibit a minimum at 260 K.
Fig. 7. (Color online) Activation energy of 75As nuclei in RbH2AsO4 single crystal. The activation energy is measured from the slope by using T1= A0exp(Ea/kBT ).
By using the equation T1= Aoexp(Ea/kBT ), the ac- tivation energy of75As nuclei in RbH2AsO4 single crys- tals was determined, where Ea is the activation energy, T is the temperature, and kBis the Boltzmann constant.
Fig. 7 shows a graph of the natural logarithm of relax- ation time T1as a function of inverse temperature (T−1) is linear. The slope of the relaxation time is related to the activation energy. The obtained activation energies of the75As nuclei is 6.34 meV for in RbH2AsO4.
In conclusion, chemical shifts of 76As nuclei in RbH2AsO4 crystal change continuously with increasing temperature. The motional narrowing of line widths for
76As nuclei NMR spectra increased with increasing tem- perature. The origin of spin lattice relaxation76As nu- clei seems to be single phonon direct process instead of Raman process. The activation energy of the 76As in RbH2AsO4 single crystal is obtained as 6.34 meV.
REFERENCES
[1] K. D. Kreuer, Chem. Mater. 8, 610 (1996).
[2] S. M. Haile, D. A. Boysen, C. R. I. Chisholm and R. B. Merle, Nature 410, 910 (2001).
[3] T. Uda, D. A. Boysen and S. M. Haile, Solid State Ionics 176, 127 (2005).
[4] J. Castillo, E. M. Materon, R. Castillo, R. A. Vargas and P. R. Bueno et al., Ionics 15, 329 (2009).
[5] K. S. Lee, J. Phys. Chem. Solids 57, 333 (1996).
Chem. 12, 1234 (1967).
[11] B. C. Frazer and R. Pepinsky, Acta Cryst. 6, 273 (1953).
[12] G. E. Bacon and R. S. Pease, Proc. Roy. Soc. (Lon- don) A 220, 397 (1953).
[13] C. W. Fairall and W. Reese, Phys. Rev. B 10, 882 (1974).
[14] D. H. Yoo, G. H. Rue, H. K. Kim and K. -S. Lee, J.
Korean Phys. Soc. 32, 699 (1998).
[15] R. C. Leung, R. P. Lowndes and N. E. Tornberg, Phys. Lett. A 44, 383 (1973).
[16] W. R. Cook, J. Appl. Phys. 38, 1637 (1967).
[17] J. Seliger and V. Zagar, Phys. Rev. B 49, 14918 (1994).
Chap. III.
[22] A. R. Lim and K. Lee, Solid State Science 40, 55 (2015).
[23] W. E. Blumberg, Phys. Rev. 119, 79 (1960).
[24] A. Abragam, The Principles of Nuclear Magnetism (Oxford Univ. Press, Oxford, 1961), Chap. I and IX.
[25] B. Cowan, Nuclear Magnetic Resonance and Re- laxation (Cambridge University Press, Cambridge, 1997).
[26] J. Van Kranendonk, Physica 20, 781 (1954).
[27] R. L. Mieher, Phys. Rev. 125, 1537 (1962).