1. INTRODUCTION
Viewing the actual state in the depth filter market, there are only few companies which are manufacturing the depth filter media and the assembly of the depth fil- tration units for use in gas turbine intake air filtration.
Therefore there is a need for a development of domestic filter which will be able to compete in domestic market with existing commercial products. Depth filter media must have the ability of retaining the particles inside the layer and provide efficient particle collection at low pressure drop for long period of service (Park et al.,
2009). Different from the surface filtration the process of particle retention inside the filter mat is more complex (Hutten, 2007). Particles are collected by means of interception, inertial impaction, diffusion, gravitational settling and electrostatic attraction mechanisms (Hinds, 1982). Designing the fabric for depth filtration aims the optimum of three main parameters like pressure drop, particle collection efficiency and particle loading. These parameters determine the effectiveness of the depth filter media. Various procedures of testing are being applied to characterize the filter and evaluate their per- formance. The pore size is related to the ability of depth filter media to capture the particles within the layer. Air permeability is the measured air flow through a certain area of the depth filter media sample at specified pres-
Characterization of depth filter media for gas turbine intake air cleaning
Young Ok Park1),*, Naim Hasolli1),2), Ho Kyung Choi1) and Young Woo Rhee2)
1)Korea Institute of Energy Research, Clean Fossil Energy Research Center
2)Chungnam National University, Department of Chemical Engineering
(Received 20 December 2009, accepted 29 December 2009)
Abstract
A depth filter medium was newly designed in order to achieve high collection of dust and low pressure drop in this work. Multilayer depth filter media consist of an upstream layer of highly porous structure which allows particles to pass through and to follow by one or more downstream layers to hold the particles inside the media. For each filter media, flat sheet and pleated module were made of newly developed depth filter media and filter media of commer- cial products. Commercial depth filter cartridge for gas turbine air intake cleaning were used as reference for filtration area and pleat geometry of pleated modules. This work attempts to evaluate and compare the newly developed depth filter medium and two commercial filter media in terms of filtration parameters such as air permeability, initial pres- sure drop, particle retention and pressure drop variation with dust loading. According to the close examination the newly developed depth filter showed better performance compared to the commercial depth filter media.
Key words : Depth filter medium, Dust holding capacity, Gas turbine intake air filtration, Pleated shape, Terminal pressure drop
(사)한국입자에어로졸학회
*Corresponding author.
Tel : +82-(0)42-860-3625, E-mail : [email protected]
sure drop. Pressure drop is related to the fan power required to run the air through the filter. Initial values of pressure drop and particle penetration are determined by varying the flow rate to simulate the real application conditions. By applying NaCl on flat sheet of the test filter media and fine dust particles to pleated modules, particle capture performance of depth filter media can be predicted even though these results may not neces- sarily comply with the real situation of the depth filter media application. Dust holding capacity indicates the ability of the depth filter media to hold a certain amount of dust trapped. Usually the test depth filter media sample data are compared to other depth filter media as data per unit area (Hutten, 2007; Park et al., 2009).
The standard ASHRAE 52.2 and European standard EN779 specify the testing procedures for air filter tests.
In this study, some of main parameters were precisely reviewed focusing on particle filtration. The detailed test procedure could be found in former open references (Bittermann, 2006).
2. EXPERIMENT
2. 1 Experimental method and test filters Three test filters: TFM1, TFM2 and TFM3 were pre- pared in flat panels and characterized with other com-
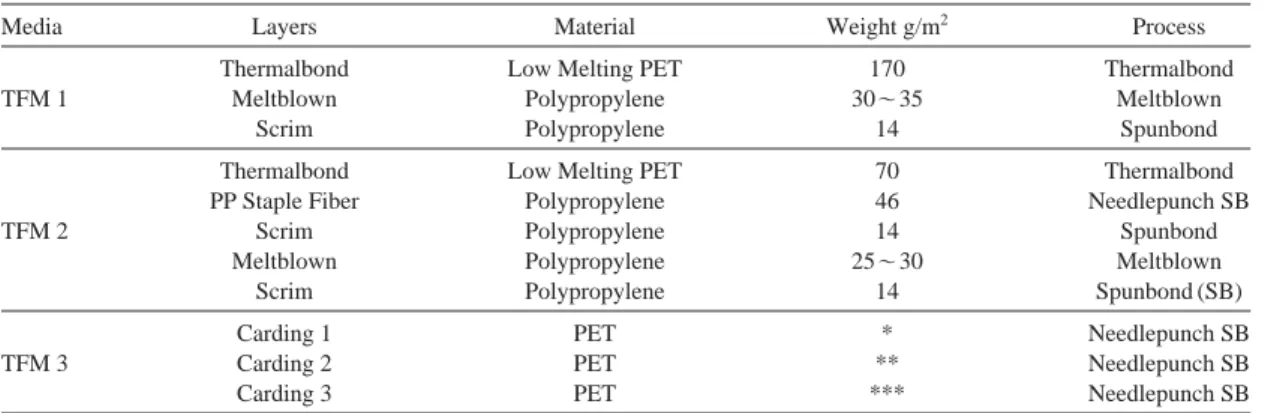
mercial products: TFP95 and TFP60. Commercial products are filter cartridges TFP95-1 and TFP60-1 provided by the company Korea Filtration Technologies (former Korea Vilene). Each filter was analyzed in pore size, air permeability, pressure drop and particle pene- tration. For test with cabin air filter test unit pleated filter modules of the test filter media were prepared. In the Table 1 is an overview of the test depth filter media with specifications about the specific weight and fiber manufacturing process.
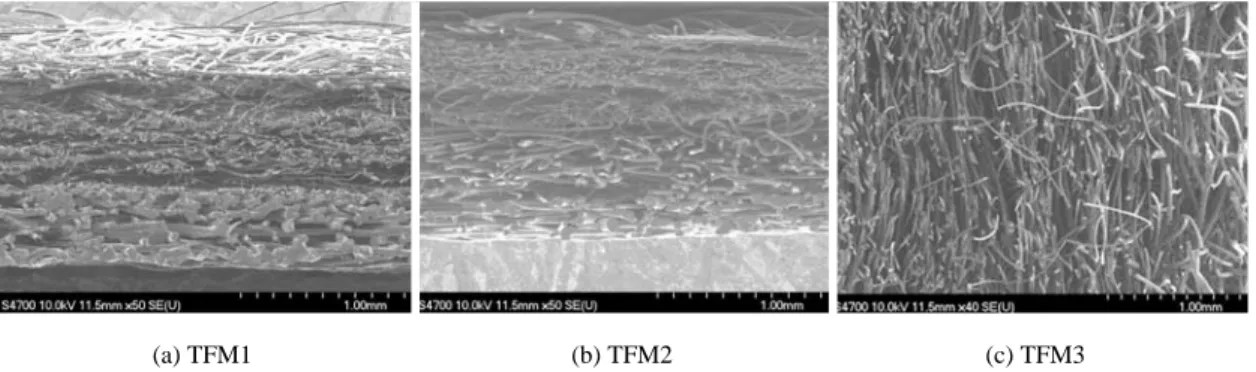
Depth filter media TFM1 is made of two layers. The meltblown layer is supported by a scrim made using spunbond process as shown in Figure 1. The more porous layer facing the air flow is the thermalbond layer.
The total thickness of the depth filter media is round 1.49 mm for the unloaded state. Depth depth filter media TFM2 consists of meltblown, staple fiber and thermalbond layer. The final layer is meltblown sup- ported by scrim. Total thickness of this media is 1.29 mm.
Depth filter media of the commercial product TFP95 is made of 3 layer. The total thickness of the media is round 1.18 mm. Depth filter media TFP60 is made of multiple layer structure as depicted and has the total thickness of 4.43 mm. The depth filter media structure of the cross section for both TFP95 and TFP60 is shown in the Figure 2.
Table 1.Test depth filter media and their layer structure.
Media Layers Material Weight g/m2 Process
Thermalbond Low Melting PET 170 Thermalbond
TFM 1 Meltblown Polypropylene 30~35 Meltblown
Scrim Polypropylene 14 Spunbond
Thermalbond Low Melting PET 70 Thermalbond
PP Staple Fiber Polypropylene 46 Needlepunch SB
TFM 2 Scrim Polypropylene 14 Spunbond
Meltblown Polypropylene 25~30 Meltblown
Scrim Polypropylene 14 Spunbond (SB)
Carding 1 PET * Needlepunch SB
TFM 3 Carding 2 PET ** Needlepunch SB
Carding 3 PET *** Needlepunch SB
*Low Melt PET 2 denier 80%++Regular PET 20%
**Low Melt PET 2 denier 40~60%++Regular PET 3~4 denier 60~40%
***Low Melt PET 4~6 denier 10~20%++Regular PET 3~6 denier 90~80%
2. 2 Experimental set up
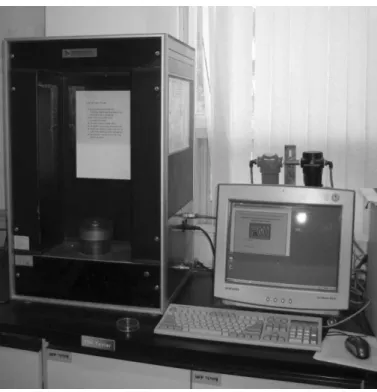
It is difficult to estimate the pore size of the filter media because of the complexity of inner structure of the depth filter media due to various fiber diameter, non- uniform direction of fibers, fiber bonding process and the thickness of the layer. Liquid extrusion porometry is one of the principles to characterize some parameters of the depth filter media inner structure. According to Jena and Gupta (2002), the principle of liquid extrusion can be applied to measure the mean flow pore size. Pore size distribution is calculated by the software avaliable for the test unit. Figure 3 shows the setup of the test unit Capillary Flow Porometer (PMI model CFP-1100- AEX).
The test media is inserted in the testing module of the unit after it has been soaked by the wetting liquid.
After starting the test the wet curve is generated by cal- culating the pressure which is needed to drive the air through the media. The first bubbles are generated at the spot where the channel size is the greatest indicating thus the largest pore size. The unit data aquisition soft- ware calculates the mean flow pore size distribution over the pore size. Jana and Grupta (2002) gave in their work a more detail explanation of the test procedures with PMI capillary flow porometer.
Filter air permeability tester (TEXTEST model FX3300) is used to determine the air permeability of the test media of flat sheet. The air is drawn through
Figure 1.Cross section SEM image of test depth filter media.
Figure 2.Cross section SEM image of commercial products.
(a) TFM1 (b) TFM2 (c) TFM3
(a) TFP95 (b) TFP60
the test flat media by vacuum pump. The test media sample was placed between two fastening clamps which hold the media fixed and by keeping the preselected test pressure (12.74 mmAq) the air permeability value is displayed digitally in the preselected unit m3/(min∙m2) for direct reading as shown in Figure 4.
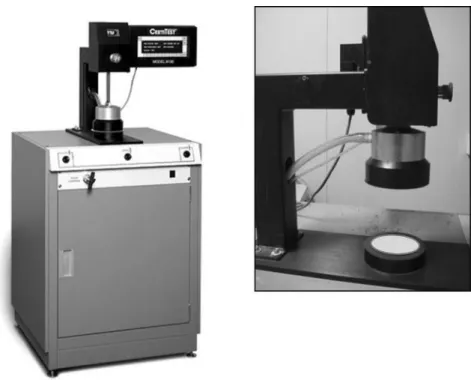
Automated Filter Tester (TSI model 8130) was used for testing initial pressure drop and particle penetration of depth filter media. As shown in Figure 5, the pneu- matic filter holder keep the test filter sample fixed bet- ween the clamps and the aerosol is passed through the sample filter. Pressure transducers placed upstream and downstream of the test filter give the pressure drop value. The two light-scattering laser photometers simul- taneously measure the aerosol concentration upstream and downstream of the test filter. The particle penetra- tion value is calculated from the ratio of the values mea- sured by two photometers and given digitally on the display. The data for the particle penetration are related to the particle size of 0.3μm.
Cabin air filter testing unit (TOPAS model DIN 71460-1 PAF 111) is designed for testing initial pres-
Figure 3.Image of Capillary Flow Porometer setup.
Figure 4.Image of the TEXTEST Air Permeability Tester.
sure drop, pressure drop after dust loading and overall collection efficiency. Test can be made according the
various standards for air filter tests. In our test the unit was used for testing the pleated module of the test depth
Figure 5.Automated Filter Tester (TSI model 8130) flow chart.
Figure 6.Real image of the Automated Filter Tester (TSI) and the clamping unit.
Flow control
valve Clean
air supply
Heater (8130 only)
Switching valve
Test
filter Pressure transducer
Pressure transducer
Flowmeter Filter Vacuum
pump Flow control
valve Downstream
photometer Upstream photometer Filter holder
Pneumatic cylinder
Exhaust Aerosol
generator Mixing manifold Aerosol neutralizer (standard on 8130:
optional on 8127)
To vacuum
To vacuum
filter media. In Figure 7. the test unit setup is depicted.
Pleated module is placed inside the filter chamber and
fixed. For single cartridge the nominal flow rate is 1,000 m3/hr. Filtration velocity (nominal flow rate per filtration
Figure 7.Setup of the Cabin Air Filter Test Unit (TOPAS) and pleated module mounted inside the test unit.
Figure 8.Flow schematic of the Cabin Air Filter Test Unit (TOPAS).
1
4 5 6
12
3
2 13
13
9
8 10
11 14 15
1 HEPA filter EU13 2 Test filter
3 Differential pressure sensor 4 Temperature sensor 5 Relative humidity sensor 6 Atmospheric pressure sensor 7 Optical particle counter 8 Flowrate sensor 9 Throttle valve 10 Blower
11 Frequency converter 12 Dust disperser 13 Pitch valve 14 Solenoid valve 15 HEPA inline filter 7
area of the cartridge) is 5.82 and 1.55 m3/m2respective- ly for TFP95 and TFP60 cartridge. Based on this value, calculated flow rate for the tests with pleated modules using TOPAS unit is 87.5 m3/hr. Test dust is ISO A2 Fine with mean size of 18.5μm. Initial pressure drop, collection efficiency and filter dust holding capacity are measured using this unit. Particles are measure by Laser Aerosol Particle Size Spectrometer (TOPAS model LAP 321) with the range 0.3 to 20μm alternating the mea- surement of upstream and downstream particle concen- tration. More details of the test rig main functional units are shown in flow diagram (www.topas-gmbh.de) depi- cted in Figure 8. Dust holding capacity (DHC) is deter- mined by measuring the weight of the pleated filter module before and after the test. The difference in weight gives the value for dust holding capacity in gram. Filter dust loading capacity, expressed in g/m2, is calculated by dividing the amount of collected particles by filtration area of the filter module.
For tests with filter module of pleated media there are details shown in Table 3. The dimensions are calculated from the reference filtration area that is used for com- mercial filter cartridges.
In Table 2. shows the details about the test units and test conditions applied for the test with panel depth filter media and the pleated depth filter media module. All the test has been performed under same testing room conditions of 25�C and relative humidity of 20%. To analyze the panel depth filter media every test was made
by taking three samples from each media and averaging the values of the certain characteristic found. Since all the above mentioned test units are automated test units, the data of interest are displayed directly on the panel or through data acquisition units. Pressure drop is cal- culated by measuring the pressure upstream and down- stream of the test filter. Similar to pressure drop, overall and fractional collection efficiency of the depth filter media is calculated by measuring the particle concentra- tion upstream and downstream of the test filter (Bitter- mann et al., 2006).
The filtration area is fitted in a module of dimensions 53.5 cm×26 cm and filtration area and pleat dimensions as shown in Table 3.
3. RESULTS AND DISCUSSION
3. 1 Mean flow pore size distribution
Capillary Flow Porometer was used for measuring the mean flow pore size of the testing depth filter media.
Mean pore size for media TFM1 is 19.05μm. Mean
Table 2.Test depth filter media type, sample dimensions and test conditions.
Test Device/Rig Media type Sample Size Test Conditions
Capillary Flow Porometer (PMI) panel 4 cm×4 cm Porewick, as wetting liquid
Air Permeability Tester FX 3300 (Textest) panel 20 cm2 Pressure: 12.74 mmAq Flow rate: 16.6 L/min Pressure: 4921.49 mmAq
Automated Filter Tester (TSI) panel 100 cm2 Test particles: NaCl
Flow rate: 32, 64 and 96 L/min Pleated module: Flow rate: 87.5 m3/min Cabin Air Filter Test Rig (TOPAS) pleated 53.5 cm×26 cm Test time: 88 min
(See Table 3.) Test particles: ISO A2 Fine Particle inlet concentration: 70 g/m3
Table 3.Pleated filter modules for test with TOPAS test rig.
Depth filter media TFM1/TFM2/TFP95 TFM3/TFP60
Filtration area, m2 0.87 0.25
Number of pleats, # 15.7 4.5
Pleat height, mm 52 52
Pleat distance, mm 16.8 58.8
pore size of the depth filter media TFM2 is 12.40μm and for TFM3 the value is 35.73μm with more uniform distribution of pore size as previous two depth filter media TFM1 and TFM2 as displayed in Figure 2. Mean flow pore size of the commercial product depth filter media TFP95 is 14.7μm and for the media TFP60 24.24 μm. The results as shown in Figure 9 indicate that most of the pores have the size close to value of the peak for the depth filter media TFM1, TFM2 and their compara- tive depth filter media TFP95. In case of depth filter media TFM3 the pore size distribution is more uniform throughout the range of the pores. For TFP60 media results show one peak with two other slightly more dis- tinctive peaks. Pore size distribution for TFM3 shows a more extended range of pore size than that of the media TFP60.
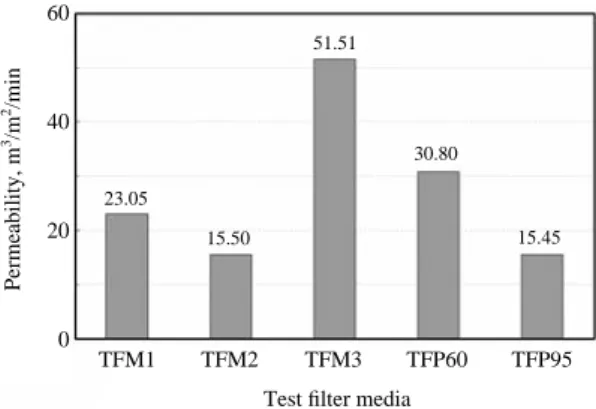
3. 2 Air permeability
Depth filter media layer air permeability test was made at the pressure of 125 Pa according to Japanese standard JIS L 1096-A and the sample size was 20 cm2. Figure 10 shows the permeability test results for all depth filter media in direct comparison chart. Air permeability test shows that the test depth filter media TFM1 has an average value of 23.05 m3/(min∙m2), TFM2 has slightly lower air permeability of 15.50 m3/ (min∙m2) and TFM3 of more porous structure than two previous samples has an average air permeability of 51.51 m3/(min∙m2). The commercial product depth
filter media TFP95 air permeability is in average similar to TFM2 depth filter media with 15.45 m3/(min∙m2) and for the depth filter media TFP60 the air permeabili- ty is 30.80 m3/(min∙m2), which is lower than the value of the TFM3 depth filter media.
The correlation between the values of mean flow pore size and air permeability is depicted in Figure 11. As can be viewed, the increase of the air permeability with the pore size is almost linear.
3. 3 Initial pressure drop and particle penetration
Automated Filter Tester unit is a compact filter test unit which was used to determine the pressure drop and particle penetration of the depth filter media. Pressure
Figure 9.Mean flow pore size distribution of test depth filter
medias. Figure 10.Air permeability test results for test depth filter
media.
Figure 11.Air permeability as a function of mean flow pore size for test depth filter media.
60 50 40 30 20 10 0
0 20 40 60 80 100
Mean flow pore size, micrometer
Pore size distribution, %
TFM1 TFM2 TFM3 TFP60 TFP95
60
40
20
0 23.05
15.50
51.51
30.80
15.45
TFM1 TFM2 TFM3 TFP60 TFP95
Test filter media Permeability, m3/m2/min
60.00 50.00 40.00 30.00 20.00 10.00
0.000 10 20 30 40 50 60
Mean flow pore size, micrometer Permeability, m3/m2/min
TFM1 TFM2 TFM3 TFP60 TFP95
drop increases with the increasing of flow rate at which the test media has been evaluated. The pressure drop characteristics, as depicted in Figure 12, show that depth filter media TFM1 has an average pressure drop of 6.6 mmAq, for TFM2 the pressure drop is 9.5 mmAq which is still lower than the value for the comparative media TFP95. The lowest pressure drop value is for TFM3 media with maximum of 3.1 mmAq at 96 L/min, lower than that of the media TFP60.
Pressure drop as function of mean flow pore size for test depth filter media is depicted in Figure 13. The depth filter media pressure drop decreases almost lin- early with the increase of the mean flow pore size. The initial pressure drop data are referred to the flow rate 64 L/min for the results shown in Figure 13 and 14.
Based on the linear correlation of the values for air permeability and mean flow pore size as shown in the Figure 11, the higher the air permeability results in lower pressure drop.
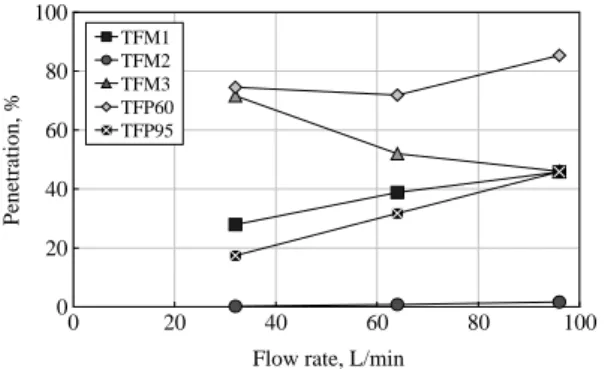
Particle penetration test show that the highest values are for the test depth filter media TFM3 with 71.6% at 32 L/min. Test depth filter media TFM1 has the highest value of 1.6% at 96 L/min and TFM2 reaches the maxi- mum particle penetration 45.8% at flow rate 96 L/min.
Figure 15 shows the results of the particle penetration at initial stage. Particle penetration for the commercial product depth filter media TFP95 is lower than both TFM1 and TFM2 depth filter media. The highest value is shown for the media TFP60, especially at the flow
rate of 96 L/min with 83.35%.
For penetration values in general can be viewed that the penetration increases with the increase of the pore size, but for test depth filter media TFM3 this is not the case. This can be related to the uniform distribution of the mean flow pore size. There is no other indication for this behavior of particle penetration as function of flow rate for test filter media TFM3. The particle pene- tration data are referred to the flow rate 64 L/min for the results shown in Figure 16 and 17.
Similar to the results shown in Figure 16, the particle penetration as function of the air permeability shows that particle penetration increases with the increase of air permeability. The penetration rate of TFP95 is higher than that of the depth filter media TFM2 despite the almost same value for air permeability of both media.
0 2 4 6 8 10 12
20 30 40 50 60 70 80 90 100
Flow rate, L/min
Pressure drop, mmAq
TFM1 TFM2 TFM3 TFP60 TFP95
Figure 12.Initial pressure drop as a function of flow rate for test depth filter media.
0 1 2 3 4 5 6 7
0 10 20 30 40 50
Mean flow pore size, micrometer
Pressure drop, mmAq
TFM1 TFM2 TFM3 TFP60 TFP95
Figure 13.Initial pressure drop vs. mean flow pore size for test depth filter media.
0 1 2 3 4 5 6 7
0 10 20 30 40 50 60
Permeability, m3/m2/min
Pressure drop, mmAq
TFM1 TFM2 TFM3 TFP60 TFP95
Figure 14.Initial pressure drop vs. air permeability for test depth filter media.
3. 4 Pressure drop with dust loading
The pressure drop characteristics are evaluated by variation of flow rate at 5 different values. The depth filter media TFM3 shows the highest values over the range of flow rate between 80 and 160 m3/hr. Best per- formance is achieved with media TFM1 which does not exceed the value of 2 mmAq as shown in Figure 18.
Values for depth filter media TFM2 and TFM3 are close to their respective comparative media TFP95 and TFP60.
The dust holding capacity (DHC) of media TFM1 is 6.46 g retained over the testing time of 88 minutes. The pressure drop increased from 1.2 to 2.7 mmAq at con- stant feeding rate 70 mg/m3of dust particles. Total feed amount was 8.98 g. Dust amount collected on the pleat- ed filter module made of depth filter media TFM2 is 6.76 g and the pressure drop increases round 0.5 mmAq
by initial pressure drop of 1.5 mmAq. By a 1.23 mmAq pressure drop increase from the initial value of 1.42 mmAq the DHC value is 6.4 g for media TFP95. Depth filter media TFM3 initial pressure drop is 1.3 mmAq and at the end of testing time after 88 min, the amount collected is 5.52 g and final pressure drop 2.6 mmAq.
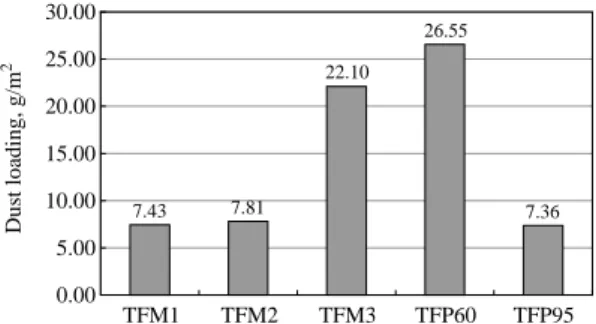
Depth filter media TFP60 shows better performance with 6.8 g at final pressure drop of 2.85 mmAq with initial pressure drop value of 1.42 mmAq. Based on the area of the test media the best results are shown for the media TFP60 followed by the media TFM3. The results are shown in the Figure 19.
Overall collection efficiency of depth filter media TFM1 is 99.975% and for TFM2 efficiency reaches the value of 99.72%. The depth filter media TFM3 shows poor collection efficiency of an average 66.43% over 0
20 40 60 80 100
0 20 40 60 80 100
Flow rate, L/min
Penetration, %
TFM1 TFM2 TFM3 TFP60 TFP95
Figure 15.Initial particle penetration vs. flow rate for test depth filter media.
0 10 20 30 40 50 60 70 80
0 10 20 30 40 50 60
Mean flow pore size, micrometer
Penetration, %
TFM1 TFM2 TFM3 TFP60 TFP95
Figure 16.Initial particle penetration vs. mean flow pore size for test depth filter media.
0 10 20 30 40 50 60 70 80
0 10 20 30 40 50 60
Penetration, %
Permeability, m3/m2/min TFM1
TFM2 TFM3 TFP60 TFP95
Figure 17.Initial particle penetration vs. air permeability for test depth filter media.
0.0 0.5 1.0 1.5 2.0 2.5 3.0 3.5 4.0
60 80 100 120 140 160 180
Pressure drop, mmAq
Flow rate, m3/hr TFM1
TFM2 TFM3 TFP60 TFP95
Figure 18.Initial pressure drop vs. flow rate for test depth filter media.
the entire range of particles. Collection efficiency for TFP95 is close to TFM1 and TFM2 media with 99.01%
and the TFP60 has higher collection efficiency than the comparative media TFM3. Figure 20 shows the results for all test depth filter media in direct comparison. The data shown in the Figure 20 are average values of the collection efficiency over the particle range 0.3 to 20 μm. Best values are shown to be that of the depth filter media TFM1 having an overall collection efficiency over 99.9%. This relates to the small mean flow pore size.
4. CONCLUSIONS
It was found from the evaluation of the air permeabi- lity that the pore size affects linearly with the flow rate in depth filter media. The TSI filter tester was quite an
effective tool to enable to correlate the pressure drop of fresh filters. The physical characterization of test filters showed better properties of the present filter medium:
TFM2 in pressure drop and particle penetration than TPF95. For the case of the depth filter media TFM3, particle penetration decreases as the flow rate increases.
Pressure drop value of TFM3 is the lowest among all the tested depth filter media, which is related to the large pore size and high air permeability. Pleated filter mod- ules were tested using TOPAS test rig to give an insight of the depth filter media performance when filter media are pleated. Pleated module of depth filter media TFM1 measured with TOPAS test unit indicates better perfor- mance than the flat panel of the same media tested using TSI test unit. Both TFM1 and TFM2 show however very high collection efficiency and good pressure drop characteristics similar to the those of comparative media TFP95. Pressure drop of the depth filter media TFM1, TFP95 and TFM3 increases faster with the load of the test dust. As a result of the experiment two depth filter media TFM1 and TFM2 have similar performances to their comparative media TFP95. Test with TOPAS test rig showed better results for depth filter media TFP60 than those for TFM3 related to particle collection effici- ency and pressure drop.
REFERENCES
Park, Y.O., Hasolli, N., Choi, H.K., and Rhee, Y.W., “Proceed- ings of 6th Asian Aerosol Conference”, 24-27 November 2009, The Imperial Queen’s Park Hotel, Bangkok, Thailand, pp.104.
Hutten, I.M. (2007) Handbook of Nonwoven depth filter media, Elsevier, Oxford.
Hinds, W.C. (1982) Aerosol Technology, Properties, Behavior, and Measurement of Airborne Particles, 2nd Edn.
Wiley, New York.
Bitterman, H., Recent Trends in Air Filter Testing, www.fiatec.
com/fileadmin/user_upload/hammermueller/down load/Recent_Trends_in_Air_ Filter_Testing.pdf.
NAFA (National Air Filtration Association), User Guide for ANSI/ASHRAE Standard 52.2-1999, www.nafaq.
org/LibraryFiles/Articles/Article006.htm.
7.43 7.81
22.10 26.55
7.36
0.00 5.00 10.00 15.00 20.00 25.00 30.00
TFM1 TFM2 TFM3 TFP60 TFP95
Dust loading, g/m2
Figure 19.Depth filter media dust loading characteristics for test depth filter media.
99.98 99.7
66.44 73.98
99.01
0 20 40 60 80 100 120
TFM1 TFM2 TFM3 TFP60 TFP95
Overall collection efficiency, %
Figure 20.Overall particle collection efficiency.
Bitterman, H., Seitz M., Moelter L., and Schmidt M., Determin- ing fractional efficiency in CAFs, Filtration and Separation, 206, pp. 18-21.
Jena, A., and Gupta, K. (2002) Characterization of Depth Filtra- tion Media, AFS 15th Annual Technical Meeting.
TOPAS (Technologie-orientierte Partikel-, Analysen- und Sensortechnik), Particle Filter Test Rig Series PAF, http://www.topas-gmbh.de/dateien/prospekt/100/
110/111prspe.pdf.