Ectopic Over-expression of Oncogene Pim-2 Induce Malignant Transformation of Nontumorous Human Liver Cell Line L02
In order to prove that ectopic over-expression of Pim-2 could induce malignant transformation of human liver cell line L02, three groups of cells were set up including human liver cell line L02 (L02), L02 cells transfected with Pim-2 gene (L02/Pim-2) and L02 cells transfected with empty-vector (L02/Vector). Pim-2 expression levels were detected.
The morphology, proliferation level, apoptosis rate and migration ability of the cells were detected respectively. Then the cells were subcutaneously inoculated into athymic mice and the microstructures of the neoplasm were observed. Compared with the controls, Pim-2 expression levels were significantly higher in L02/Pim-2 cells (P<0.05), and their morphology had obvious malignant changes. They also showed a significantly increased proliferation rate (P<0.05) and migration capacity (P<0.05), as well as a significantly decreased apoptosis rate (P<0.05). Only the athymic mice inoculated with L02/Pim-2 cells could generate neoplasm, and the morphology of the neoplasm coincided with that of the hepatoma. The results manifest that ectopic Pim-2 gene could be stably expressed in L02/
Pim-2 cells. Both the morphological and biological changes of L02/Pim-2 cells demonstrate the trend of malignant transformation. L02/Pim-2 cells could generate hepatoma in athymic mice. In conclusion, Pim-2 could induce malignant transformation of human liver cell line L02.
Key Words: Pim-2; Malignant Transformation; Liver Cell; L02 Ke Ren1, Wentao Duan1, Yujun Shi2,
Bo Li1, Zuojin Liu1, and Jiangping Gong1 Department of Hepatobiliary Surgery1, the Second Affiliated Hospital of Chongqing Medical University, Chongqing; Transplantation Immunity Laboratory2, West China Hospital of Sichuan University, Chengdu, P.R. China
Received: 21 October 2009 Accepted: 7 January 2010 Address for Correspondence:
Jianping Gong, M.D.
Department of Hepatobiliary Surgery, the Second Affiliated Hospital of Chongqing Medical University, 76 Linjiang Road, Yuzhong District, Chongqing 400010, P.R. China Tel: +86-23-63693521
E-mail: gongjianping11@126.com
This research is supported by National Natural Scientific Foundation of China (No. 30400424).
DOI: 10.3346/jkms.2010.25.7.1017 • J Korean Med Sci 2010; 25: 1017-1023
INTRODUCTION
The activation of oncogene and the inactivation of anti-onco- gene are two basic molecular biological events in the develop- ment of malignant tumors. Pim-2 is a newfound oncogene and its protein product belongs to the serine/threonine kinase Pim (proviral integration of Moloney virus) family (1). It has a strong effect on inhibiting the apoptosis of tumor cells without cell specificity, thus plays an important role in the development of several kinds of tumors such as lymphoma, leukemia, multiple myeloma and prostatic carcinoma, etc. (1-3). Recently, the re- searches on Pim-2 are mainly limited in lymph and hematopoi- etic system (4, 5). There are few reports focusing on the relation- ship between Pim-2 and hepatocellular carcinoma. It has been proved that both growth factors and glucose are needed in the anti-apoptotic effect of Pim-2 (1, 6), and it is well known that liv- er has dual blood supply which can offer abundant growth fac- tors and glucose. What’s more, our previous studies have found that the expression level of Pim-2 mRNA and protein were sig- nificantly higher in hepatocellular carcinoma tissues than that in normal liver tissues (7). Based on these findings, we presumed that Pim-2 may take part in the tumorigenesis of hepatocellular carcinoma. In our experiment, Pim-2 gene was successfully tran–
sfected into the nontumorigenic human liver cell line L02. And the biological behaviors of the transfected cells were detected.
We expected to confirm that the non tumorigenic human liver cell line L02 could be malignantly transformed when Pim-2 was over expressed. It would be supportive to our previous hypoth- esis that Pim-2 takes part in the tumorigenesis of hepatocellular carcinoma.
MATERIALS AND METHODS Cell culture and transfection
Three groups of cells were set up in our experiment: L02 cells transfected with Pim-2 gene (L02/Pim-2, group A), L02 cells transfected with empty-vector (L02/vector, group B), the non tumorigenic human liver cell line L02 (L02, group C). The con- struction of the eukaryotic cell expression vector pCI-neo-Pim-2 and the transfection were performed as described previously (7).
Each group of cells were cultured in the RPMI 1640 medium con- taining 10% betal bovine serum (FBS) and 50 μg/mL Ampicillin at 37°C with 5% CO2 for 20 generations.
Reverse transcription PCR
Total RNA was extracted from each group of cells respectively
using SV total RNA isolation kit (Promega, USA). The integrality of the total RNA was verified by electrophoresis. Specific primers for Pim-2 and GAPDH were synthesized according to the pub- lished sequences: Pim-2 forward 5’-ATGTTGACCAAGCCTC- TACA-3’, reverse 5’-TTAGGGTAGCAAGGACCAGG-3’; GAPDH forward 5’-CGGGAAACTGTGGCGTGAT-3’, reverse 5’-CAAAG–
GTGGA–GGAGTGGGT-3’. The constituents of the reaction sys- tem were listed as below: MgCl2 (25 mM) 10 μL, 10×RNA PCR buffer 5 μL, RNase free deionized water 19 μL, dNTP mixture (10 mM) 5 μL, RNase inhibitor (40 U/μL) 1 μL, AMV retroviridase (5 U/μL) 1 μL, AMV-Optimized Taq (5 U/μL) 1 μL, Pim-2 forward primer (20 pM/μL) 2 μL, Pim-2 reverse primer (20 pM/μL) 2 μL, total RNA sample 4 μL, and the total bulk volume were 50 μL.
The reverse transcription reactions were carried out at 50°C for 30 min, and then the reaction system were heated to 94°C for 2 min, followed by a course of 35 cycles with 94°C for 30 sec, 55°C for 30 sec and 72°C for 1 min in each cycle. After the last cycle, a final extension step was taken at 72°C for 7 min. Finally, the RT-PCR products were electrophoresed on 1% agarose gels and quantified by UVP gel analysis system. The experiment was repeated three times for each group.
Immunocytochemistry
Each group of cells was inoculated on a cover slip respectively, fixed with 4% paraformaldehyde for 30 min and washed with phosphate buffered solution (PBS). In order to inactivate endog- enous peroxidase, the cells were incubated with 3% H2O2 for 10 min and then washed with PBS. Then goat serums were added in order to reduce nonspecific binding. Cells were incubated with goat-anti-human Pim-2 polyclonal antibody (1:200) (sc- 13675, Santa Cruz Biotechnology) at 37°C for 1 hr and washed with PBS. Then secondary antibodies were added and kept at 37°C for 0.5 hr followed by a washing with PBS. Stept Avidin Bio- tin Complex was added next and kept at 37°C for 30 min. Then the cells were washed with PBS and diaminobenzidine coloring reagent was added. The cover slips were dyed with hematoxylin and dehydrated with alcohol, then cleaned in xylene and mount- ed with gum. Finally, the results were observed under micro- scope. The experiment was repeated three times for each group.
Cell morphology observation
Each group of cells was incubated respectively until 80% areas of the culture plate were covered. Then the medium was poured out and the cells were washed with PBS. Finally, the morpholo- gy of the cells was observed under the inverted microscope. The experiment was repeated three times for each group.
Analysis of the cell migration rate
Millicell rooms (Millipore) were used for cell migration ability assay. There were upper layer and lower layer in the Millicell room with a membrane in the middle which had micro-holes
for cells to pass. The counts of the migrated cells in a certain pe- riod of time could be regarded as their migrating ability. Each group of cells was cultured in the RPMI 1640 medium with 10%
FBS and then transferred into another RPMI 1640 medium with- out FBS. After 24 hrs’ incubation, the supernatant of the culture fluid was collected and cryopreserved as conditioned medium for later use. The optimal time point for detecting was set at 4-hr according to preliminary experiment. Three Millicell rooms were prepared for each group of cells. The cell density was adjusted to 105/mL. 100 µL cell suspension were added into the Millicell room and 500 µL conditioned medium were added outside.
Four hours later, the Millicell rooms were taken out and washed with PBS. Then the samples were fixed by 2% glutaraldehyde (GA) for 30 min and stained with Giemsa for 10 min. The cells in the upper layer of the microporous membrane were removed and the cells in the lower layer were counted under the inverted microscope. The experiment was repeated three times for each group.
Analysis of cell proliferation level
The cells was digested with 0.25% trypsin digestion and made into cell suspension of 2×10⁴/mL. Two hundred µL cell suspen- sion was added into each hole of the cell culture plate, 6 holes each group. Five pieces of such cell culture plates were prepared for and placed in the incubator at 37°C with 5% CO2. Five time points were set as 24 hr, 48 hr, 72 hr, 96 hr, and 120 hr after the incubation. Five plates were taken out respectively at five differ- ent time points, one plate each time. Twenty μL methyl thiazolyl tetrazolium (MTT) was added into each hole away from light when each plate was taken out and then placed back into the incubator for 4 hr. Then the fluid in each hole was removed com- pletely and 150 μL dimethyl sulfoxide was added in. Optical density of each sample was assayed by spectrophotometer at the wave length of 570 nm. Finally, the cell growth curve of each group was drawn on the base of the optical density data.
Analysis of cell apoptosis rate
After incubation for 48 hr, each group of cells was harvested and digested by 0.25% trypsin digestion. Then the cells were made into single cell suspension together with PBS and centrifuged 3,000 rpm for 5 min. The cell density was adjusted to 106/mL.
one mL cell suspension was put into a tube and centrifuged, and the supernatant was removed. The cells were washed with cold PBS twice and then suspended in 200 μL buffer. Ten μL Annex- in V-FITC and 5 μL propidium iodide were added into each cell centrifugation tube and the reaction was developed away from light at room temperature for 15 min. Then 300 μL buffers were added in and the apoptosis rates of the cells were detected by flow cytometry (FCM). The experiment was repeated three times for each group.
Carcinogenic ability assay
15 male athymic mice were purchased from the experimental animal center of Chongqing Medical University and were ran- domly divided into 3 groups with 5 mice in each group. The three groups of cells were respectively digested with trypsinization and centrifugated by 1,200 rpm for 5 min. The cells were then suspended with PBS and the density were adjusted to 107/mL.
Each group of cells was accordingly inoculated to one group of athymic mice and each mouse was subcutaneously injected with 0.2 mL cell suspension at the right hind limb. The diame- ters of the mass which appeared in the athymic mice several days after the inoculation were measured twice a week. The vol- ume of the mass was calculated according to the following for- mula: Volume (V)=A×B×C (A, B and C stand for the length, width and height of the mass respectively). Finally the tumor mass were cut down and made into different sections routinely according to different demands, and then observed under light microscope and transmission electron microscope (TEM) respectively. All animals received appropriate care in our experiments.
Statistical analysis
The experimental data were analyzed using the SPSS 13.0 soft- ware package. Average values were expressed as an arithmeti- cal mean±standard deviation. The comparison between two
groups was assessed by Student’s t test. P values less than 0.05 were considered to be statistically significant.
RESULTS
The expression level of Pim-2 mRNA and protein
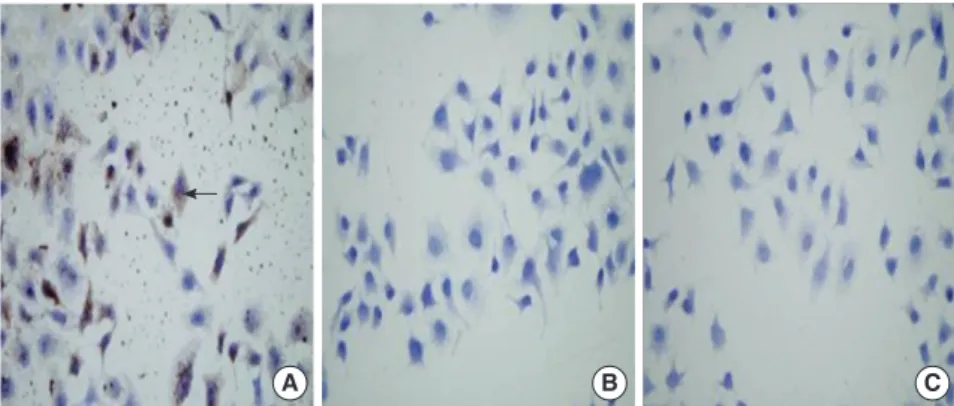
In the RT-PCR result (Fig. 1), the band gray value represents the mRNA level of the corresponding cell group. We could see that Pim-2 mRNA is expressed in all the three groups of cells, but the expression level is obviously higher in L02/Pim-2 group than those in the other two groups. In the immunocytochemistry re- sults (Fig. 2), Pim-2 protein is stained as buffy materials. We could see that Pim-2 protein is expressed in L02/Pim-2 group but not in the other two groups.
Malignant changes in morphology, migrating rate, proliferation rate and apoptosis rate
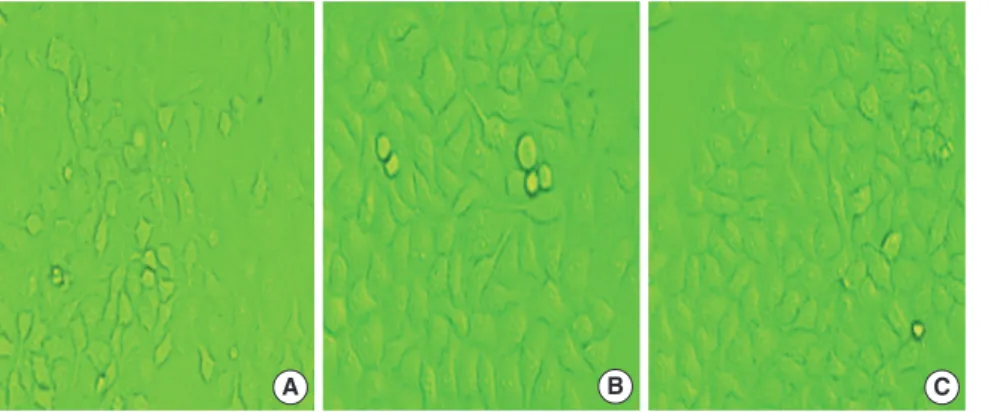
In the early days after transfection, both L02/Pim-2 cells and L02/vector cells had no obvious change in their shapes. But af- ter culturing for 20 generations, some differences were found.
L02/Pim-2 cells were irregular fusiform of different size; and many small protuberances were observed (Fig. 3A), while L02/
vector cells still had no obvious change in shape (Fig. 3B). The shapes of L02 cells were always regular polygon or ellipse in con- cordant size constantly (Fig. 3C).
In the migration ability analysis, the average number of the migrated cells is 95.1±4.75/HP in L02/Pim-2 group (Fig. 4A), while 72.2±5.67/HP in L02/vector group (Fig. 4B) and 75.0±6.57/
HP in L02 group (Fig. 4C). Compared with the controls, much more cells in the L02/Pim-2 group migrate through the micro- porous membrane within the same time period. The statistical data also show significant difference between L02/Pim-2 group and the other two groups (P<0.05), but no significant differenc- es between the L02/vector group and the L02 group (Fig. 4D).
In the proliferation level analysis, the detailed OD570 values of the different cell groups in different time points are shown in Table 1. We could see that no significant differences in the OD570 value were found among the three groups of cells during the first day. In the next four days, the OD570 value of the cells in the L02/
Fig. 1. Semi-quantitative RT-PCR of Pim-2 mRNA in the three groups of cells. The band gray value represents the mRNA level of the corresponding cell group. Pim-2 mRNA was expressed in all the three groups of cells but the expression level was significantly higher in L02/Pim-2 group (A) than that in L02/vector group (B) and L02 group (C).
M, marker.
100
GaPDH (311)
Prim-2 (936) 250
500 750 1,000
2,000
M A B C
Fig. 2. Immunocytochemistry of Pim-2 protein in the three groups of cells. Buffy materials (arrow shows) are found in the cytoplasm and nucleus of the L02/Pim-2 group cells (A) but not in the L02/vector group (B) and L02 group (C).
The buffy materials were regarded as Pim-2 protein. It indicated that the expression level of Pim-2 protein was significantly higher in L02/Pim-2 group than that in the L02/vector group and the L02 group (×200).
B
A C
Pim-2 group significantly increased compared with those in the other two groups (P<0.05), but no significant differences were found between the L02/vector group and the L02 group.
In the apoptosis rate analysis, the FCM results (Fig. 5) show that the apoptosis rate is 2.3±0.9% in L02/Pim-2 group, while 5.5±0.4% in L02/vector group and 5.7±1.5% in L02 group. The statistical analysis showed significant difference between L02/
Pim-2 and the other two groups (P<0.05), but no significant dif-
ference between the L02/vector group and the L02 group.
Production of carcinoma in athymic mice
Nine days after the inoculation, a neoplastic mass was firstly found in one athymic mouse which was inoculated with L02/
Pim-2 cells, and neoplasmas were found in all the 5 athymic mice of this group 21 days after the inoculation, with the aver- age volume of 0.6×0.5×0.3 cm (Fig. 6). But no mass was found in the mice inoculated with L02/vector cells or L02 cells through- out our experiment (data not shown).
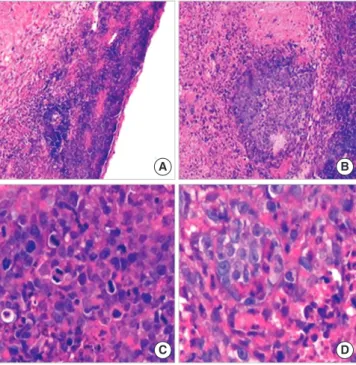
The histology of the mass under light microscope shows ob- viously disordered structure with large areas of necrotic tissue.
The cells have marked cellular atypia, with giant nucleus, aug- mented karyoplasmic ratio, clear chromatospherite and preva- lent mitosis, especially pathological mitosis (Fig. 7). Observed
Fig. 3. The morphology of the cells in the three groups.
After culturing for 20 generations, the cells in the L02/
Pim-2 group (A) are irregular fusiform shape of different size and many small protuberances are observed. The morphology of the cells in the Pim-2/vector group (B) and L02 group (C) are similar each other and they are all regular polygon or ellipse in concordant size (inverted microscope ×200).
A B C
B
A C
D
Number of migrating cells
120 100 80 60 40 20 0
Group A Group B Group C
Group A Group B Group C
95.1
72.2 75
* *,†
Fig. 4. Migrated cells of the three groups in the Millicell room. (A-C) More cells in the L02/Pim-2 group (A) than in the L02/vector group (B) and L02 group (C) migrate through the microporous membrane. (D) There is significant difference between group A and group B, C, but no significant differences between group B and group C (*P<
0.05 vs. Group A; †P >0.05 vs. Group B; inverted microscope ×200).
Table 1. OD570 values of the three groups of cells in different time points
Group Number of cell suspension samples in each group
OD values
1 day 2 day 3 day 4 day 5 day
A 6 0.453±0.042 0.640±0.050 0.939±0.110 1.063±0.115 1.171±0.135
B 6 0.418±0.044 0.484±0.064* 0.716±0.095* 0.855±0.068* 0.956±0.109*
C 6 0.423±0.034 0.459±0.044*,† 0.694±0.077*,† 0.869±0.048*,† 0.966±0.103*,†
No significant differences in the OD570 value were found among the three groups of cells during the first day. In the next four days, the OD570 value of the cells in group A significantly increased compared with those in the other two groups (P<0.05), but no significant differences were found between the group B and group C. (Group A: L02/Pim- 2; Group B: L02/vector; Group C: L02; *P<0.05 vs. Group A; †P>0.05 vs. Group B).
Fig. 5. Apoptosis rate of the three groups of cells. The data of flow cytometry results show that the apoptosis rate of group A is significantly lower than that in the other two groups (B, C) (*P <0.05 vs. Group A), and no significant differences are found between group B and group C (†P >0.05 vs. Group B). (Group A: L02/Pim-2; Group B: L02/
vector; Group C: L02).
Apoptosis rate (%)
8 7 6 5 4 3 2 1
0 Group A Group B Group C
*
*,†
for malignant transformation trend. Our results also found that L02/Pim-2 cells had high proliferation rate and low apoptosis rate. This could be regarded as another evidence. Finally, we found that only L02/Pim-2 cells could produce neoplastic mass in athymic mice. What’s more, the histology of the neoplasm were coincident to that of malignant tumors. This could be re- garded as the most direct evidence. Based on these findings, it was believed that ectopic overexpression of Pim-2 could induce malignant transformation of nontumorous human liver cell line L02 cells. This conclusion is supportive to our previous presump- tion that Pim-2 may take part in the tumorigenesis of hepato- cellular carcinoma, and was in accordance with the researches on Pim-2 in lymph and hematopoiesis system tumors (8-10).
In this experiment, we presented a series of phenomenon to prove that Pim-2 could induce malignant transformation of non- tumorous human liver cell line L02 cells, but we haven’t got the detailed mechanism. There is no doubt that clarifying the signal B
D A
C
Fig. 7. The histology of the neoplastic tissue under light microscope. (A, B) The neoplastic tissue shows structurally disordered, with large areas of necrosis tissue (H&E, ×200); (C, D) The cells have marked cellular atypia, with giant nucleus, augmented karyoplasmic ratio, clear chromatospherite and prevalent mitosis, especially pathological mitosis (H&E, ×400).
B
D A
C
Fig. 6. The neoplastic mass found in the athymic mice which were inoculated with L02/Pim-2 cells. The first neoplasma was found in the 9th day after the inoculation, and in the 21st day, all the athymic mice in this group produced neoplasmas (A, B), with the average volume of 0.6×0.5×0.3 cm (C, D).
Fig. 8. The ultrastructure of the neoplastic cells under TEM. (A) Much more smooth endoplasmic reticulum (arrow) are found (TEM ×5,000); (B) The cells have large and irregular nucleus with profound umbilication (white arrow). Few giant mitochondria are found in the cytoplasm. Big chromatospherite or even multiple nucleoli are also found (TEM
×7,000); (C) Multi-euchromatin (double arrows) are found in the nuclues (TEM ×8,000).
B
A C
2 µm 2 µm 2 µm
under the transmission electron microscope (TEM), the neoplas- tic cells have diverse sizes and irregular shapes. More smooth endoplasmic reticulum (SER) and fewer giant mitochondria are found in the cytoplasm. The nuclei become large and irregular with profound umbilication and multi-euchromatin. Large chro- matospherite or even multiple nucleoli are also found (Fig. 8).
DISCUSSION
As a precondition of the whole experiment, the relative high ex- pression level of Pim-2 mRNA and protein in L02/Pim-2 cells proved that our transfection was successful and that ectopic Pim- 2 could be stably expressed in L02/Pim-2 cells. As a pathologi- cal common sense, the morphologic changes of the L02/Pim-2 cells found in our experiment indicated an increased mobility, and the following migration ability experiment confirmed this inference. Increased mobility could be regarded as an evidence
transduction pathway of Pim-2 in hepatoma cells would provide more affirmative evidence for our presumption.
Bad is a proapoptosis protein which belongs to Bcl-2 family.
It is the only known phosphorylation substrate of Pim-2 kinase up to now (11). Pim-2 could phosphorylate Bad at multiple sites such as ser112, ser136 and ser155, etc. and different phosphor- ylat ion site plays different role in the anti-apoptotic effect (12).
Recently, a new research has found that Apoptosis Inhibitor 5 (API-5) has a conserved sequence “RXRHXS”with Bad, and this conserved sequence is just the recognition site of Pim-2 kinase (13). Thus API-5 is now regarded as another possible substrate of Pim-2. What’s more, API-5 has been reported to be involved in the tumorigenesis of hepatocellular carcinoma (14). Based on these findings, API-5 can be presumed as another probable downstream target of Pim-2 in hepatocarcinoma cells.
Another finding in lymphoma cells reports that the malignant transformation of lymphocyte by Pim-2 is dependent on NF-κB, and the anti-apoptotic effect of Pim-2 could be totally inhibit–
ed by NF-κB specific inhibitor (15). Pim-2 could activate NF-κB through a series of phosphorylation reactions. It is well known that NF-κB is an important transcription factor (16). It can in- duce the transcription of several anti-apoptotic genes such as Bcl-2 and Myc, etc. (17). Different upstream stimulating signals could activate different transcription products, thus finding the key downstream factor of Pim-2 becomes the focus.
Based on the related experimental results listed above, we have probed the relationship between Pim-2, NF-κB, and API-5 in or- der to clarify the detailed anti-apoptosis mechanism of Pim-2 in hepatocellular carcinoma. From the results of the clinical tis- sue experiments, we found that all the three factors were highly expressed in hepatocellular carcinoma tissues but lowly expre–
ssed in paired noncancerous liver tissues and normal liver tis- sues. The same results were found in cell experiments. What’s more, NF-κB specific repressor could inhibit the expression lev- el of both NF-κB and API-5, but has no effect on Pim-2. The cell apoptosis rate is finally decided by the expression level of API-5 other than Pim-2. Therefore, we could preliminarily draw the conclusion that Pim-2 could activate API-5 to inhibit the apop- tosis of liver cells, and NF-κB is the key regulator (18). This result support our presumptive mechanism that Pim-2 could induce malignant transformation of nontumorous human liver cell line L02 cells.
As a matter of fact, the anti-apoptotic mechanism of tumor cells is performed by several anti-apoptotic factors. The anti- apoptotic pathways in the cells are just like a net and Pim-2 is only one point on the net. So there may be complex relationships between Pim-2 and its neighbors. It has been reported that many oncogenes could affect the anti-apoptotic effect of Pim-2, such as Akt, Bcl-2, Myc, and p53 (11, 12, 19, 20). Besides, there must be certain relationship among the members in Pim family (21- 24). Some researchers have found that Pim-1 is involved in the
tumorigenesis of prostate cancer (2) and Pim-3 is reported to take part in the tumorigenesis of liver cancer too (25). The pos- sible interaction between Pim-2 and these oncogenes in the pro- cess of hepatoma tumorigenesis also needs further study. It is believed that further research of anti-apoptotic pathway by Pim- 2 will be beneficial to illuminate the pathogenesis of liver cancer.
REFERENCES
1. Fox CJ, Hammerman PS, Cinalli RM. The serine/threonine kinase Pim-2 is a transcriptionally regulated apoptotic inhibitor. Genes Dev 2003; 17:
1841-54.
2. Chen WW, Chan DC, Donald C, Lilly MB, Kraft AS. Pim family kinases enhance tumor growth of prostate cancer cells. Mol Cancer Res 2005; 3:
443-51.
3. Adam M, Pogacic V, Bendit M, Chappuis R, Nawijn MC, Duyster J, Fox CJ, Thompson CB, Cools J, Schwaller J. Targeting Pim kinases impairs survival of hematopoietic cells transformed by kinase inhibitor-sensitive and kinase inhibitor resistant forms of Fms-like tyrosine kinase 3 and BCR/ABL. Cancer Res 2006; 66: 3828-35.
4. Mahadevan D, Spier C, Della Croce K, Miller S, George B, Riley C, War- ner S, Grogan TM, Miller TP. Transcript profiling in peripheral T-cell lymphoma, not otherwise specified, and diffuse large B-cell lymphoma identifies distinct tumor profile signatures. Mol Cancer Ther 2005; 4:
1867-79.
5. Cohen AM, Grinblat B, Bessler H, Kristt D, Kremer A, Schwartz A, Hal- perin M, Shalom S, Merkel D, Don J. Increased expression of the hPim-2 gene in human chronic lymphocytic leukemia and non-Hodgkin lym- phoma. Leuk Lymphoma 2004; 45: 951-5.
6. Chen XP, Losman JA, Cowan S, Donahue E, Fay S, Vuong BQ, Nawijn MC, Capece D, Cohan VL, Rothman P. Pim serine/threonine kinases regulate the stability of Socs-1 protein. Proc Natl Acad Sci USA 2002; 99:
2175-80.
7. Gong J, Wang J, Ren K, Liu C, Li B, Shi Y. Serine/threonine kinase Pim-2 promotes liver tumorigenesis induction through mediating survival and preventing apoptosis of liver cell. J Surg Res 2009; 153: 17-22.
8. Guo F, Sigua C, Bali P, George P, Fiskus W, Scuto A, Annavarapu S, Mout- taki A, Sondarva G, Wei S, Wu J, Djeu J, Bhalla K. Mechanistic role of heat shock protein 70 in Bcr-Abl- mediated resistance to apoptosis in hu- man acute leukemia cells. Blood 2005; 105: 1246-55.
9. Ayala GE, Dai H, Ittmann M, Li R, Powell M, Frolov A, Wheeler TM, Thompson TC, Rowley D. Growth and survival mechanisms associated with perineural invasion in prostate cancer. Cancer Res 2004; 64: 6082-90.
10. Dai JM, Zhang SQ, Zhang W, Lin RX, Ji ZZ, Wang SQ. Antisense oligode- oxynucleotides targeting the serine/threonine kinase Pim-2 inhibited proliferation of DU-145 cells. Acta Pharmacol Sin 2005; 26: 364-8.
11. White E. The pims and outs of survival signaling: role for the Pim-2 pro- tein kinase in the suppression of apoptosis by cytokines. Genes Dev 2003;
17: 1813-6.
12. Macdonald A, Campbell DG, Toth R, McLauchlan H, Hastie CJ, Arthur JS. Pim kinases phosphorylate multiple sites on Bad and promote 14-3-3 binding and dissociation from Bcl-XL. BMC Cell Biol 2006; 7: 1.
13. Peng C, Knebel A, Morrice NA, Li X, Barringer K, Li J, Jakes S, Werne- burg B, Wang L. Pim kinase substrate identification and specificity. J
Biochem 2007; 141: 353-62.
14. Wang Y, Lee AT, Ma JZ, Wang J, Ren J, Yang Y, Tantoso E, Li KB, Ooi LL, Tan P, Lee CG. Profiling microRNA expression in hepatocellular carci- noma reveals microRNA-224 up-regulation and apoptosis inhibitor-5 as a microRNA-224-specific target. J Biol Chem 2008; 283: 13205-15.
15. Hammerman PS, Fox CJ, Cinalli RM, Xu A, Wagner JD, Lindsten T, Thompson CB. Lymphocyte transformation by Pim-2 is dependent on nuclear factor-kappaB activation. Cancer Res 2004; 64: 8341-8.
16. Lin A, Karin M. NF-kappa B in cancer: a marked target. Semin Cancer Biol 2003; 13: 107-14.
17. Karin M, Lin A. NF- kappaB at the crossroads of life and death. Nat Im- munol 2002; 3: 221-7.
18. Ren K, Zhang W, Shi Y, Gong J. Pim-2 activates API-5 to inhibit the apop- tosis of hepatocellular carcinoma cells through NF-kappaB pathway.
Pathol Oncol Res 2009 Oct 12. DOI 10.1007/s12253-009-9215-4.
19. Datta SR, Ranger AM, Lin MZ, Sturgill JF, Ma YC, Cowan CW, Dikkes P, Korsmeyer SJ, Greenberg ME. Survival factor-mediated BAD phosphor- ylation raises the mitochondrial threshold for apoptosis. Dev Cell 2002;
3: 631-43.
20. Pelengaris S, Khan M, Evan G. c-MYC: more than just a matter of life
and death. Nat Rev Cancer 2002; 2: 764-76.
21. Dai H, Li R, Wheeler T, Diaz de Vivar A, Frolov A, Tahir S, Agoulnik I, Thompson T, Rowley D, Ayala G. Pim-2 upregulation: biological impli- cations associated with disease progression and perineural invasion in prostate cancer. Prostate 2005; 65: 276-86.
22. Aho TL, Sandholm J, Peltola KJ, Mankonen HP, Lilly M, Koskinen PJ.
Pim-1 kinase promotes inactivation of the pro-apoptotic BAD protein by phosphorylating it on the Ser112 gatekeeper site. FEBS Lett 2004; 571:
43-9.
23. Leverson JD, Koskinen PJ, Orrico FC, Rainio EM, Jalkanen KJ, Dash AB, Eisenman RN, Ness SA. Pim-1 kinase and pl00 cooperate to enhance c- Myb activity. Mol Cell 1998; 2: 417-25.
24. Peng C, Knebel A, Morrice NA, Li X, Barringer K, Li J, Jakes S, Werne- burg B, Wang L. Pim kinase substrate identification and specificity. J Biochem 2007; 141: 353-62.
25. Fujii C, Nakamoto Y, Lu P, Tsuneyama K, Popivanova BK, Kaneko S, Mukaida N. Aberrant expression of serine/threonine kinase Pim-3 in he- patocellular carcinoma development and its role in the proliferation of human hepatoma cell lines. Int J Cancer 2005; 114: 209-18.