Print ISSN: 2233-4165 / Online ISSN: 2233-5382 doi:http://dx.doi.org/10.13106/ijidb.2017.vol8.no5.15
The Effect of On-line Product Presentation
: A Comparative Study between 3D and General Product Presentation
Shuo liu*
Received: June 28, 2017. Revised: August 28, 2017. Accepted: October 15, 2017.
Abstract
Purpose – This research aims to examine the effects of 3D online products presentation by comparing it with general presentation.
Research design, data, and methodology – To rigorously investigate the differences of effects between 3D presentation and general presentation, this study examines the differences of the two presentations in vividness, informedness, entertainment, product trust, and purchase intention. This research designed two different forms of online product presentations, 3D and general presentation for an experiment.
Results – The research findings indicate that 1) the vividness of online product presentation has a positive impact on the informedness and entertainment. While both vividness and informedness product presentation have a positive impact on product trust, the entertainment of online product presentation has no significant impact. 2) Vividness, informedness, entertainment, product trust, and purchasing intention showed significant differences between 3D and general product presentations. 3) Overall, 3D product presentation showed a stronger impact on purchasing intention than the general product presentation.
Conclusions – This research expands the area of business presentation by comparing the differences of 3D and general presentation methods. This study made a great contribution to theory development, and also to guidelines for practice.
These insights could be used by organizations in developing realistic environments for business presentations.
Keywords: 3D Presentation, Vividness, Entertainment, Informedness, Product Trust, Purchase Intention, Comparison.
JEL Classifications: M31, M37.
1. Introduction
With the rapid growing popularity of Internet service, online product presentation as a new form of advertising has been widely exploited by organizations. Product presentation plays a critical role in designing an effective and efficient transaction process. Since the late 1990's, "image-text-3D environment -Digital display," going beyond text-based mechanism, has been widely used.
The main objective of this research is to examine the effects of 3D online products presentation, by comparing with general presentation. To rigorously investigate the differences of effects between 3D online products presentation and general presentation, this research examines the differences
* School of Economics & management, Shandong Yingcai University, China. Tel: +86-156-6582-9765, E-mail: [email protected]
of the two presentations in vividness, informedness, entertainment, product trust, and purchase intention. This research designed two different forms of online product presentations, 3D and general presentation for an experiment. With the designed two forms of presentations, this study collected a total of 215 survey responses who viewed both presentations.
2. Theory
Jarvenpaa and Todd (1997) found that product awareness is a significant element for consumer attitudes and purchase intentions, and is important for the online purchase process.
Different forms of product presentation will have an impact on the attitude of consumers using the network (Daugherty et al., 2008), and also decide whether to drive the purchase
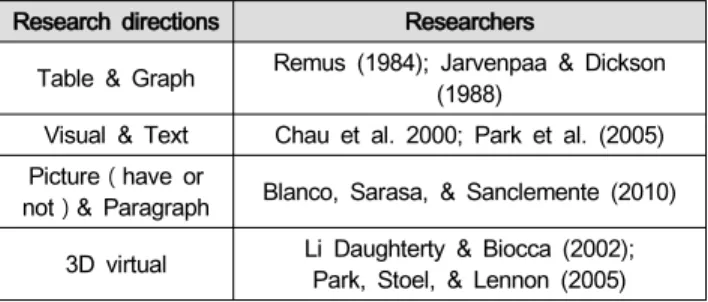
intention (Park et al., 2005). At present, in the e-commerce environment, the research of product display type can be divided into four categories. Reduct as <Table 1>
<Table 1> Research of product display type
Research directions Researchers
Table & Graph Remus (1984); Jarvenpaa & Dickson (1988)
Visual & Text Chau et al. 2000; Park et al. (2005) Picture(have or
not)& Paragraph Blanco, Sarasa, & Sanclemente (2010) 3D virtual Li Daughterty & Biocca (2002);
Park, Stoel, & Lennon (2005) According to the characteristics of type differences of product presentation and the diversification of users, effective product presentation form can deliver effective, emotional information of product to make users easy access to information while promoting consumption (Chau et al., 2000).
When consuming on the internet, consumers may encounter some problems in the process of choosing products, like when receiving the product, they feel that is different from the information they obtain from the Internet, therefore resulting in return of goods. In order to overcome this problem, the application of virtual technology to display the good characterized by 3D effects emerges. 3D product presentation is a new form of advertisement to simulate the actual goods with the application of three dimensional image technologies to allow consumers to better observe the goods before buying. 3D product presentation simulates the physical state of visual auditory and behavioral experience to allow consumers to better experience the goods. Previous studies have shown that in on-line environment, providing virtual image and indirect experience to customers before purchasing can make them acquire information similar to the physical store (Li et al., 2002). Using 3d product presentation enables the customers to directly observe the appearance characteristics of the product, and while to decide how to observe product.
3. Model & Hypothesis
Ducoffe (1996) conducted an experiment with individual advertising as the subjective judgment. The study showed that the informedness, entertainment and irritation of advertising had some effect on the value and attitude of the advertisement, and then the advertising attitude model was put forward. According to his research, the irritation has a high impact on the entertainment, and also has an impact on the accuracy of the statistical data and the analysis results (Thompson,1997). Therefore, this study uses two attribute variables out of the Ducoffe advertising attitude model, namely, informedness and entertainment, and then
add the visualization provided by the product as a new variable. Using effect of online product presentation on those variables, and the influencing relationship among those variables, product trust, purchasing intention builds the research model. <Figure 1> is the research model constructed by the research according to the above content.
Informedness
Entertainment
The style of online product Presentation
vividness Product trust Purehase indtetion
<Figure 1> Research Model
3.1. Different hypothesis between general and 3D The impact of general product presentation and 3D product presentation is different
Consumers cannot get the same product experience in the online environment as in the actual store, hence can only get an indirect product experience. But the new technology of visual image can overcome the problem that consumers cannot experience feeling and touching in virtual store (Wagner, 2005). Virtual experience is a type of indirect experience. Consumers can conduct stimulation technology, such as move, expansion, reduction, experiencing the same feeling as real product (Li, Daugherty, & Biocca, 2002).
According to the research of this scholar, compared with the normal Internet experience, virtual experience is more vividly cognitive. Therefore, the product for the display of these attributes on the product trust, the purchase of the intention of the impact of general product presentation and 3d product presentation is different. Therefore, we make the following hypothesis.
<H1> These attributes of product presentation on the product trust, the purchase intention of the impact of general product presentation and 3D product presentation is different.
<H1-1> The Vividness of the impact of general product presentation and 3Dproduct presentation is different
<H1-2> The informedness of the impact of general product presentation and 3D product presentation is different.
<H1-3> The entertainment of the impact of general product presentation and 3D product presentation is different.
<H1-4> The product trust of the impact of general product
presentation and 3D product presentation is different.
3.2. Hypothesis by these attributes
The influencing relationship among the attributes of the product presentation, product trust and purchase intention
Some research has verified the important factors to influence the visual online consumption, which can increase the degree of goodwill of consumers to the purchases, improve the purchasing desire (Coyle & Thorson, 2001).
Carson, Peck, Chiders (1996) argue that providing more relevant informedness in the online consumer environment will increase the likelihood of purchasing. Looking at some advertising literature, happy ads can make people get a positive feeling that can improve the success of transaction (Alwitt & Prabhaker, 1994). Advertising-induced entertainment has an important effect on consumer awareness of advertising (Shavitt, Lowrey, & Haefner, 1998). Therefore, we make the following hypothesis.
<H2-1> The vividness of product presentation have positive impact on the informedness
<H2-2> The vividness of product presentation have positive impact on the entertainment
<H2-3> The vividness of product presentation have positive impact on the product trust
<H2-4> The informedness of product presentation have positive impact on the product trust
<H2-5> The informedness of product presentation have positive impact on the purchase intention
<H2-6> The entertainment of product presentation have positive impact on the product trust.
<H2-7> The entertainment of product presentation have positive impact on the purchase intention.
<H2-8> The product trust of product presentation have positive impact on the purchase intention.
<H3> For different types of products shows, the impact of its attributes for the product trust and the purchase intention is different.
<H3-1> The vividness of 3D product presentation have positive impact on the informedness is better than the general product presentation’s
<H3-2> The vividness of 3D product presentation have positive impact on the entertainment is better than the general product presentation’s
<H3-3> The vividness of 3D product presentation have positive impact on product trust is better than the general product presentation’s
<H3-4> The informedness of 3D product presentation
have positive impact on product trust is better than the general product presentation’s
<H3-5> The informedness of 3D product presentation have positive impact on purchase intention is better than the general product presentation’s
<H3-6> The entertainment of 3D product presentation have positive impact on product trust is better than the general product presentation’s
<H3-7> The entertainment of 3D product presentation have positive impact on purchase intention is better than the general product presentation’s
This article selects the latest DSLR camera as an example of a product presentation. The same products are provided with 3d and the general presentation forms, of which the experiments are carried out.
4. Analysis
4.1. Reliability analysis
The internal compatibility is determined with application of Chronbach Alpha coefficient in the general reliability analysis.
When the Cronbach score is greater than 0.7, the gauge has a higher reliability. <Table 2> shows that the Cronbach's a value is between 0.821 and 0.901, hence the validity of the reliability can be determined.
<Table 2> Reliability
Variable Cronbach’s Alpha
Vividness 0.872
Entertainment 0.901
Informedness 0.841
Product trust 0.821
Purchase intention 0.882
4.2. Validity analysis
The validity of this paper adopts the bootstrap method of PLS to verify the factor loading value of the constituent concept. The recommended value of factor loading in the measurement item is greater than 0.7 and the average variation extraction criterion is that the value of AVE is greater than 0.5 (Fornell & Larcker, 1981). The factor loading values of each path in this paper are shown in the following <Table 3>. The value of the factor loading is greater than 0.7, and the factor loading value of the variable is larger than the value of cross factor, and the AVE value is more than 0.5, hence the validity of the content is proved.
<Table 3> Factor Analysis
Vividness Informedness Entertainment Product trust Purchase intention
Vividness1 0.745 0.430 0.417 0.322 0.401
Vividness2 0.793 0.331 0.547 0.253 0.321
Vividness3 0.861 0.485 0.537 0.391 0.430
Vividness4 0.812 0.361 0.528 0.331 0.342
Vividness5 0.851 0.379 0.589 0.503 0.513
Informedness1 0.359 0.796 0.397 0.301 0.356
Informedness2 0.400 0.793 0.348 0.343 0.396
Informedness3 0.421 0.778 0.332 0.375 0.406
Informedness4 0.354 0.762 0.449 0.404 0.410
Informedness5 0.371 0.777 0.440 0.283 0.335
Entertainment1 0.528 0.462 0.883 0.462 0.519
Entertainment2 0.598 0.360 0.846 0.397 0.420
Entertainment3 0.610 0.493 0.903 0.397 0.468
Entertainment4 0.534 0.444 0.881 0.375 0.485
Product trust1 0.396 0.398 0.393 0.851 0.567
Product trust2 0.285 0.277 0.358 0.792 0.448
Product trust3 0.419 0.381 0.344 0.737 0.423
Product trust4 0.346 0.358 0.403 0.845 0.471
Purchase intention1 0.451 0.377 0.471 0.501 0.848
Purchase intention2 0.431 0.457 0.459 0.543 0.884
Purchase intention3 0.458 0.506 0.466 0.470 0.872
Purchase intention4 0.375 0.343 0.458 0.535 0.833
<Table 4> Variable correlation coefficient & AVE
AVE Vividness Informedness Entertainment Product trust Purchase intention
Vividness 0.662 0.814
Informedness 0.610 0.489 0.781
Entertainment 0.772 0.646 0.501 0.878
Product trust 0.652 0.450 0.441 0.465 0.808
Purchase intention 0.740 0.499 0.490 0.539 0.596 0.860
* Diagonal: root square AVE,
** Off-diagonal: related coefficient (** 0.05 is Significance)
<Table 5> Groups statistics
Group N Mean Std. Deviation Std. Error Mean
Vividness general 109 3.171 .502 .048
3D 106 3.939 .488 .047
Informedness general 109 3.382 .420 .040
3D 106 4.043 .413 .040
Entertainment general 109 3.011 .502 .048
3D 106 3.837 .549 .053
Product trust general 109 3.404 .526 .050
3D 106 3.8494 .486 .047
Purchase intention general 109 3.262 .552 .053
3D 106 3.892 .489 .048
4.3. Difference effect analysis & hypothesis verification In this paper, we use SPSS18.0 to compare the difference between the 3D presentation and the general presentation, and use PLS to verify the difference between the two. After determining the reliability and validity of the variables, it is necessary to verify the difference between the 3D presentation and the general presentation. An
independent sample of two populations was tested using spss18.0.As the <Table 5>.
Notice of observation of t test, two groups of vividness, informedness, entertainment, product trust, purchase intention of p=0.000 (p<0.05), so the general presentation and 3D presentation groups have significant difference between the average value and standard value, so that hypothesis 1(<H1-1>-<H1-5>) is established as <Table 6>.
<Table 6> T test
t-test for Equality of Means
t df Sig.(2-tailed) Mean
Difference Std.Error Difference
95% Confidence Interval of the Difference
Lower Upper
Vividness -11.374 213 .000 -.769 .068 -.902 -.636
Informedness -11.639 213 .000 -.662 .057 -.774 -.549
Entertainment -11.521 213 .000 -.826 .072 -.967 -.684
Product trust -6.443 213 .000 -.445 .069 -.582 -.309
Purchase intention -8.847 213 .000 -.630 .071 -.770 -.489
<Table 7> The results of the hypothesis
Original
sample Sample
mean Standard
error Path coefficient T value Result
H2-1: Vividness→Informedness 0.465 0.473 0.078 0.465 5.939 Accepted
H2-2: Vividness→Entertainment 0.215 0.217 0.102 0.215 2.108 Accepted
H2-3: Vividness→Product trust 0.620 0.629 0.065 0.620 9.485 Accepted
H2-4: Informedness→Product trust 0.238 0.231 0.094 0.438 2.532 Accepted
H2-5: Informedness→Purchase intention 0.253 0.264 0.081 0.235 3.134 Accepted
H2-6: Entertainment→Product trust 0.199 0.202 0.115 0.199 1.725 Reject
H2-7: Entertainment→Purchase intention 0.211 0.204 0.092 0.219 2.290 Accepted
H2-8: Entertainment→Purchase intention 0.322 0.315 0.093 0.522 3.467 Accepted
4.4. All path analysis and hypothesis verification The variance of the path in the PLS analysis is expressed by the R-squared value in the explanatory variance (Chin & Gopal, 1995). As for the analysis results of PLS, informedeness and entertainment values respectively accounts for 21.6% and 38.5%, the product trust value is 29.2%, interpretation value of product trust and the former variable to the purchase intention is 40.1%, and all these value are more than the appropriate measured value 10%
proposed by Falk and Miller (1992). Through the path analysis among groups, we use Bootstrap of SmartPLS to conduct verification of the hypothesis among variables.
Based on the Bootstrapping calculation, the statistical significance of the structural model is based on the t statistic. Under the 5% confidence level, if the t value is greater than the critical value of 1.96, the path coefficient is significant. The results of the study are shown below
<Figure 2>.
As the vividness, from the verification results of hypothesis <H2-1>, <H2-2> and <H2-3> about the positive impact of visuality on informedness, entertainment, and product trust, coefficient of each path is 0.465, 0.620, 0.215, and each of T value is 5.939, 9.485, 2.108. So <H2-1>,
<H2-2> and <H2-3> are established.
As the informedness, from the verification results of hypothesis <H2-4> and <H2-5> about the positive impact of
informedness on product trust and purchase intention, coefficient of each path is 0.438, 0.235, and each of T value is 2.532, 3.134,. So, <H2-4> and <H2-5> are established.
As the entertainment, from the verification results of hypothesis <H2-6> and <H2-7> about the positive impact of entertainment on product trust and purchase intention, coefficient of each path is 0.199, 0.299, and each of T value is 1.725, 2.290,. So, <H2-6> is dismissed and <H2-7>
is established.
As the product trust, from the verification results of hypothesis <H2-8> about the positive impact of purchase intention, coefficient of each path is 0.522 and T value is 3.467,. So <H2-8> is established
The results of the hypothesis are shown below <Table 7>.
Informedness R2=21.6%
Product turst R2=29.2% Purchase intention R2=40.1%
Entertainment R2=38.5%
vividness 0.***
5.*** 0.***
2.***
0.192 2.365 0.***
3.***
0.***
2.***
0.***
9.***
0.***
1.7**
0.***
9.***
<Figure 2> The result of group's path coefficient -
<Table 8> A comparison of 3D and the general presentation
3D presentation General presentation Difference
Result path
coefficient T value path
coefficient T value coefficient
difference T value H3-1
Vividness→Informedness 0.390 4.488 0.074 0.525 0.316 19.671 Supported
H3-2
Vividness→Entertainment 0.408 4.389 0.333 3.430 0.075 5.780 Supported
H3-3
Vividness→Product trust 0.195 2.040 -0.115 1.117 0.08 5.915 Supported
H3-4
Informedness→Product trust 0.228 2.158 0.091 0.970 0.137 15.381 Supported
Informedness→Purchase intentionH3-5 0.316 3.442 0.192 2.365 0.124 10.493 Supported
Entertainment→Product trustH3-6 0.108 1.532 0.353 3.272 -0.245 16.126 not supported
H3-7
Entertainment→Purchase intention 0.139 1.965 0.109 1.214 0.030 2.296 Supported
4.5. Path analysis and hypothesis verification between two groups
This article is divided into 3D presentation group and the general presentation group, there are 106 samples in 3D group, and there are 109 samples in general group.
The significant difference verification is conducted between two groups in 3D presentation and general presentation (the T value of the difference path coefficients). At the 5%
confidence level, if the t value is greater than the critical value of 1.96, the path coefficient is significant. Teo and Yeong (2003) used the following formula to analyze the differences between the path coefficients and the standard error.
× ×
×
min
Where “n” is the number of samples for the first population, “m” is the number of samples for the second population, “SE1” is the standard error for the first population sample, “SE2” is the standard error for the second population sample, “Pn” is the first population The path coefficient, “Pm”, is the second group path coefficient.
This paper is a comparative analysis of the influence of vividness on informedness, entertainment, product trust, information and entertainment on product trust and purchase intention in 3D presentation and general presentation. The validation of the type difference is the judgment of the difference between the 3D and the general group. The results of the analysis are shown in <Table 8> the vividness
impact on informedness, entertainment, product trust, informedness on product trust, purchase intention, entertainment impact on purchase intention, 3D presentation model shows better results than general presentation, which is verified. But the impact of entertainment on product trust in the general shows gets better results than shown in the 3D presentation model. Therefore, <H3-1>-<H3-5> and
<H3-7> are supported. However, <H3-6> is not supported.
5. Conclusion
The research findings indicate that 1) the vividness of online product presentation has a positive impact on the informedness and entertainment. While both vividness and informedness product presentation have a positive impact on product trust, the entertainment of online product presentation has no significant impact. 2) Vividness, informedness, entertainment, product trust, and purchasing intention showed significant difference between 3D and general product presentations. 3) Overall, 3D product presentation showed a stronger impact on purchasing intention than the general product presentation did.
In conclusion, this research expands in the area of business presentation by comparing the differences 3D and general presentation method. This study made a great contribution to theory development, but also to guidelines for practice. These insights could be used by organizations in developing realistic environments for business presentation.
6. Limitation
This research is an analysis of the overall effect of online
product presentation; especially comparing the effect between 3D and general presentation. But due to the limitation of time and space, it’s difficult to conduct a large-scale questionnaire survey. So we can only select the students who have better popularity and accept new things as a reference object. Thus, the survey was not comprehensive.
There are many factors influencing the effect of online
product presentation. This research, from the perspective of consumer experience, selects vividness, informedness, entertainment and other factors to carry on the research.
However, other elements of presentation are not included.
For example, product events, product elements, product contents and so on. Future research should be considered in terms of product (price, quality) and other factors (event, indirect effects).
References
Alwitt, L. F., & Prabhaker, P. R. (1994). Identifying Who Dislikes Television: Not By Demographics Alone.
Journal of Advertising Research, 34(6), 17-29.
Carson, S. J., Joann, J. P., & Terry, L. C. (1996).
Preliminary Results on the Determinants of Technology Assisted Shopping(TAS): A Model, Measure Development, and Validation. Proceedings of AMA Educator’s Conference, American Marketing Association, Winter, 229-239.
Chau, P. Y. K., Au, G., & Tam, K. Y. (2000). Impact of Information Presentation Modes on Online Shopping: an Empirical Evaluation of a Broadband Interactive Shopping Service. Journal of Organizational Computing and Electronic Commerce, 10(1), 1–22.
Chin, W. W., & Gopal, A. (1995). Adoption Intention in GSS: Importance of Beliefs. Data Base Adv., 26, 42-64.
Coyle, J. R., & Thorson, E. (2001). The Effects of Progressive Levels of Interactivity and Vividness in Web Marketing Sites. Journal of Advertising, 30(3), 65-77.
Daugherty, T., Li, H., & Biocca, F. (2008). Consumer Learning and the Effects of Virtual Experience Relative to Indirect and Direct Product Experience.
Psychology and Marketing, 25(7), 568-86.
Flavián-Blanco,C., Gurrea-Sarasa, R., & Orús- Sanclemente, C. (2010). Effects of Visual and Textual Information in Online Product Presentations:
Looking for the Best Combination in Website Design. European Journal of Information Systems, 19(6), 668-686.
Fornell, C., & Larcker, D. (1981). Evaluating Structural Equation Models with Unobservable Variables and
Measurement Error. Journal of Marketing Research, 18(1), 39-50.
Jarvenpaa, S. L., & Dickson, G. W. (1988). Graphics and Managerial Decision Making: Research-based Guidelines. Communications of the ACM, 31(6), 764 –774.
Jarvenpaa, S. L., & Todd, P. A. (1997). Consumer Reactions to Electronic Shopping on the World Wide Web. International Journal of Electronic Commerce, 1(2), 59-88.
Li, H., Daugherty, T., & Biocca, F. (2002). Impact of 3-D Advertising on Product Knowledge, Brand Attitude, and Purchase Intention: The Mediating Role of Presence. Journal of Advertising, 31(3), 43–57.
Park, J. H., Lennon S. J., & Stoel, L. (2005). Online Product Presentation: Effects on Mood, Perceived Risk, and Purchase Intention. Psychology and Marketing, 22(9), 695–719.
Remus, W. (1984). A Study of Graphical and Tabular Display and Their Interaction with Environmental Complexity. Management Science, 33, 1200–1204.
Shavitt, S., Lowrey, P., & Haefner, J. (1998). Public Attitudes Towards Advertising: More Favourable Than You Might Think. Journal of Advertising Research, 38(4), 7-22.
Teo, T. S. H., & Yeong, Y. D. (2003). Assessing the Customer Decision Process in the Digital Marketplace. Omega, 31(5), 349-363.
Thompson, B. (1997). The Importance of Structure Coefficients in Structural Equation Modeling Confirmatory Factor Analysis. Educational and Psychological Measurement, 57(1), 5-19.
Wagner. (2005). A Robustness and Evolvability in Living Systems. NJ: Princeton University Press.