105
Cerebrospinal fluid analysis in 13 clinically healthy Beagle dogs;
hematological, biochemical and electrophoretic findings
IL-Hwan Kim
1,4, Dong-In Jung
1, Jong-Hyun Yoo
2, Byeong-Teck Kang
1, Chul Park
3, Hee-Myung Park
1,*
1
College of Veterinary Medicine, Konkuk University, Seoul 143-701, Korea
2
BK21 Program of Integrative Network Systems for Veterinarians in Basic Science, Industrial Animals and Preventive Medicines, Konkuk University, Seoul 143-701, Korea
3
School of Veterinary Medicine, University of California, Davis, Davis, California 95616, USA
4
SamJeon Animal Hospital, Seoul 138-180, Korea
(Accepted: March 12, 2008)
Abstract : The purpose of this study is to define the normal findings of cerebrospinal fluid (CSF) of the clinically healthy Beagle dogs and to provide basic information in diagnosis of neurologic disorders.
CSF obtained from 13 clinically healthy dogs was examined for total and differential cell counts, total protein concentration, glucose and lactate dehydrogenase (LDH) concentration, specific gravity, turbidity, and protein electrophoresis. On gross examination, CSF samples evaluated were clear and colorless. Few red blood cells and nucleated cells were present. The mean concentration of glucose and LDH examined were 65.8 mg/dl and 2.7 mg/dl, respectively. The cellular components of CSF samples based on differential counts were monocytes (41.9%), activated macrophages (35.8%), lymphocytes (20.0%), neutrophils (1.6%), and eosinophils (0.7%). The fractions of electrophoretic protein in CSF were albumin (52.7%), alpha-globulin (16.5%), beta-globulin (24.8%), and gamma-globulin (3.0%). Results of albumin quota were ranged from 0.15 to 0.38. In conclusion, this study provided normal composition of CSF in Beagle dogs.
Keywords : beagle dog, cerebrospinal fluid (CSF), cerebellomedullary cistern
Introduction
In dogs, cerebrospinal fluid (CSF) analysis provides rapid and, in some situations, instant information to the veterinary clinician dealing with neurological disorders [15]. The data from the CSF analysis may be useful to identify the etiology of neurological disorders [3].
CSF evaluation alone is not often diagnostic, but it may be beneficial in differentiate diagnosis, if it is combined with other tests [3, 10].
When correctly performed under general anesthesia, cerebellomedullary cistern CSF collection in dogs is safe procedure and there are few harmful sequelae. The cisternal site is preferred for intracranial disease and the lumbar site is preferred for thoracic and lumbar spinal cord disease [14].
The purpose of this study is to define the normal
findings of CSF of the clinically healthy Beagle dogs and to provide basic information in diagnosis of neurologic disorders.
Materials and Methods
Animals
Thirteen intact Beagle dogs (5 males, 8 females, 1- 2 years, and 8.6-13.7 kg) were used in this study. All dogs were fed with the same diet (Jeroni; CJ, Korea).
The food was withheld for 12 h prior to study. No abnormalities including the complete blood count (CBC), serum biochemistry and survey radiography were found in the dog. Fecal floatation for endoparasiticism showed no remarkable findings. All dogs were completely vaccinated prior to study (Canigen DH(A2)PPIL; Virbac, France).
*Corresponding author: Hee-Myung Park
College of Veterinary Medicine, Konkuk University, Seoul 143-701, Korea
[Tel: +82-2-420-4140, Fax: +82-2-450-3037, E-mail: [email protected]]
CSF collection procedure
Each dog was premedicated with 0.05 mg of atropine/kg of body weight subcutaneously (Jeil pharm, Korea). Anesthesia was maintained with ketamine (6 mg/kg; IV; Yuhan corporation, Korea) and xylazine (1.1 mg/kg; IV; Bayer Korea, Korea). CSF was collected by cerebellomedullary cisternal (CMC) puncture method with 22 gauge spinal needle.
Following the CSF tapping, the dogs were maintained on oxygen (100 ml/kg/min) until they required extubation.
Analysis of CSF
Color and turbidity of CSF were grossly examined and recorded. Nucleated cell counts were performed using standard hemocytometer technique [2]. All nucleated cells were counted in the 10 large squares (four corner squares and one center square on each side) for a total nucleated cell count per microliter.
Glucose and lactate dehydrogenase (LDH) concentration were determined using automatic serum chemical analyzer (Dry-chem clinical chemistry analyzer 3500i;
FUJI, Japan) according to the manufacturer’s instructions.
In addition, specific gravity (SG) was measured by using refractormeter.
Cytological evaluation
As CSF has a low cellular content, a cytocentrifuge (Cytospin4; Thermo Shandon, UK) was employed instead of using a direct smear of CSF. The CSF
sample was spun directly onto a glass slide at 250 g for 5 min. The slides were immediately dried, stained by the Diff-Quik stain (Sysmex corp., Japan) and examined under light microscopy. Briefly, differential cell counts were performed by classifying a minimum of 100 cells on each slide. Monocytes, activated macrophages, neutrophils, lymphocytes, eosinophils, and epithelial cells were classified according to the method described previously [1].
Protein determination and Protein electrophoresis Samples were stored at
−80
oC until used. All samples were analyzed within 7 days. Total CSF protein determinations was performed along with bovine gamma-globulin as a standard and measured with a lowry protein assay [12] and a urinary reagent dipstick according to a previous method [9].
CSF was concentrated 100 times before protein electrophoresis. Electrophoresis was carried out for 15 min at 180 volts using cellulose acetate membranes.
After electrophoresis, cellulose acetate membranes were stained with Ponceau S and washed with 5%
acetic acid. Total protein was fractionated into albumin,
α
-,
β-,
γ-globulin then was quantified by scanning densitometer (Neodin Vetlab, Korea) and measured each concentrations. Serum albumin concentrations for albumin quota (AQ) in this study were measured with the same technique used in CSF.
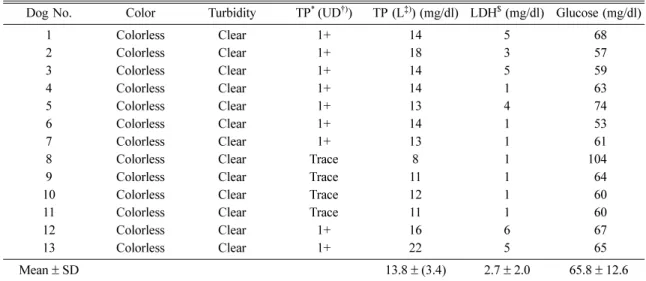
Table 1. Color, turbidity, total protein, lactate dehydrogenase, and glucose concentration of CSF in 13 Beagle dogs were summarized
Dog No. Color Turbidity TP
*(UD
†)) TP (L
‡)) (mg/dl) LDH
$(mg/dl) Glucose (mg/dl)
1 Colorless Clear 1+ 14 5 68
2 Colorless Clear 1+ 18 3 57
3 Colorless Clear 1+ 14 5 59
4 Colorless Clear 1+ 14 1 63
5 Colorless Clear 1+ 13 4 74
6 Colorless Clear 1+ 14 1 53
7 Colorless Clear 1+ 13 1 61
8 Colorless Clear Trace 8 1 104
9 Colorless Clear Trace 11 1 64
10 Colorless Clear Trace 12 1 60
11 Colorless Clear Trace 11 1 60
12 Colorless Clear 1+ 16 6 67
13 Colorless Clear 1+ 22 5 65
Mean
±SD 13.8
±(3.4) 2.7
±2.0 65.8
±12.6
*
TP: Total protein,
†UD: Urine dipsticks,
‡L: Lowry assay,
$LDH: Lactate dehydrogenase.
Results
Grossly, all CSF samples obtained through cerebello- medulary cistern were colorless and clear in this study (Table 1). Few red blood cells (RBCs) in CSF were present in some samples and total nucleated cells were ranged from 1 to 4 cells/µl (Table 2).
Glucose concentration of CSF was ranged from 53 to 104 mg/dl (65.8
±12.6 mg/dl). In addition, LDH concentration were all below 10 mg (1-6 mg/dl, mean;
2.7
±2.0 mg/dl).
SG of all CSF samples used was less than 1.005.
For clinical use based on a previous report [9], total protein concentration was ranged from trace to 1+
(approximately 30 mg/dl) in urine dipstick test.
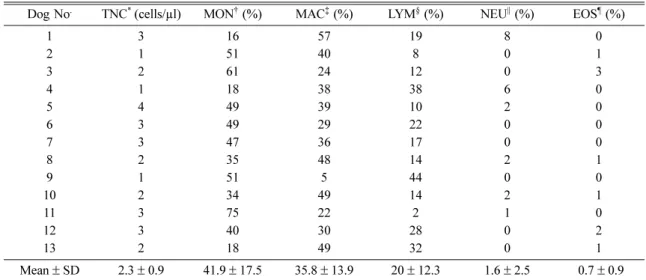
Mean differential cell count in CSF from the 13 Beagle dogs is summarized in Table 2. The majorities of cell presented were monocytes, activated macrophages and lymphocytes, while neutrophils, epithelial cells, and eosinophils were rarely observed.
There were no significant differences in mean total nucleated cell counts among the dogs evaluated.
Similarly, variation in the number of eosinophils and neutrophils from all dogs studied was minimal.
However, the number of monocytes, activated macrophages, and lymphocytes was varied in dogs evaluated (Table 2).
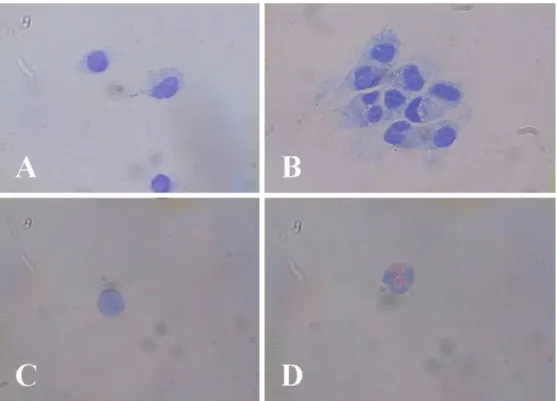
Predominant types of cells were monocytes and
activated macrophages. Morphologically, well-differen- tiated monocytes were relatively large (10 to 15 µm), round to oval discrete cells with eccentric round to oval nuclei (Fig. 2A). Nuclear chromatin was usually condensed than that seen in other macrophages and single nucleoli were more common. Numerous cytoplasmic vacuoles of activated macrophages were observed frequently (Fig. 2B). Lymphocytes, neutrophils, and eosinophils were well preserved and were morphologically similar to those in peripheral blood (Figs. 2C and 2D). On the average, lymphocytes accounted for approximately 20% of the total nucleated cells in the CSF obtained from normal dogs, and Table 2. Total and differential cell counts in CSF obtained from 13 Beagle dogs
Dog No
.TNC
*(cells/µl) MON
†(%) MAC
‡(%) LYM
§(%) NEU
||(%) EOS
¶(%)
1 3 16 57 19 8 0
2 1 51 40 8 0 1
3 2 61 24 12 0 3
4 1 18 38 38 6 0
5 4 49 39 10 2 0
6 3 49 29 22 0 0
7 3 47 36 17 0 0
8 2 35 48 14 2 1
9 1 51 5 44 0 0
10 2 34 49 14 2 1
11 3 75 22 2 1 0
12 3 40 30 28 0 2
13 2 18 49 32 0 1
Mean
±SD 2.3
±0.9 41.9
±17.5 35.8
±13.9 20
±12.3 1.6
±2.5 0.7
±0.9
*
TNC: Total nucleated cells,
†MON: Monocytes,
‡MAC: Activated macrophages,
§LYM: Lymphocytes,
||NEU: Neutrophils,
¶
EOS: Eosinophils.
Fig. 1. Densitometric tracing of normal CSF after protein electrophoresis (Case No. 11). A = albumin (50.6%),
α=
α
-globulin (19.2%),
β=
β-globulin (24.5%),
γ=
γ-glbulin
(4.5%).
neutrophils and eosinophils composed of 3% or less of the differential cell count. Ependymal lining cells were rarely observed in total number of nucleated cells recovered.
Comparison of CSF electrophoresis results of our study to other study [16] was summarized in Table 3.
The albumin fractions in both studies were higher than globulins. The CSF albumin was ranged between 35.8 and 65.5% (4.2 to 13.3 mg/dl) in this study. The globulin percentage of the total protein in the CSF of
Fig. 2. Cerebrospinal fluid tapping from clinically normal Beagle dogs. A: Monocytes predominate and these cells show condensed nucleus and mildly vacuolated cytoplasm (Diff-Quik stain
×1,000). B: Activated macrophages predominate and these cells show pale foamy cytoplasm or highly vacuolated (Diff-Quik stain
×1,000). C: A lymphocyte cell is present (Diff-Quik stain
×1,000). D: An eosinophil is present (Diff-Quik stain
×1,000).
Table 3. Results of CSF protein electrophoresis in 13 Beagle dogs
Items tested
(fraction) This study (n = 13)
Mean
±SD (%) Previous study (n = 10)
*Mean
±SD (%)
Albumin 52.7
±8.9 37
±4.29
Alpha-globulin 16.5
±5.4 28
±5.27 Beta-globulin 24.8
±7.8 25
±5.31 Gamma-globulin 3.0
±1.5 7.75
±1.84
*
Cited from Sorjonen DC, 1987 [16].
Table 4. Results of serum albumin and albumin quota (AQ) ratio.
Dog No. Serum albumin (mg/dl) CSF
*albumin
(mg/dl) AQ
†1 3100 6.7 0.22
2 3100 10.9 0.35
3 3200 11.1 0.34
4 2700 7.4 0.27
5 3100 9.2 0.29
6 3100 7.5 0.24
7 3000 6.9 0.23
8 2800 4.2 0.15
9 2900 6.5 0.22
10 2800 5.5 0.19
11 2900 5.6 0.19
12 2800 6.1 0.21
13 3500 13.3 0.38
Mean
±SD 2990
±200 7.7
±2.6 0.25
±0.07
*