Introduction
Since the most reclaimed lands in Korea are distributed in the west and south coastal tidelands of the fluvio- marine or marine deposits, the lands are widely open and plain, and, thus, have been used as paddy for rice cultivation for a long time(Ryu et al., 1998). As the reclaimed area increased, multifunctionality of land use has drawn much attention in recent agriculture. The main constraints of the newly reclaimed from the tideland for crop production are soil salinity, high water table with poor drainage, and unfavorable soil chemical composition. Resalinization of the surface soil occurred by evapotranspiration during dry season makes the problem worse for upland crops to be cultivated on the newly reclaimed lands. These are closely related with groundwater quality. Soil problems are depended upon salinity control of soil and irrigated water in the reclaimed
lands(Jung, et al., 2002).
At the early stage of reclamation, soil and water management is focused on early desalinization and maintaining soil physical properties. As desalinization has proceeded, selection of crop and protection from resalination have become major concerns. In the processes of desalinization and resalinization, management of quality of irrigated water is important.
Soil problems and water quality management in a reclaimed lands, therefore, are tied closely each other.
Recent environmental stress is one of the important constrains for agricultural development in Korea. Water quality impact of agricultural activity should be controlled to match with environmental goal of a region.
Soil and water quality management researches in Korea have been conducted through national projects in the Rural Development Administration and the Korea Agricultural and Rural Infrastructure Corporation.
Though historical reclaiming tideland in Korea was long, the systematic development performed since 1960 ’ s as a
Received : 11 June 2007 Accepted : 2 August 2007*Corresponding author: Phone : +82332506444, E-mail : [email protected]
Soil Problems and Agricultural Water Management of the Reclaimed Land in Korea
Yeong-Sang Jung
1,
*and Chul-Hyun Yoo
21
College of Agriculture and Life Sciences, Kangwon National University, Chuncheon, R. O. Korea,
2
Honam Agricultural Research Institute, Rural Development Administration, Iksan, R. O. Korea
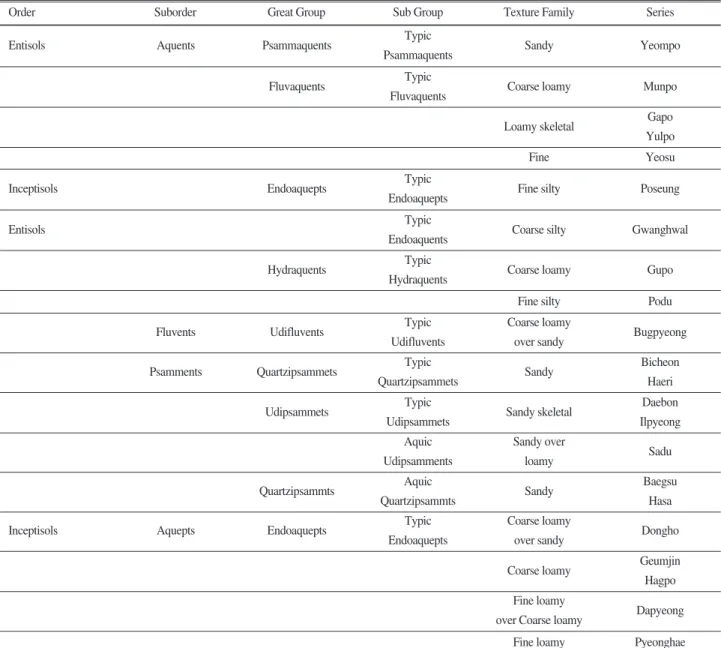
Soil problems and agricultural water management of the reclaimed land in Korea were reviewed through research results conducted in RDA and ADC. According to the Korean Soil Classification and Soil Survey(NIAST, 2002), the 5 soil orders with the 45 soil series were distributed on the fluvio-marine or marine deposit of the west and south coastal plains. Yeompo, Munpo, Hasa, Gwangwhal, and Poseung soil series were most commonly distributed soil on the fluvio-marine deposits, associated with tideland of the sea coast. Former 4 soils were Entisols, and the latest one was the Inceptisols. Buyong soil associated with Poseung series was an Alfisols. Extent of Myeongji soil, a Molisols, and Yongho soil, a Histosol, were minor.
Salinity control and management problems were closely related with high water table and low percolation rate due to plow-pan layer developed during the leaching process in the silty textured soil. For evaluation of field salinity, use of an electromagnetic inductance, EM38, with GPS was helpful to understand salinity status and field variability. Deep plowing, subsoiling and drainage improvement by tile drainage might be effective in paddy with plow-pan. New technology such as variable rate fertilization might save fertilizers and thus reduce environmental impact of agriculture on water quality. Water quality of agricultural water resources in reclaimed land was less adequate than that of inland water resources. Proper crop management is necessary depended upon quality for crop growth as well as to match with water quality target.
Key words: Soil problems, Water management, Reclaimed land
part of land development national project. The largest land development program, the Saemangeum Reclamation Project, is on-going in the Saemangeum area. This project is to reclaim 40,100 ha including the 28,300 land area and the 11,800 water resources area. We have been involved in the national research projects in these organizations. Outline of the main research results were well summarized in the publications, “Reclamation Agriculture”(HARI, 2002). We reviewed agricultural development, soil and water management technology for reclaimed lands, and distributed a manual, “Soil and Water Management in the Reclaimed Lands ” (Jung, et al., 2002). In this paper, we pointed out major soil problems and water quality management in the reclaimed lands in Korea based on these publications.
Soil characteristics of the reclaimed lands in Korea
Soil characteristics and soil taxonomy Fig. 1 shows the typical soil catena of the agricultural soils on the fluvio-marine deposit and tidal flat in the west coastal area. According to the Korean Soil Classification and Soil Survey(NIAST, 2002), the 5 soil orders with the 45 soil series were distributed on the fluvio-marine or marine deposit of the west and south coastal plains.
Yeompo, Munpo, Hasa, Gwanghwal, and Poseung soil series were most commonly distributed soil on the fluvio-
marine deposits, associated with tideland of the sea coast.
Former 4 soils were classified as the Entisols, and the latest one was done as the Inceptisols. Buyong soil associated with Poseung soil was an Alfisols. Extent of Myeongji soil, a Molisols, and Yongho soil, a Histosols, were minor.
The typical profiles of these soils were illustrated in the Fig. 2. The horizon showed that development of the soils was mainly depended upon ground water level. The soil color of the horizon developed under a high water table was dark grayish due to strong reduction, and little mottles could be found. The soil color above the water table was dark brown, grayish dark brown or dark gray with dark brown to yellowish brown mottles. The ground water level of the Yeompo soil was as high as 20 to 30 cm soil depth. The level of the Hasa soil was 90 to 100 cm. Those of Gwanaghwal and Poseung soils were in the middle. The drainage class of the Yeompo, Gwanghwal and Poseung soils, of which ground water level were hgih, were poorly drainage. The drainage class of the Munpo soil was imperfectly, and that of Hasa was moderatlely well.
A Yeompo soil was a mixed, mesic family of Typic Psammaquents, with fine sandy loam or loamy sand textural class. Since water table was high at 20 to 40 cm depth, drainage was poor and with a shallow available soil depth. Soil color of the surface soil was dark grayish.
Fig. 1. A typical soil catena of the agricultural soils derived from fluvio-marine deposit and tidal flat in the west coastal area in Korea.
B horizon were not developed showing no mottles and structureless. The color was gray.
A Gwanghwal was a coarse silty, mixed, nonacid, mesic family of Typic Endoaquents. A Poseung soil was a fine silty, mixed, nonacid, mesic family of Typic Endoaquepts. A Munpo soil was a coarse loamy, mixed, nonacid, mesic family of Typic Fluvaquents. A Hasa soil is a mixed, mesic family of Aquic Quartzipsamments.
Physical and chemical properties of the typic pedon of the five soils were summarized as: The clay content of the soil ranged from 3 to 25 percents, and silt contents did 2 to 70 percents, in order of Hasa, Yeompo, Munpo, Gwanghwal and Poseung soil. Hasa and Yeompo soils, sandy textured soils, were located on the nearest position to coast, while Poseung, a fine silty textured soil, was near to inland position. As the soils closer to coast, the soil texture was sandy. The organic matter content of these soils were low with a range from 2 to 8 g kg
-1, which was lower than the national average of 25 g kg
-1. The available phosphate and potassium contents were also low.
Saline soils in the Soil Taxonomy of the US Soil Conservation Service were classified in the Great Soil Group with following diagnostic horizons(SSSA, 1996):
- Natric horizon : a mineral soil horizon that satisfied the requirements of an argillic horizon, but that also has prismatic, columnar, or blocky structure and a sub horizon having >15 % saturation with exchangeable Na
+.
- Salic horizon : a mineral soil horizon of enrichment with secondary salts more soluble in cold water than gypsum. A salic horizon is 15 cm or more in thickness, contains at least 20 g kg
-1salt, and the product of the thickness in centimenters and amount of salt by weight is 600 g kg
-1.
Upon these category few horizons of the agricultural soils in the fluvio-marine deposit were belong to nitric or salic horizons. New category for the newly reclaimed land should be set up.
In the list of soil taxonomy of the fluvio-marine deposits(Table 1), no soil series were clearly classified as a saline soil in the Great Group. The primary reason was that the soil survey were conducted for the agricultural land use, of which salts were leached out enough for crop production. Taxonomical classification of the tideland or unleached newly reclaimed soils was still not set up yet.
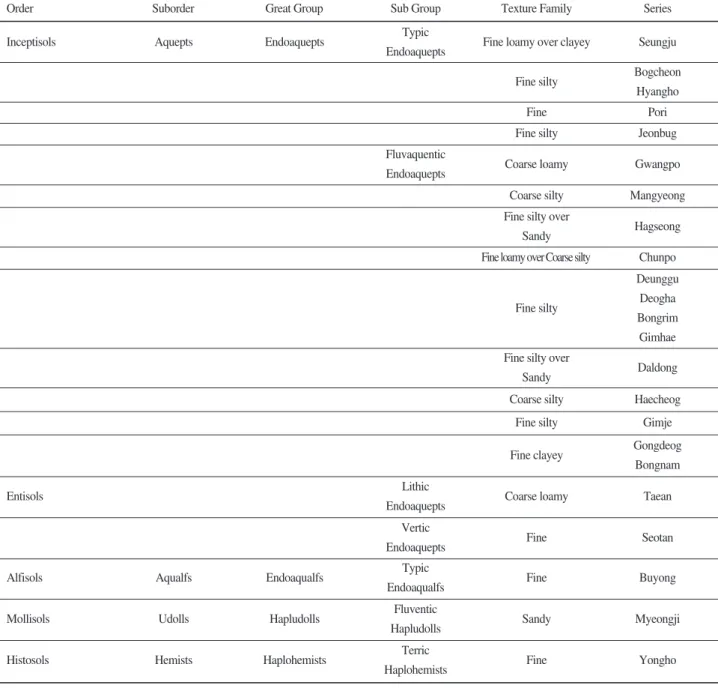
Land use pattern of reclaimed land Most of the
agricultural soils derived from the fluvio-marine deposit
were silty textured soils(Table 2). More than 80 percents
of the fine textured soils were used for paddy. The
proportion of the paddy of the sandy textured soils,
however, was lower than 70 percents. The fine textured
tidelands could be reclaimed earlier, because they located
near inland position of the fluvio-marine deposit, and
well adapted for paddy development and irrigation water
availability. The proportion of land use of the sandy
textured soils in the fluvio marine deposit for paddy was
Fig. 2. Soil profile description of the typic agricultural soils derived from the fluvio-marine deposits.as low as 55.2 percents(Jung et al., 2005). It implied that acreage of paddy development of the coarse textured tideland might be limited. As soils in the Saemangeum Project area were coarse textured soils, multiple land use were recommended.
Table 3 shows comparison of chemical properties of the newly reclaimed paddy soils surveyed in different reclamation project area(Ryu, 2005). The electrical conductivity, EC, of the Yeompo soil in 2000 was 5.8 dS m
-1ranged from 0.6 to 10.9 dS m
-1. The EC of the Podu soil was 7.9 dS m
-1ranged from 3.4 to 11.6 dS m
-1. Four years later, in 2004, The EC of the Yeompo soil and the Podu soil was 3.8 dS m
-1and 6.9 dS m
-1, as showing salt leaching of the soils.
The average soil pH ranged from 6.4 to 7.3. The highest pH was 8.3, so the soil was not belong to alkaline
soil. The organic matter content was low with range 3.4 g kg
-1to 14.3 g kg
-1. The available phosphate content was low, but available silicate was relatively high. The exchangeable sodium percent was as high as 43.7 percents.
Soil salinity and Irrigation water quality
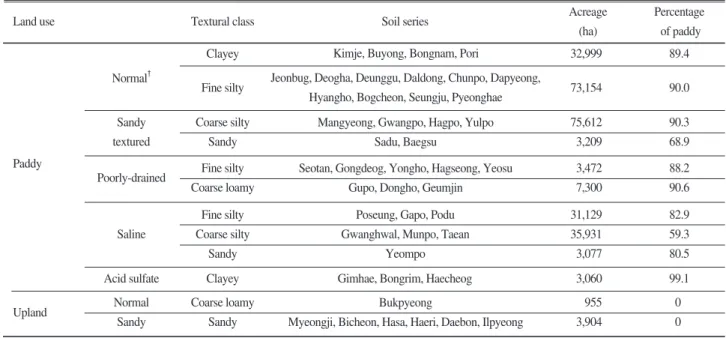
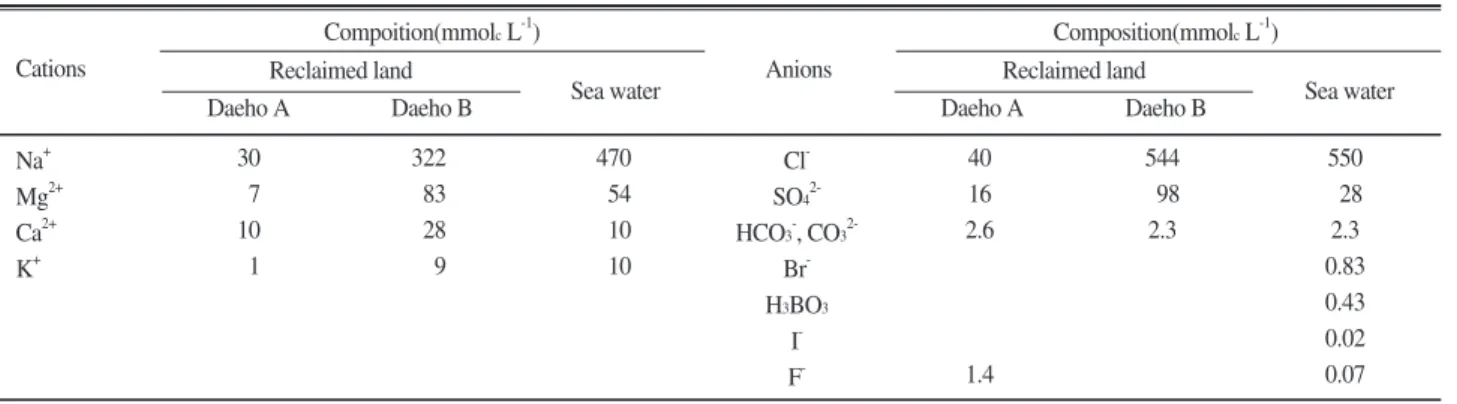
Salt composition in soil solution Origin of salts in the reclaimed land is sea water of which total salt content is 0.35 percents, and the NaCl content is 0.27 percents(Lee and Jung, 1991). The salt composition of a soil solution in the reclaimed soil differed by leaching status(Table 4).
Daeho A was the soil of which leaching proceeded fast, while that of Daeho B did slowly, respectively. Na/Ca ratio of the Daeho B soil, of which leaching proceeded
Order
Entisols Aquents Psammaquents Typic
Psammaquents Sandy Yeompo
Fluvaquents Typic
Fluvaquents Coarse loamy Munpo
Loamy skeletal Gapo
Yulpo
Fine Yeosu
Fine silty Podu
Fine loamy Pyeonghae
Series Texture Family
Sub Group Great Group
Suborder
Inceptisols Endoaquepts Typic
Endoaquepts Fine silty Poseung
Entisols Typic
Endoaquents Coarse silty Gwanghwal
Hydraquents Typic
Hydraquents Coarse loamy Gupo
Fluvents Udifluvents Typic
Udifluvents
Coarse loamy
over sandy Bugpyeong
Psamments Quartzipsammets Typic
Quartzipsammets Sandy Bicheon
Haeri
Udipsammets Typic
Udipsammets Sandy skeletal Daebon
Ilpyeong Aquic
Udipsamments
Sandy over
loamy Sadu
Quartzipsammts Aquic
Quartzipsammts Sandy Baegsu
Hasa
Inceptisols Aquepts Endoaquepts Typic
Endoaquepts
Coarse loamy
over sandy Dongho
Coarse loamy Geumjin
Hagpo Fine loamy
over Coarse loamy Dapyeong Table 1. Soil classification of the fluvio-marine and marine deposits.
slowly, was over 30, while that of Daeho A soil, of which leaching proceeded fastly was 1/30 of the former one.
Chloride and sulfate ions are dominant anion.
The main cations in soil solution are Na
+, Ca
2+, Mg
2+, and K
+, and the main anions are Cl
-, SO
42-, HCO
3-, NO
3-, and CO
32-at high pH as well as in seawater. NH
4+, NO
2-, and organic acids were commonly found minor ions.
together with B, Sr, Li, SiO
2, Rb, F, Mo, Mn, Ba, Al.
Some of these were minor essential nutritional elements.
Salt problem occurs as soluble salt concentration increased in the soil solution, which increases osmotic potential. The electrical conductivity, EC, of the soil solution is a commonly used for salt concentration index.
Osmotic potential and EC of a solution at 25 C shows following relation (US Salinity Laboratory, 1954):
Ψ
o(KPa) =- 40 EC(dS m
-1) (1) By this equation, osmotic potential decreases 40 kPa as EC increases 1 dS m
-1. If EC of a soil solution was 4 dS m
-1, the osmotic potential would be -160 kPa. At this water potential, a sensitive crop might respond as more than half of the soil water was depleted. Growth of the crop might be reduced.
Salinity evaluation Salinity evaluation of soil is based on soil salinity and sodium status of a soil. A widely
Order
Fine Pori
Fine silty Jeonbug
Coarse silty Mangyeong
Fine loamy over Coarse silty Chunpo
Coarse silty Haecheog
Series Texture Family
Sub Group Great Group
Suborder
Inceptisols Aquepts Endoaquepts Typic
Endoaquepts Fine loamy over clayey Seungju
Fine silty Bogcheon
Hyangho
Fluvaquentic
Endoaquepts Coarse loamy Gwangpo
Fine silty over
Sandy Hagseong
Fine silty over
Sandy Daldong
Fine clayey Gongdeog
Bongnam Fine silty
Deunggu Deogha Bongrim
Gimhae
Fine silty Gimje
Entisols Lithic
Endoaquepts Coarse loamy Taean
Vertic
Endoaquepts Fine Seotan
Alfisols Aqualfs Endoaqualfs Typic
Endoaqualfs Fine Buyong
Mollisols Udolls Hapludolls Fluventic
Hapludolls Sandy Myeongji
Histosols
HARI(2002)
Hemists Haplohemists Terric
Haplohemists Fine Yongho
Table 1. Continue
Land use Percentage of paddy Acreage
Soil series (ha) Textural class
Clayey
Fine silty Coarse silty
Sandy
75,612 3,209
90.3 68.9
73,154 90.0
Jeonbug, Deogha, Deunggu, Daldong, Chunpo, Dapyeong, Hyangho, Bogcheon, Seungju, Pyeonghae
Mangyeong, Gwangpo, Hagpo, Yulpo Sadu, Baegsu
32,999 89.4
Kimje, Buyong, Bongnam, Pori Normal"
Sandy textured Paddy
Upland
"
Normal : Normal(without peculiar limiting facor) Fine silty Coarse loamy
3,472 7,300
88.2 90.6 Seotan, Gongdeog, Yongho, Hagseong, Yeosu
Gupo, Dongho, Geumjin
Coarse loamy Sandy
955 3,904
10.1 10.1 Bukpyeong
Myeongji, Bicheon, Hasa, Haeri, Daebon, Ilpyeong Poorly-drained
Normal Sandy Saline
Acid sulfate Clayey Gimhae, Bongrim, Haecheog 3,060 99.1
Fine silty Coarse silty
Sandy
31,129 35,931 3,077
82.9 59.3 80.5 Poseung, Gapo, Podu
Gwanghwal, Munpo, Taean Yeompo
Table 2. Land use classification of the agricultural soils derived from fluvio-marine deposits.
Soil series
Soil series
CEC Na
Mg Ca
K mg kg-1
Ex. catiom (cmolckg-1) SiO2
P2O5
Reclamation project area OM
pH (1:5)
(1:5) g kg-1
’04
3.8 (0.2-7.2)
7.1 (6.0-8.2)
4.7
(3.4-6.0) Bojeon, Gyehwa
5.8 (0.6-10.9) Yeompo
1.4 (0.3-2.3)
6.5 (5.8-7.1)
5.8
(4.2-6.9) Hwanampo, Seosan A, Gyehwa 3.4
(1.7-5.0) Munpo
2.1 (2.0-2.2)
6.4 (6.2-6.8)
9.9
(7.6-12.3) Mandeog, Seosan, Gyewha 3.9
(2.5-6.7) Gwanghwal
’00년
EC(dS m-1)
2.9 (1.6-4.1)
7.3 (6.8-8.0)
9.6 (5.3-14.3)
Mandeog, Seosan A, Opo, Haechangman 4.7
(2.2-9.4) Poseung
6.9 (4,7-9.7)
7.8 (6.2-8.3)
9.5 (6.4-11.6)
Wando, Bojeon, Gangsan, Sopo, Haechangman, Oma 7.9
(3.4-11.6) Podu
2.1 (12-30)
82.5 (49-116)
1.2 (1.1-1.3)
3.7 (3.0-4.4)
4.9 (3.8-6.0)
3.7 (3.4-3.9)
6.4 (6.3-6.5) Yeompo
26.0 (22-30)
115.0 (61-146)
0.9 (0.5-1.6)
3.4 (2.4-5.4)
3.8 (1.5-6.8)
2.4 (1.0-4.4)
6.0 (3.8-7.2) Munpo
37.0 (26-55)
55.0 (12-150)
0.6 (0.5-0.9)
3.8 (3.4-4.1)
3.7 (2.0-4.9)
2.6 (1.6-3.3)
7.7 (6.8-8.2) Gwanghwal
26.5 (12-43)
146.5 (120-164)
1.2 (0.9-1.5)
7.0 (4.3-13.4)
5.1 (4.0-7.0)
4.5 (3.3-5.6)
10.4 (8.6-11.8) Poseung
16.8 (8-38)
169.5 (120-232)
1.1 (0.9-1.3)
7.1 (3.1-12.3)
4.9 (3.5-6.2)
4.7 (3.1-5.8)
10.6 (9.2-12.1) Podu
Table 3. Chemical properties of the soils in the reclamation project area.
Continue
adapted practical classification of soil salinity is based on electrical conductivity of saturated extract, ECe, and exchangeable sodium percents, ESP, or sodium adsorption ratio, SAR, by the US Salinity Laboratory(1954). The importance of SAR in soil solution was due to role of sodium on dispersion of clay and structural deterioration which was closely related with irrigation water quality as well. Table 7 shows the practical classification of a reclaimed land based on ECe and ESP or SAR. However, this criteria of salinity classification based on average value of soil test could not applied uniformly for a field because of spatial and temporal variation of soil salinity in a reclaimed land.
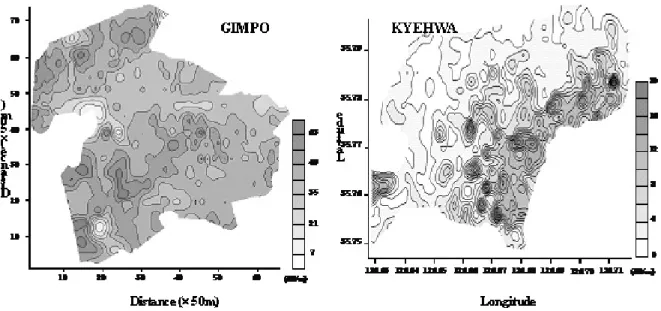
Fig. 3 demonstrates measurement of salinity distribution using a EM38 and a DGPS in a field, and Fig. 4 shows the salinity maps of two reclamation project areas. Electrical conductivity of the soil varied from 7 dS m
-1to over 60 dS m
-1. For site soil specific management of the reclaimed land with such a large spatial variation of salinity, salinity map might be helpful(Cameron, 1981).
Since main composition of salt in a reclaimed land was NaCl, the soil could be classified as salic soil at early stage of reclamation. As leaching proceed, the soil classification have to be changed. Since existence of salic layer in a reclaimed land is temporal, classification of a reclaimed land as salic soil might be of little meaning.
The soil classification should be reevaluted based on soil salinity at every leaching stage.
A saline soil is defined as “A non sodic soil containig sufficient salt to adversely affect the growth of most crop plants. The lower limit of saturation extract electrical conductivity of such soil is conventionally set at 4 dS m
-1at 25℃. Actually, sensitive plants are at half of this salinity and highly tolerant one at about twice this salinity” (SSSA, 1996). A saline-sodic soil is defined as
“A soil containing sufficient exchanageable sodium to interfere with growth of most crop plants and containing appreciable quantities of soluble salts. The exchageable sodium ratio is greater than 0.15, conductivity of the soil
Cations
Na+ Mg2+
Ca2+
K+
30 7 10 1
322 83 28 9
470 54 10 10
Cl- SO42-
HCO3-
, CO32-
Br- H3BO3
I- F-
40 16 2.6
1.4
544 598 2.3
550 528 2.3 0.83 0.43 0.02 0.07 Sea water Sea water
Composition(mmolcL-1) Compoition(mmolcL-1)
Daeho B Daeho A
Daeho B Daeho A
Lee and Jung, 1991
Reclaimed land
Reclaimed land Anions
Table 4. Composition of sea water and soil solution of a reclaimed land.
Soil
Ryu(2000) Normal Saline soil Saline and sodic soil Sodic soil
6.5~7.2 8.5<
<8.5
>8.5
<4
>4
>4
<4
<15
<15
>15
>15
<13
<13
>13
>13 ESP SAR
(%) ECe
(dS m-1) pH
Table 5. Practical classification of a reclaimed land.
Fig. 3. Field measurement of electrical conductivity by EM 38 and GPS (Jung et al., 2002).
solution, at saturated water content, of >4 dS m
-1at 25℃, and the pH is usually 8.5 or less in the saturated soil” . These terms, however, will be no longer used in SSSA publication.
Salinity classification based on agronomic purpose In agronomic view, the purpose of salinity classification is forwarded to production of a crop with economic harvest. Yield of salt sensitive cucumber decreases at ECe of 2.5 dS m
-1. Yield reduction at ECe of 6 dS m
-1might be 50 percents. the 50 percent yield reduction of the salt tolerant barley occurs at ECe of 16 dS m
-1.
An agronomic salinity classification based on crop response to ECe was in Table 6, and salt resistant classification of various crops was in Table 7. ECe of 2 dS m
-1might be a criteria for little damage for the most
crops though ECe of 4 dS m
-1was salinity limitation for normal soil by US Salinity Laboratory saline and sodic
Fig. 4. Salinity map obtained from EM38 measurement(Jung et al., 2002).Soil salinity
(FAO, 1995)
ECe
<2.0 Non -saline
2.0˜4.0 Very-slightly
4.0˜8.0
8.0˜16.0
≥16.0 Slightly
Moderately
Strongly
Crops
Little damage for most crops Yield reduction of sensitive crops
Limit fruit and ornament trees Yield reduction of most crops
Limit vegetable crops Yield reduction of salt tolerant crops
Limit grain crops Limit most crop production Limit economic production of crops
Grow salt tolerant halophytes Table 6. Salinity classification for agronomic purpose.
Fig. 5. Schematic relationship between yield index and electrical conductivity of the saturated extract of a soil(Jung, et al., 2002).
soil classification(1954). The salinity in these tables was for medium to fine textured soils. The soil water content at the field capacity of these soils would be 1/2 of the saturation percents, the electrical conductivity at the field capacity was assumed one half. In a sandy or loamy sand, soil water content at field capacity might be 1/4. For a sandy or loamy sand soil, ECe of these tables should be one half. Soil water status, therefore, had to be taken into account on salinity evaluation in terms of actual plant growth in field.
Soil management in the reclaimed lands
Soil problems in the reclaimed land related with salt effect A reclaimed land has much advantage in agricultural management for its wide open and plain geography with plenty water resources, and thus are used paddy for rice production for a long time (Ryu et al., 1998). The major problems other than salt concentration are also caused by such these characteristics. The problems include high ground water level and low permeability due to hard pan development are these.
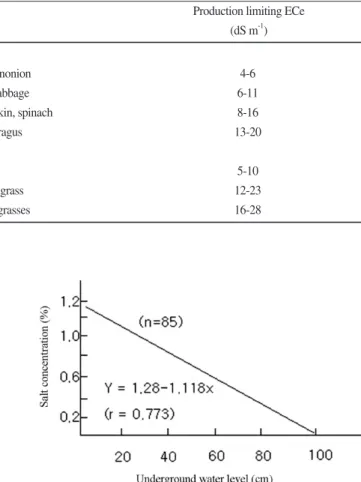
Ground water level
In a reclaimed land, high water table might lead high salt content in the soil(Fig. 6). In most soils with a shallow water table, water rises into the active root zone by capillarity and, if the water table contains salts, it becomes a continual source of salts to root zone as water is used by crop or evaporates at the soil surface. The rate of soil salinity accumulation from an uncontrolled shallow water table will depend upon irrigation management, salt concentration, and depth of water table. Poor drainage limits leaching during the ponding period, and leads salt accumulation by capillary rise during winter by surface evaporation. For efficient
leaching, drainage improvement is essential.
Formation of pan layer with low permeability.
Formation of hard plow layer with low hydraulic conductivity in subsoil could be found easily in a silty soil of the reclaimed land. This layer limits permeability and root expansion. The primary reasons are dispersion effect of electrolytes and compaction by continuous plowing. A hardpan may be formed. Since this layer was formed gradually as the land were used as paddy for long time as leaching proceeded, the paddy with this layer were call “degraded salt affected soil” , a soloth- like soil. Most silty textured soil derived from fluvio marine deposits showed potential development of this layer.
Changes in hydraulic conductivity and soil resistance were measured in the Daeho reclamation project area reclaimed in 1984, of which soil texture was silt loam.
The hydraulic conductivity in soil before experiment was 1.89 × 10
-7m s
-1, which was relatively lower compared to a typical fine sand loam soil. The hydraulic conductivity in top 20cm soil was 1.32 × 10
-6m s
-1with
Salt tolerance
(FAO, 1995) Crop
Very sensitive Sensitive Moderate Tolerant Graze
Sensitive Moderate Tolerate
4-6 6-11 8-16 13-20
5-10 12-23 16-28 Green beans, beans, ononion
Cucumber, chinese cabbage Tomatoes, broccoli, pumpkin, spinach
Barley, wheat, asparagus
Clovers Tall fescue, orchard grass Wheat grass, Hybrid grasses
Crops Production limiting ECe
(dS m-1) Table 7. Salt tolerant of different crops and production limiting ECe
Fig. 6. Salt concentration depended upon depth of water table (HARI, 2002).
large variability, while the hydraulic conductivity below 20cm soil depth was 3.44 × 10
-7m s
-1with less variability (data not shown). Hydraulic conductivity changed variably depending on tile drainage. The hydraulic conductivity in soil with tile drainage, which improved soil physical properties resulting in vigorous tall fescue growth, was remarkably higher showing 6.79
× 10
-7m s
-1than the plot without tile drainage shown in Table 7.
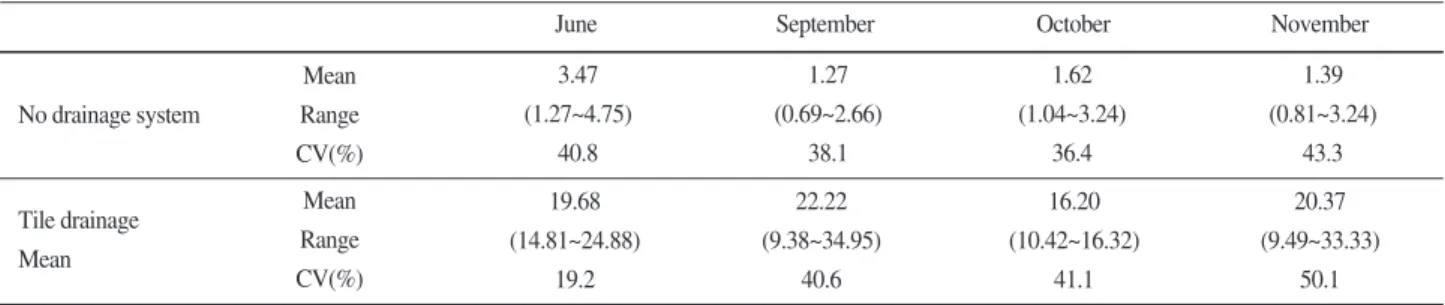
Table 9 shows difference in hydraulic conductivity measured in different season. The averaged hydraulic conductivity in the absence of tile drainage system was much greater than that with tile drainage system. The hydraulic conductivity without tile drainage in November 2000 was more than ten times higher than that with tile drainage system.
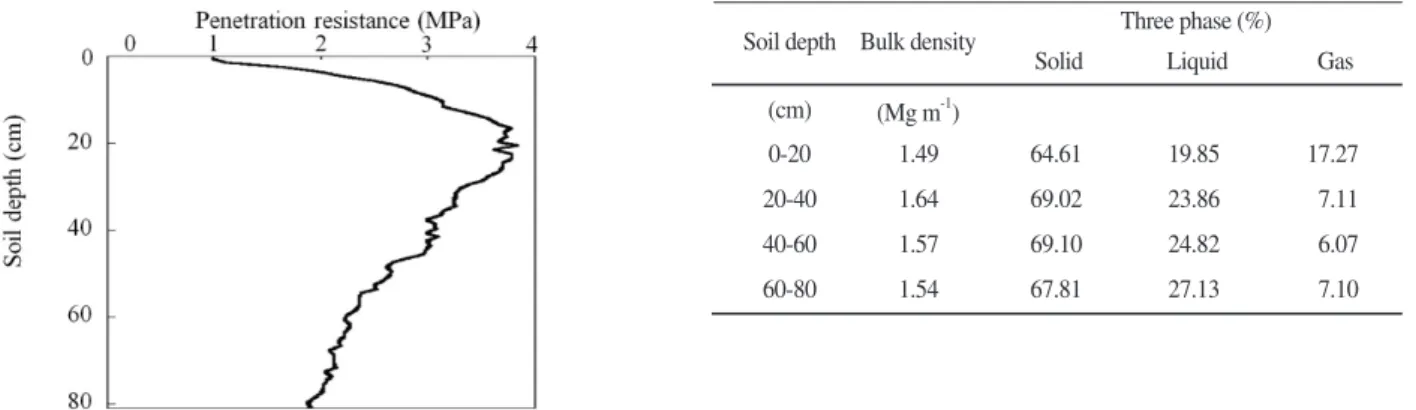
Field soil penetration resistance was measured using a dynamic penetrometer in field. Table 10 and Fig. 7 show penetration resistance in soil by depth. The penetration resistance of the soil just after field preparation was nearly consistent across soil depth, which had penetration resistance value of less than 1 Mpa. This implies that reclaimed soil profile at early stage did not develop soil structure and compaction. In contrast, the penetration
resistance of the soil in yr 2000 varied ranging from 0.05 to 9.99Mpa. The pattern of downward distribution of penetration resistance indicated that the hardened layer was placed at the depth of 20-40 cm where the hydraulic conductivity was abruptly decreased. The hardened soil horizon might interrupt appropriate rooting for crop production. Also, it could make desalinization unfavorable due to extremely low permeability. Locher et al.(1990) mentioned that root can be grown without any interruption at penetration resistance values below 1.5Mpa, and the upper limit for uninterrupted root growth is 3Mpa. Therefore, subsoiling of hardened soil horizon might be needed for appropriate rooting. Also, application of organic fertilizer such as manure and farm compost is necessary.
Fig. 8 and 9 show changes in soil hardness measured by Yamanaka soil hardness index along the year after reclamation. Among 226.1 thousand ha of the reclaimed lands, the layer development were strong in the 13.15 thousand ha, and development was in process in the rest.
The soil profile amendment to improve soil physical properties might be necessary for 33% of the total paddy land.
Hydraulic conductivity in soil (×10-7m s-1)
( ): standard deviation
"
Modified inversed auger hole method by sand fill technique Before experiment
1.89 6.79
(1.38)"
2.89 (1.01)
2.02 (0.66) Tile drainage with healthy Tall
Fescue growth Poor Tall Fescue growth Control
Table 8. Comparison of hydraulic conductivity in a reclaimed land by tile drainage in Daeho reclaimed land.
Soil depth (cm) Penetration resistance (MPa)
2.71 0.05~8.88
3.41 0.25~9.99
2.63 0.18~7.41
2.11 0.05~5.70
60-80 40-60
20-40 0-20
Table 10. Penetration resistance in reclaimed soil by depth.
November October
September June
Mean Range CV(%) No drainage system
3.47 1.27 1.62 1.39
(1.27~4.75) (0.69~2.66) (1.04~3.24) (0.81~3.24)
40.8 38.1 36.4 43.3
Mean Range CV(%) Tile drainage
Mean
19.68 22.22 16.20 20.37
(14.81~24.88) (9.38~34.95) (10.42~16.32) (9.49~33.33)
19.2 40.6 41.1 50.1
Table 9. Hydraulic conductivity( ×× 10-7m s-1) measured four times in year 2000 in Daeho reclaimed land.
Management practices for paddy with low permeability in the reclaimed land Deep plowing or subsoiling may improve physical properties through destruction of structure of the deep soil in a degraded
reclaimed land (Fig. 10). The bulk density of the subsoil decreased and permeability was increased by subsoiling.
Improvement of these physical properties of the soil increased rice yield and nitrogen use efficiency(Table 11).
The percolation rate of a paddy in the degraded salt affected soil was lower than 2 mm day
-1, but it increased to 10 mm day
-1as ground water table was lowered.
Puddling of the surface with low permeability degraded salt affected soil might limit workability of tractor rotary.
The number of workable day after heavy rain in a conventional paddy was longer than 5 days, while it in a subsoiling treatment paddy was 3 to 4 days.
The drainage condition affect effectiveness of fertilizer efficiency in a degraded salt affected soils. In a low
Fig. 7. Penetration resistance, bulk density and three phases by soil depths in 2000 (Jung et al., 2004).Soil depth
0-20 20-40 40-60 60-80
1.49 1.64 1.57 1.54
64.61 69.02 69.10 67.81
19.85 23.86 24.82 27.13
17.27 7.11 6.07 7.10 Gas Three phase (%)
Liquid Solid
(Mg m-1) (cm)
Bulk density
Fig. 8. Changes in soil hardness in Munpo paddy along the
years after reclamation(Ryu, 2005). Fig. 9. Changes in soil hardness in Gwangwhal and Poseung paddy soils along the years after reclamation(Ryu, 2005).
Treatment
(Ryu, 2005) Conventional Farming Deep plowing Subsoiling
35.3 47.4 51.4
32.0 58.8 62.4
5.42(100) 5.64(104) 5.85(108) Yield (Mg ha-1) N Efficiency
(%) N uptake
(Kg ha-1)
Table 11. Effect of deep plowing and subsoiling on nitrogen efficiency and yield of rice in a paddy soil with Plow-pan.
Fig. 10. Formation of plowpan and subsoiling effect in a reclaimed land (Ryu, 2005).
permeability paddy, the rice yield increment by 10 MT of compost application, but was decreased by 1.5 MT treatment or heavy nitrogen application. In a moderate permeability paddy, yield increased by 55 percents by these fertilizer application. Drainage improvement by subsoiling increased rice yield by 11 to 14 percents.
Precision farming and variable rate fertilization Precision farming is regarded as a renovative technology for sustainable agriculture in the 21st Century(NRC, 1997). It is a new technology that modifies the existing techniques and incorporates new high technology including GIS, GPS, and differential applicator to produce a new set of tools for the farmer to use. With new technologies for positioning equipment in the field, a new way of collecting and analyzing data was possible.
Yield monitoring, tillage depth, fertilizer application and chemical placement are typical of the information database that can be established using GPS/GIS system.
Site specific tillage and planting can be scheduled for individual plot within the field. Management decisions can be based upon several years of information along with the historical data for weather. By having accurate data on inputs and outputs better measures of profitability are realized. Excessive use of chemical is eliminated. By utilizing better ground cover, soil erosion and, therefore,
water pollution can be reduced.
Precision farming, however, has constraints for individual farming practices. For example, farm size or parcel unit of each farmer is too small to adopt the precision agriculture on farmhouse-hold bases and farmer’ s ability to adopt the new technology is limited.
However, it would be appropriate to establish local or regional cooperatives to operate such a precision farming system. It is recommended that Government provide sufficient incentives to help establish local and/or regional cooperatives.
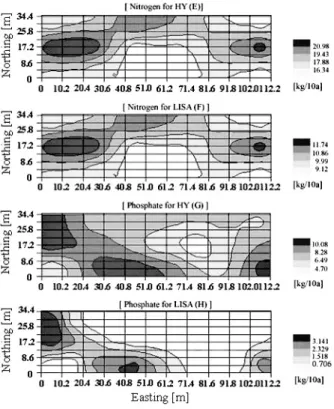
Variable rate nutrient recommendation is an application of precision farming. Fig. 11 shows the map of variable rate fertilizer recommendation for high yielding management (HY), and for low input sustainable agriculture (LISA) management. The nitrogen fertilizer recommendation (NFR) for high yielding management was ranged from 14.7 to 22.7 kg 10a
-1with the average of 18.0 kg ha
-1. The NFR for sustainable management was ranged from 9.12 to 12.0 kg 10a
-1with the average of 10.1 kg 10a
-1. The phosphate fertilizer recommendation (PFR) for high yielding management was ranged from 7.9 to 25.0 kg 10a
-1for high yielding management with the average of 7.9 kg 10a-1. The PFR for sustainable management ranged from null to 4.0 kg 10a
-1with average of 0.9 kg 10a
-1. Fig. 12 shows the layout of field application of nitrogen for variable rate fertilization of nitrogen.
Table 12 shows comparison of unhulled rice yield of the control plot and the VRT(Variable Rate Treatment) plot in 2002, and of the farmers’field in 2003. The average yield of unhulled rice from the VRT plot was 660.6 kg 10a
-1, which was 33.8 percents increment in comparison with the yield from the control plot farmed by conventional management based on the standard soil test. The yield from the control plot showed large
Fig. 11. Nitrogen and phosphate fertilizer recommendation for high yield (HY) management and for low input sustainable management (Jung et al., 2005).
Fig. 12. Variable rate application of nitrogen in an experimental farm (Seo et al., 2002).
variability ranged from 196.2 kg10a
-1to 643.5 with the CV of 64.1 percents. The yield from the VRT plot, however, showed a low CV of 9.2 percents. The range of the yield was from 587.4 kg -110a to 872.6 kg 10a
-1. The amount of nitrogen saved by VRT was 2.8 kg 10a
-1. The VRT in the three volunteered farmers’field showed higher yield than the conventional management as high as 4 percents in Field 1 though nitrogen applied was 0.8 kg/10a less. In Field 2 and 3, the yields were little difference between the control and VRT, while the amount of nitrogen saved was 3.7-5.6 kg -110a. We concluded that VRT could save nitrogen fertilizer by 21 percents even in the volunteer farmers field without yield decrease.
A cost and benefit was analyzed for variable rate fertilization by soil test (Table 13). In this analysis, the field size was assumed 8 ha farm and 5-year periodic soil test. The cost of GPS and fertilizer applicator was 6,000,000 won per 25 ha per 10 annum. The cost of soil test estimated was 100,000 won per ha. The total cost
required for VRT was 992,000 won, while the return was 306,384 won. The net benefit was 685,626 won. Since the major reason of negative benefit was due to soil test, governmental support on this budget should be recommendable in terms of multifunctionality enforcement to reduce fertilizer use and environmental protection effect.
Protection from erosion Soil erosion damages by loss of productivity and cause of sediment pollution.
Since reclaimed lands are plain and the most land are used for paddy, soil erosion problem was often neglected.
In Korea, soil erosion studies were focused on water erosion and so were soil conservation studies for sloping land, and little studies were conducted on wind erosion.
For water erosion, the amount of erosion can be estimated by the universal soil loss equation, USLE (Wischmeier and Smith, 1965) as:
A = R × K × LS × C × P (1)
Status : Direct seeding 8 ha farm, 5 year periodic soil test Cost(won)
Additional cost Additional return
GPS Soil test Total Net benefit
Total additional return - Total additional cost = -685,626 192,000 800,000 992,000
Yield increase Fertilizer save
Total
226,593 39,715 306,384 Return(won)
Table 13. Cost and benefit analysis of variable rate fertilization by soil test.
Average Min Max SD CV(%)
493.6 196.2 643.5 316.2 364.1
660.6 587.4 872.6 360.72 339.2
541.9 424.9 623.3 350.8 339.4
565.0 480.4 675.8 351.84 339.2
719.2 433.7 1017.9
114.8 16.0
704.9 371.9 976.8 112.8 316.0
708.1 651.8 789.6 327.8 333.9
711.5 657.2 766.9 329.4 334.1
"
Control :Farmers field managed by conventional farming nearby the experimental plot
‡ Volunteer farmers were well experienced and good farmers following guidance of sustainable agricultural practices.
Jung(2005) Average N applied (kg 10a-1)
13.6 11.8 13.3 12.5 15.7 12.0 17.5 11.9
VRT Cont
Field 3 Field 2
Field 1
Volunteer farmer’s field‡, 2002 Unhulled rice yield (kg 10a-1)
Experimental field, 2001
VRT Cont
VRT Cont
Cont" VRT
Table 12. Comparision of the rice yield between control and the variable rate treatment of nitrogen in the experimental field and the farmers field.
where
A : annual soil loss (MT ha
-1yr
-1)
R : rainfall and runoff erosivity(MJ mm ha
-1yr
-1hr
-1) K : soil erodibility(=A/R, MT ha
-1MJ
-1mm
-1) LS : Slope length and steepness(dimensionless) C : cover-management(dimensionless)
P : support practice(dimensionless)
For example, the R factor in the Gunsan area was 4,190 MJ mm ha
-1yr
-1hr
-1. The K factor for a silt loam was 0.053. The LS factor for a field with 1 percents slope and 50 m slope length was 0.15. If a farmer grow cabbages with the C factor of 0.4 by contour with P factor of 0.6, then annual soil loss A = 4,190 × 0.053 × 0.15 × 0.4
× 0.6 = 8.0 MT ha
-1yr
-1. This loss was lower than the tolerant level of 11 MT ha
-1yr
-1. Korean soil conservationists and farmers used to neglect soil erosion in the reclaimed land. This might mislead environmental impact of erosion, because wind erosion should be taken into account.
Wind erosion problem could not occur during the rice cropping period by flooding. However, during the winter and early spring with no vegetation cover, wind erosion could cause problem in a sandy textured soil. Especially in the Saemangeum Reclamation Project Area, wind erosion might cause environmental problems.
Wind erosion could be estimated by a wind erosion prediction equation by Siddoway and Woodruff(1954) as:
E = f(I, C, K, L, V) (2) where, E = annual wind erosion, I = soil factor, C = climatic factor, K = soil surface roughness factor, L unsheltered length of field factor, and V = vegetation cover factor, respectively. Table shows an estimation of wind erosion by climatic factor C’for a sandy soil with soil factor I of 400, and for a silt loam with I of 100 in Gunsan(Table 14). Proper management of water control of soil surface and vegetative coverage were recommended. The wind erosion problem might be severe during the early stage of reclamation development.
Water quality of irrigation water
Water quality of water resources in reclaimed land
Water quality of agricultural water resources in reclaimed land was summarized with that in the inland resources in Table 15. EC, pH and most water quality indices were high in the agricultural water resources in reclaimed lands. The average EC of the reclaimed land resources was 1.34 dS m
-1ranged from 0.06 to 11.9 dS m
-1, while that of the inland resources was 0.13 dS m
-1ranged from 0.03 to 0.41 dS m
-1. The sodium concentration in the reclaimed land water resources was 7.8 mmolc L
-1and was 0.40 mmolc L
-1in the inland water. The sodium adsorption ratio, SAR, was 4.69 and 0.62, respectively.
Linear relationship between log(EC) and log(SAR) could be obtained(Fig. 13). Most inland water quality data scattered low, while reclaimed land data showed
Month
(Jung et al., 2004) 1
2 3 4 5 6 7 8 9 10 11 12 Annual
-0.39 0.82 4.99 11.20 16.49 20.99 24.89 25.66 21.20 15.09 8.25 2.34 12.63
33.62 34.22 47.67 84.22 86.92 147.85 229.90 249.10 128.67 54.94 55.59 34.43 1187.11
3.89 4.34 4.64 4.39 4.09 3.73 3.54 3.64 3.65 3.67 3.86 3.78 3.94
0.62 4.04 4.31 4.08 3.81 3.47 3.29 3.39 3.40 3.41 3.59 3.51 3.66
0.27 0.46 0.55 0.30 0.36 0.13 0.06 0.06 0.16 0.58 0.35 0.39 3.67
1.09 1.84 2.20 1.20 1.44 0.52 0.23 0.22 0.65 2.32 1.40 1.56 14.68
0.27 0.46 0.55 0.30 0.36 0.13 0.06 0.06 0.16 0.48 0.35 0.39 3.67 Silt loam
soil (I=100) Sandy
soil (I=400) 10m
corrected At
14.5m
C’factor Precipitation
(mm) Temperature
(℃)
Predicted Wind erosion (Mg ha-1yr-1) Wind speed
(m s-1)
Table 14. Climatic wind erosivity and predicted wind erosion in Gunsan area.
high and linear relationship with equation:
log(SAR) = 0.775 (log EC) -1.700
With this relationship, EC of 0.70 dS m
-1corresponded to SAR of 5.0, and EC of 4.2 dS m
-1did SAR of 13, respectively.
A guideline for irrigation water quality
A guideline for irrigation water quality are given in Table 16, slightly modified from FAO(1987), that emphasized the long- term influence of water quality on crop production, soil conditions and farm management. The guidelines are practical and have been used successfully in irrigated agriculture for evaluation of the common consituents in surface water, groundwater, drainage water, sewage effluent and wastes water. This table is a management tool, and dose not include unusual or special water
constituents sometimes found in waste water, such as heavy metals, pesticides and organics. Some heavy metals are micronutrients as well.
Recent agriculture emphasizes on effect of irrigation on environments. Nitrate and ammonium are nitrogen nutrients and also are major pollutants of a water system.
Jung et al. (1997) suggested that use of the agricultural water of which nitrate-N concentration and EC were lower than 5 mg L
-1and 0.75 dS m
-1would not limited for any crop damage. In using agricultural water of which nitrate nitrogen concentration was between 5 to 30 mg L
-1and EC was over 0.75 to 2.5 dS m
-1, nutrient management should be taken into account. The irrigation water of which nitrate concentration exceeded 30 mg L
-1and EC was higher than 2.5 dS m
-1should be under control.
Assessment of the water quality for the agricultural water resources based on land use in the watersheds was attempted for the water quality data collected in 2001 by Korea Agricultural & Rural Infrastructure Corporation.
The 352 agricultural watersheds were selected of which information on the watershed area, land use, number of farmers and livestocks was available.
Table 17 shows the summary of the indices to assess water quality were PTA(paddy density), UPA(upland density), PeA(people density), ADEN(animal density) in respect to total area of the watershed. ADEN was calculated based on the equivalent number of cow, 8 pigs and 100 hens were equivalent to 1 cow.
Water quality
"
SAR = [Na+]/{([Ca2+] + [Mg2+])/2}1/2
‡Revised from KARICO(2000) pH
EC(μS cm-1) BOD(mg L-1) COD(mg L-1) TN(mg L-1) TP(mg L-1) SS(mg L-1) K(mmolcL-1) Na(mmolcL-1) Ca(mmolcL-1) Mg(mmolcL-1) SAR"
8.2 1,337
4.6 9.8 2.9 0.14 17.2 0.41 7.77 1.21 2.11 4.69
6.5~9.5 58~11946
0.3~43.0 3.8~35.2 0.27~17.10
0.01~1.47 1.90~17.12 0.02~2.38 0.10~75.86 0.18~4.13 0.10~19.68 0.17~22.0
7.8 131 4.0 6.6 1.9 0.08 11.4 0.11 0.40 0.57 0.24 0.62
6.0~10.1 27~407 0.3~16.7 1.4~19.2 0.5~9.3 0.01~1.20 0.12~11.38 0.01~0.66 0.05~2.22 0.11~2.03 0.05~1.50 0.17~1.67 Range Average
Range Average
Reclaimed lands Inlands
Water resources
Table 15. Water quality of agricultural water resources of the reclaimed lands and the inlands.
Fig. 13. Relationship between EC and SAR of water of water resources in the reclaimed land and inland.
The mean BOD of the agricultural water resources was 4.11 mg L
-1ranged from 0.30 mg L
-1to 4.11 mg L
-1. The mean T-N and the mean T-P were 1.92 mg L
-1and 0.07 mg L
-1. In comparison, the mean BOD of the watershed without land use other than forest was 1.52 g L
-1ranged from 0.70 g L
-1to 3.0 g L
-1and the mean T-N and T-P were 0.92 mg L
-1and 0.01 mg L
-1, respectively(Detailed data were not shown). The statistical model analysis showed high correlation between measured BOD and predicted BOD by PTA, UPA, PeA and ADEN indices for agricultural region without industry. The derived equation was:
BOD = 0.058 ADEN + (1.543 +0.792 PeA +5.124 PTA + 11.259 UPA) (3) R2 = 0.465***, n= 352
In the equation, the coefficient of UPA was twice to PTA, that implies the contribution of upland to environmental load might be greater than that of paddy.
Applying national average of PTA 0.12, UPA 0.08, PeA 4.7 and ADEN 7.76 to the equation, the impact of upland use was 36.0%, paddy use 18.7 %, livestock 20.6 %, and people 24.6%.
Ministry of Environment of Korea controls water quality by laws and regulations. The objectives and development of environmental laws are to improve environmental quality. Environmental laws can be regarded as laws that specify people’s rights as guaranteed by the Constitution, namely, the right for people to live pleasant and safe lives in a sound and healthy environment. That is, people have the basic right
Potential irrigation problem
Salinity(affect crop water availability) EC
TDS
Infiltration(soil structure) EV at SAR =0 - 3
= 3 - 6
= 6 - 12
= 12 - 20
= 20 - 40 Specific ion toxicity
(Sensitive crops) Sodium(Na)
Chloride(Cl)
Miscellaneous effect (Sensitive crops) Nitrate Nitrogen (NO3-N) Ammonium nitrate (NH4-N)
pH 6.5-8.4
Modified from FAO(1987)
SAR mmolcL-1 mmolcL-1
Mg L-1 Mg L-1
< 5
<1
5 - 30 1 - 6
>30
>6
<3
<3
<4
3 - 9
>3 4 - 10
>9
>10
dS m-1 > 0.7
> 1.2
> 1.9
> 2.9
> 5.0
0.7 - 0.2 1.2 - 0.3 1.9 - 0.5 2.9 - 1.3 5.0 - 2.9
<0.2
<0.3
<0.5
< 1.3
< 2.9 dS m-1
mg L-1
<0.7
<450
0.7 - 1.0 450 - 650
1-2.5 650-1,600
2.5<
1,600<
Severe (IV) Moderate
(III) Slight
(II) None
(I)
Restriction on use Units
Table 16. Guidelines for irrigation water quality.
n=272, ADEN(Animal density), PeA(People density) > 0.01
PTA(Paddy area to watershed area), UPA(Upland area to watershed area)>0 Mean
Max Min Stdev
4.11 24.90 0.30 3.22
1.92 22.44 0.38 1.85
0.07 0.63 0.00 0.09
11.0 114.0 1.0 12.3
0.082 0.331 0.000 0.058
0.099 0.390 0.000 0.077
18.1 57.8 1.2 11.9
9.7 137.5 0.01 23.2
4.76 8.88 0.01 1.00 PeA Agr. ADEN
land use UPA
PTA SS
T-P T-N
BOD
--- mg L-1--- % head ha-1 Table 17. Water quality of the agricultural water resources and land use?of the agricultural watersheds.
to clean water, clean air, and the natural beauty of the land. Fig. 14 shows schematic diagram of environmental policy acts in Korea. A number of environmental laws were enacted more recently: the Soil Environment Preservation Act, which aims to prevent damage to human health and the environment due to soil contamination and to properly control and preserve soil;
the Drinking Water Act, which aims to control the quality of bottled water; and the Underground Living Space Air Quality Control Act, which aims to control air pollution of underground spaces such as subway stations.
Recently, the Total Pollution Load Policy was established to regulate total environmental load of pollutants from a watershed or a region. The policy action period had two steps, the first step period from 2004 to 2010, and the second step period from 2011 to
2015. In the first step, the target BOD of water quality of the 4 major river basin should be set up and regulations to get this target should be kept by pollutant load sectors.
This policy aimed both pollution sources, point source and non-point source. Fig. 15 shows the target water quality of three major river basin, the Nagdonggang, the Gemgang, and the Youngsangang river basins. The target of the Hangang river basin was not established yet, but was depended upon local government process. Since this target was set for water quality of river, the agricultural water quality standard was far beyond from this range. At present environmental load from agriculture was not clearly defined from regulation, but could be regulated by this regulation in the second step. At present environmental load from agriculture was not clearly defined from regulation, but would be regulated by this
Fig. 14. Environmental acts under the regulation of the Ministry of Environment.
policy in the second step.
References
Cameron, D.R., E. Dejong, D.W.L. Read, and M. Oosterveld. 1981.
Mapping salinity using resistivity and electromagnetic inductive techniques. Can. J. Soil Sci. 61:67-78.
FAO. 1995. Water quality for agriculture. 28 Rev. 1.
FAO/UN:pp174
HARI. 2004. Reclamation agriculture. RDA:pp426
Jung, Y. S.. H. J. Lee, and J. G. Park. 2004. Field variability and variable rate fertilization of nitrogen in a direct seeding paddy for precision agriculture. JKSSSF.
Jung, Y. S., J. H. Joo, S. Y. Yoon. 2002. A Management guideline for soil and irrigation water in the reclaimed saline land. IAS., Kangwon Nat. Univ:pp234
Fig. 15. Target BOD of Total Pollution Load Policy in Korea (ME, 2004).
Jung, Y. S., J. H. Joo, S. C. Kwon, J. N. Im, M. H. Shin, K. W. Choi.
2004. Wind erodibility of the Saemangeum tideland reclamation project area. Korean J. soil Sci. fert. 37:207-211
Jung, Y. S., H. J. Lee, J. H. Chung, C. S. Kang, J. K. Park. 2005.
Field variability and variable rate fertilization of nitrogen in a direct seeding paddy for precision agriculture. J. KSSSF. 38:202- 210
Jung, Y. S., S. H. Yoo, Y. An, J. H. Joo, I. H. Yu. 2002. Changes in salinity, hydraulic conductivity and penetration resistance of a silt loam soil in a reclaimed tidal land. J. KSSSF 35:207-215
Lee, C. H., and Y. S. Jung. 1991. General Chemistry. KNOU Publ.:pp342
Lee, H. J., and Y. S. Jung. 1993. Sustainable farm management in crop production. International Symposium on Sustainable Agriculture and Environment. Sept 17, 1993. Seoul Nat. Univ.:31- 55
Lesch, S.M., J.D. Rhoades, L.J. Lund, and D.L. Corwin. 1992.
Mapping soil salinity using calibrated electromagnetic measurements. Soil Sci. Soc. Am. J. 54:290-293.
McNeal, B.L., D.A. Layfield, W. A. Norvell, and J.D. Rhoades. 1968.
Factors influencing hydraulic conductivity of soils in the presence of mixed salt solutions. Soil Sci. Soc. Am. Proc. 32:187-190
ME (Ministry of Environment). 2004. The total pollution load policy. www.me.go.kr
NIAST, National Institute of Agricultural Science and Technology.
1999. Nutrient Prescription for Various Crops(In Korean). NIAST, RDA:pp145
NIAST. 2000. Taxonomical classification of Korean soils. NIAST, RDA:pp809
NRC, National Research Council. 1977. Precision Agriculture in the 21stCentury. Geospatial and Information Technologies in Crop Management. National Academy Press. Washington, D. C. :pp149 Ryu, S. H. 2000. Dictionary of Soil Sciences(Korean). SNU
Publ.:pp 729
Ryu, S. H. Y. S. Jung, Yeol Ahn, and S. H. Lee. 1998. A study on the crop cultivation by the improvement of desalinization techniques on the reclaimed farmland. ADC:pp318
Seo, J. H., H. J. Lee, Y. S. Jung, S. H. Lee. 2002. Soil and yield mapping and nutrient recommendation for precision agriculture in rice paddy. J. Korean Society of Precision Agriculture 1(1):51-60 SSSA. 1996. Glossary of Soil Science Terms. Soil Science Society
of American:pp134
US Salinity Laboratory. 1954. Diagnosis and improvement of saline and alkaline soils. USDA Hb. 60:pp160
한국의 간척지에서 토양 문제와 농업 용수 관리에 대해 농촌진흥청과 농업기반공사 등에서 이루어진 연구를 통해 얻어진 결과를 토대로 하여 개관하였다. 한국토양분류와 조사에 의하면, 5개 토양목의 45개 토양통이 서남 해안의 하해혼성 또는 해성 퇴적지에 분포하고 있었다. 염포, 문포, 하사, 광활, 포승통이 해안의 간석지에 연접 한 하해혼성 퇴적지에 가장 많이 분포하고 있는 토양통들이었다. 염포 등 앞의 4개 토양통은 엔티솔이며, 포승 통은 인셉티솔이었다. 포승통과 연접한 부용통 등은 알피솔이었다. 몰리솔인 명지통, 히스토솔인 용호통 등의 분포 면적은 적었다. 염류도 제어와 관리 문제는 높은 지하수위와 미사가 많은 간척지 토양에서 제염 과정에서 생성된 경운 반층에 의한 낮은 투수 속도와 밀접한 관련이 있다. 포장에서 염류의 평가에 있어서 GPS와 결합 된 전자장 유도 EM38이 염류도와 포장 변이를 이해하는 데 유용하였다. 심경, 심토 파쇄, 암거에 의한 배수 개 선 등은 경운 반층이 형성된 논에서 효과적이었다. 변량 시비와 같은 신기술은 비료를 절감하고 수질에 대한 농업 영향을 감축시킬 가능성이 있었다. 간척지에서 농업용수의 수질은 내륙 수자원의 수질보다 열악하였다.
작물 생육에 알맞은 수질과 함께 목표 수질 달성에 맞추어 갈 수 있는 작물 관리가 필요하였다.
한국의 간척지에서 토양 문제와 농업 용수 관리
정영상1,*·류철현2
1강원대학교 농업생명과학대학 농업과학연구소, 2농촌진흥청 호남농업연구소