한수지 50(4), 421-428, 2017
421
Copyright © 2017 The Korean Society of Fisheries and Aquatic Science
pISSN:0374-8111, eISSN:2287-8815Korean J Fish Aquat Sci 50(4),421-428,2017
Original Article
서 론
독도는우리나라의가장동쪽에위치한섬으로
,
울릉도를포 함한독도인근해역은대마난류와북한한류가만나는극전선(polar front)
이형성되어영양염유입을통한식물플랑크톤생산력증가와이로인한높은밀도의동물플랑크톤이존재한다
(MOF, 1999; Kang et al., 2002).
이러한높은생산력으로인 하여난류및아열대성어종부터한대성어종까지다양한회유 성어종이서식하여수산생태학및자원학적으로중요한해역 이다(Myoung, 2002; Lee et al., 2010).
독도주변해역은지리 적인특성으로인하여독도의해양생태계를구성하는식물및 동물플랑크톤(Kang et al., 2002),
저서생물(Park et al., 2002),
해조상(Choi et al., 2009),
난자치어(Kim et al., 2004),
어류의 종조성(Lee et al., 2010)
등에대한다양한연구가불연속적으로진행되었다
.
이에국립수산과학원에서는생물학적으로큰 의미가있는독도인근해역에서2004
년이후로어획과음향조 사가동시에가능한조사선을이용하여매년지속적으로자원 조사를진행하고있다.
그중탐구21
호는2015
년건조된국 립수산과학원의수산자원전용조사선으로차세대음향장비는EK80
어군탐지기(Simrad, Norway)
와ME70
멀티빔어군탐 지기(Simrad, Norway)
등이국내최초로탑재되어있어고도 화된음향자료를획득할수있다.
독도인근해역및국내의연근해수산자원조사는주로자망
,
트롤등직접적인조사를통해서어종별종조성및현존량을 파악하고있다(Kim et al., 2010; Choi et al., 2012; Seo et al.,
2013).
이러한직접적인자원조사기법은종조성을명확히구분할수있는장점이있는반면에상대적으로많은시간과비 용
,
노동력등으로인하여시∙
공간적인분포적인특성을나타내음향 기법을 이용한 동계 독도 주변해역 매오징어(Watasenia scintillans) 및 기타어군의 분포 및 현존량 산정
이형빈*·윤상철
1·임양재
2·김정년
2·김맹진·최광호
국립수산과학원 서해수산연구소, 1국립수산과학원 독도연구센터, 2국립수산과학원 수산자원조사센터
Distribution and Biomass Using Acoustic Method of the Squid Watasenia scintillans Near Dok-do, East Sea of Korea
Hyungbeen Lee*, Sang Chul Yoon1, Yang Jae Lim2, Jung Nyun Kim2, Maeng Jin Kim and Kwang Ho Choi
Fisheries Resources and Environment Division, West Sea Fisheries Research Institute, National Institute of Fisheries Science, Incheon 22383, Korea
1Dokdo Fisheries Research Center, National Institute of Fisheries Science, Pohang 37709, Korea
2Fisheries Resources Research Center, National Institute of Fisheries Science, Tongyeong 53064, Korea
The spatial distribution and abundance of fish species was estimate near Dok-do, East Sea of Korea by conducting midwater trawl survey with hydroacoustic method. Acoustic and midwater trawl data were collected onboard the R/V Tamgu 21 during 7-8 March 2016. Acoustic data were collected at the frequencies of 38 and 120 kHz and converted to nautical area scattering strength (m
2/nmile
2). Species are distributed mainly over an extent of 30-55 m, generally around southwest of Dok-do; the squid Watasenia scintillans was the dominant species found. The length-weight function and target strength of squid and other fishes were used to estimate the W. scintillans stock at 2499.1 tons and other fish at 43.8 tons during the winter season. The hydroacoustic method offers an approach for the determination of the biomass and vertical and spatial distributions of species aggregating near Dok-do, East Sea of Korea.
Key words: Watasenia scintillans , Hydroacoustic survey, Mid-water trawl survey, Dok-do, Stock assessment
This is an Open Access article distributed under the terms of the Creative Commons Attribution Non-Commercial Licens (http://creativecommons.org/licenses/by-nc/3.0/) which permits unrestricted non-commercial use, distribution, and reproduction in any medium, provided the original work is properly cited.
https://doi.org/10.5657/KFAS.2017.0421
Korean J Fish Aquat Sci 50(4) 421-428, August 2017 Received 29 May 2017; Revised 3 July 2017; Accepted 31 July 2017
*Corresponding author: Tel: +82. 32. 745. 0616 Fax: +82. 32. 745. 0569
E-mail address: [email protected]
이형빈
ㆍ
윤상철ㆍ
임양재ㆍ
김정년ㆍ
김맹진ㆍ
최광호422
는데많은기회비용이필요하다
.
반면간접적인기법중하나인 과학어군탐지기(
이하과학어탐)
를이용한조사는다양한어종 에대한종조성을명확히구분할수는없지만빠른시간내에 넓은해역에대한어류의시∙
공간적인특성을파악할수있는 장점이있다(Simmonds and McLennan, 2002).
따라서국내뿐 만아니라전세계적으로어획조사와음향조사를병행하여어 류의시∙
공간적인분포및변동그리고우점하는어종에대한 현존량파악에대한연구가진행되고있다(Von Szalay et al., 2007; Zwolinski et al., 2012; Kang et al., 2015).
본연구에서는독도인근해역에서어획과음향기법을이용 한수산자원조사를실시하였다
.
음향정선에대해서음향자 료를획득하였고,
음향조사전,
후어류가분포하는수중에대 해서중층트롤조사를통해어획자료를획득하였다.
두기법으 로획득한자료를비교하여중층어류신호분석및조사해역 의주요어종인매오징어와기타어획된어종의현존량을파악 하였다.
재료 및 방법
본연구는독도주변해역에서
2016
년3
월7
일부터8
일까지국 립수산과학원수산자원조사선인탐구21
호(R/V Tamgu 21)
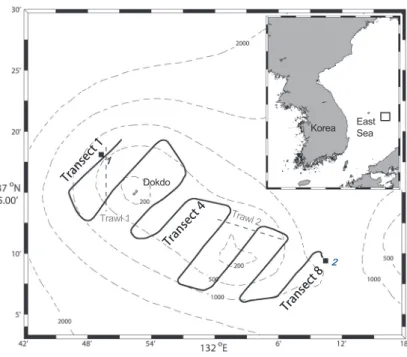
를 이용하여트롤어획및생물음향조사를병행하여실시하였다(Fig. 1, Table 1).
음향조사는조사선에설치된선저형과학어 탐(EK80; Simrad, Norway)
을이용하였다.
조사에사용한음향 센서는분할빔(split-beam)
방식의38 kHz
와120 kHz
주파수 로,
펄스폭(pulse length)
과송파간격(transmission interval)
을 각각1.024 ms
와0.25 pings/s
로설정하여음향자료를획득하 였다(Table 2). EK80
은장비의특성상Narrow-Band Continu- ous wave
모드(NB CW)
와Wide-Band Frequency Modula- tion
모드(WB FM)
로운영이가능하다. NB CW
모드는기존의
EK60
과동일한단일주파수에대하여음향신호를송∙
수신하는기법이고
, WB FM
모드는단일펄스내에광대역의주파수를송
∙
수신하여음향자료처리시어종식별을용이하게하 는 기법이다.
본조사시에는EK80
를NB CW
모드로운영하 였고, NB CW
모드에대하여음향조사전교정구(calibration
Table 1. Detail on mid-water trawl surveys
Transect Trawl location
Fishing depth (m) Distance (nmile)
Start End
1 37° 12.6´N, 131° 49.2´E 37° 17.8´N, 131° 49.3´E 100 1.99
2 37° 11.6´N, 132° 6.3´E 37° 13.0´N, 131° 59.5´E 207 1.61
Korea East Sea
Dokdo
Trawl 1 Trawl 2
1
2 2
(a) 38 kHz Raw data
(b) 38 kHz TVT noise removal
(c) 38 kHz median filter Fig. 6
Fig. 6
(a) (b) (c)
(a) (b)
(a) (b)
SV (dB) NASC (m
2/nmi
2)
Depth (m) Latitude (°N)
Longitude (°N)
S (dB) S (dB)
S
V38 kHz(dB)
Depth (m)
Temperature (℃) Salinity Flourescence (mg/m
3)
Fig. 1. Location of the hydroacoustic and mid-water trawl survey area around Dok-do, East Sea of Korea during winter season, 2016. Study area showing the acoustic transects (black line), trawl transects (gray dot line), and CTD station (black squares).
동계시기 독도 주변 어류 현존량
423
sphere)
를이용하여교정을실시하였다.
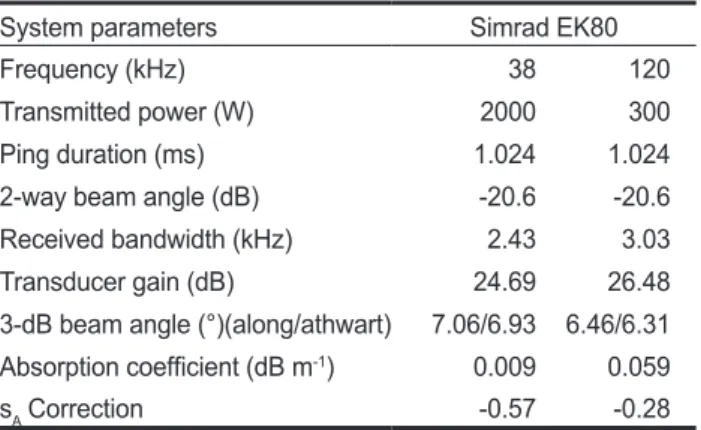
자세한음향시스템변수는
Table 2
에정리하였다.
과학어탐조사는8
개의음향정선 에대하여야간시기에진행하였고,
음향정선간이동을위한거 리는어류의분포및현존량계산시제외하였다.
어획조사는중층트롤어구
(net height, 3.6 m; net pendant, 97 m; cod-end mesh size, 60 mm)
를이용하여음향조사후조 사정선내2
개의정점에서주간과야간각각1
회씩중층트롤 어획조사를진행하였다(Table 1).
어획조사는정점별로약4
노트의선속으로유지하며30
분동안예망하였다.
예망수심은 과학어탐에서확인되는어류가분포하는수층에대해서어획 하였다.
야간시기에어획한정선1
과주간시기에어획한정선2
의예망수심은각각100 m
와207 m
였다.
이는어류의주·
야 수직이동에따라서수직적인분포수심이변경을고려하였기 때문이다.
어획된어류는조사선내에서Kim et al. (2005)
를기 준으로종수준까지동정하였고,
동정된어류는어종별로개 체수,
중량(1 g),
길이(0.1 cm)
를측정하였다.
환경조사는CTD (conductivity-temperature-depth; Sea-Bird, SBE 911plus;
Seabird electronics, Bellevue, WA, USA)
를이용하여음향조 사전과후2
개의정점(St.1: 37° 20.0´ N, 131° 54.7´E, St.2: 37°
18.1´N, 131° 49.3´E)
에대해서수온,
염분,
형광강도(fluo- rescence)
의변동을측정하였다(Fig. 1).
여기서형광강도는염 록소-a (Chlorophyll-a)
의상대적인값을나타낸다. CTD
는수 심200 m
까지만운영하였고,
획득한자료는1 m
간격으로변환 하여,
어류의시∙
공간적인분포와비교하였다.
음향자료의분석은음향자료처리전용프로그램
(Echoview ver. 7.0; Myriax software Pty Ltd, Australia)
을이용한가상 에코그램방식으로진행하였다.
음향자료처리는조사정선에 서획득한음향신호중38 kHz
와120 kHz
주파수에대해서수 평적과수직적으로각각69.7 nmile
과250 m
의범위에대해서 분석을실시하였다. Fig. 2
는38 kHz
를이용하여정선1
부근에 서획득한음향자료의예이다.
음향자료처리는음향정선내 에서획득한38 kHz
와120 kHz
의후방체적산란강도(Volume backscattering strength, SV)
자료에대해서(Fig. 2a),
해상상태와버블등에의한표층부근신호과해저면신호
,
그리고CTD
와어획장비운영등에의해서발생한잡음제거후,
수평과 수직적으로각각0.1 nmile
과1 m
간격으로압축하였다.
압축 된신호에대하여TVT (time-varied threshold)
기법을통하여 거리에따른잡음을제거하였고(Fig. 2b),
이후불연속적인기타잡음은잡음필터기법
(3×3 filter)
을이용하여제거하였다(Fig. 2c-d).
생물에의한신호외잡음을제거한음향신호중우 점종과기타생물산란체인동물플랑크톤또는비우점어종등 의신호분리를위해평균적인후방체적산란강도차이법(Mean Volume Backscattering Strength, MVBS)
을이용하였다(Kang
Table 2. System parameters calibrated for the acoustic survey
System parameters Simrad EK80
Frequency (kHz) 38 120
Transmitted power (W) 2000 300
Ping duration (ms) 1.024 1.024
2-way beam angle (dB) -20.6 -20.6
Received bandwidth (kHz) 2.43 3.03
Transducer gain (dB) 24.69 26.48
3-dB beam angle (°)(along/athwart) 7.06/6.93 6.46/6.31 Absorption coefficient (dB m-1) 0.009 0.059
sA Correction -0.57 -0.28
Korea East Sea
Dokdo
Trawl 1 Trawl 2
1
2 2
(a) 38 kHz Raw data
(b) 38 kHz TVT noise removal
(c) 38 kHz median filter Fig. 6
Fig. 6
(a) (b) (c)
(a) (b)
(a) (b)
SV (dB) NASC (m
2/nmi
2)
Depth (m) Latitude (°N)
Longitude (°N)
S
V120 kHz(dB) S
V120 kHz(dB)
S
V38 kHz(dB)
Depth (m)
Temperature (℃) Salinity Flourescence (mg/m
3)
Fig. 2. Example of echograms from volume backscattering strength (SV, dB) at 38 and 120 kHz around Dok-do, East Sea of Korea during winter season, 2016. (a) raw data with general background noise at 38 kHz, (b) echogram after removing using TVT compen- sation st 38 kHz. Echogram after median filter at 38 kHz(c) and 120 kHz(d).
이형빈
ㆍ
윤상철ㆍ
임양재ㆍ
김정년ㆍ
김맹진ㆍ
최광호424
et al., 2002).
시험어획조사를통해서조사시기조사해역에우 점종은매오징어(Watasenia scintillans)
로파악되어,
매오징어 에대한음향신호분리및자원량을산정하였다.
음향자원량산 정시중요요소인우점종인매오징어에대한음향특성연구가 진행되지않았기때문에,
본연구에서는음향학적특성이유사 한살오징어(Todarodes pacificus)
에대한음향특성을활용하 여계산하였다(Kang et al., 2005).
매오징어와기타어종의신호를분리후
38 kHz
주파수에대하여각각의면적산란계수(Nautical Area Scattering Coefficient, NASC, m
2/nmile
2)
를추 출하였다.
수집된음향자료를0.1 nmile
의EDSU (elementary distance sampling unit)
간격으로추출된NASC
값을이용하여 어군의공간분포특성을파악하는데사용하였다.
추출된음향 자료에대해서MABLAB
프로그램(R2009a, The MathWorks, Inc., USA)
을이용하여분석을진행하였다.
결 과
본조사지역에서중층트롤조사는주간과야간시기총
2
회 에걸쳐진행되었다.
어획결과매오징어(W. scitillans)
의개체 수와중량은각각2,299
개체와23,456 g
으로전체어획된어 종의90%
이상인최우점을취하였고(Table 3).
차우점종으로 앨퉁이(Maurolicus japonicus; 1,518
개체, 979 g),
도루묵(Arc- toscopus japonicus; 71
개체, 840 g)
순으로어획되었고,
갈고 리흰오징어와살오징어가각각1
개체씩어획되었다.
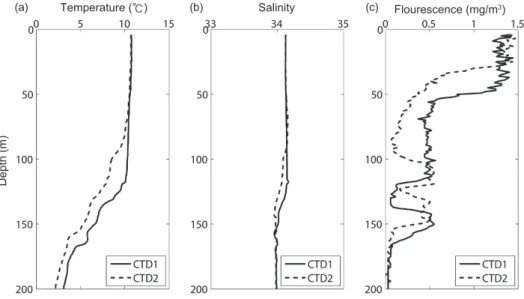
조사시기 해양환경은표층의경우10.7°C
이상의수온분포를나타냈고,
약100 m
부터수온이감소하여수심200 m
에서약3°C
이하의낮은수온분포를보였다
(Fig. 3a).
반면염분은표층에서수심200 m
까지33.95-34.16
로수직적으로큰차이가없었다(Fig.
3b).
수평적인수온분포는조사구역내동쪽지역인St .1
은서쪽지역인
St.2
에비해서상대적으로높은수온분포를보였다(Fig. 3a)
식물플랑크톤의상대적인양인Fluorescence
의수직 적인분포는2
개의조사정점에서큰차이를보였다(Fig. 3c).
정 점1
에서는수심49 m
이하로큰폭으로감소하였고,
정점2
에 서는30 m
이하로크게감소하였다.
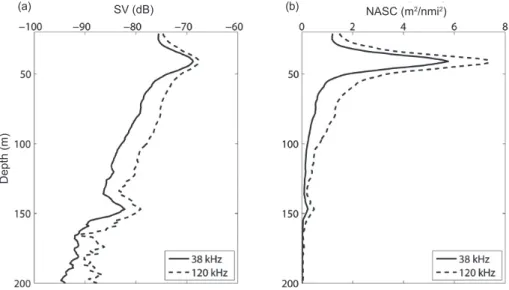
2016
년동계시기동해독도인근해역에서음향조사결과음 향산란신호는주로수심30-55 m
부근에서분포하였고,
수심 약40 m
부근에서최대로존재하였다(Fig. 4a).
음향산란층이 분포하는수심의평균음향신호는38 kHz
와120 kHz
의범위 는-76.21~-68.74 dB
와-74.62~-67.67 dB
범위에서나타났고,
그외음향산란층외수심에서는-75 dB
이하의음향신호가수 신되었다.
이는조사시기가야간이기때문에생물의주∙
야수직 이동(diel vertical migration)
으로인하여수심대비상층부에분포하는것으로판단된다
.
또한수심147 m
에서특정생물이분포했던것으로판단된다
(Fig. 4a).
어군의상대적인양을나타Table 3.Weighted ratio with dominant fish species by mid-water trawl fishing data around Dok-do, East Sea of Korea during winter season, 2016
Species Weighted ratio
(%) Weight
(g) Length (cm) Watasenia scintillans 92.70 23,456 4.4 (ML)
Maurolicus japonicus 3.87 978 4.3 (ML)
Arctoscopus japonicus 3.32 840 9.3 (BL)
Other species 0.13 34
Total 100.00 25,302
ML, Mantle length; BL, Body length.
Korea Sea
Dokdo
Trawl 1 Trawl 2
1
2 2
(a) 38 kHz Raw data
(b) 38 kHz TVT noise removal
(c) 38 kHz median filter Fig. 6
Fig. 6
(a) (b) (c)
(a) (b)
(a) (b)
SV (dB) NASC (m
2/nmi
2)
Depth (m) Latitude (°N)
Longitude (°N)
S
V120 kHz(dB) S
V120 kHz(dB)
S
V38 kHz(dB)
Depth (m)
Temperature (℃) Salinity Flourescence (mg/m
3)
Fig. 3. Vertical temperature and salinity profile of the water column measured by conductivity-temperature-depth casts.
동계시기 독도 주변 어류 현존량
425
내는평균
NASC
결과또는수심30-55 m
부근에서집중적으 로높게측정되었다(Fig. 4b).
조사시기어류의공간적인분포 는음향정선1
과2
부근인주로독도북서측에서강한음향신 호가탐지되었고,
독도동측부근에서도음향신호가탐지되었 다(Fig. 5).
반면심흥택해산부근인정선4-8
에서는어류의신 호가거의탐지되지않았다.
과학어탐조사를통하여획득한정선별
NASC
값과주요어획종인매오징어
,
앨퉁이,
도루묵의체장(L, cm)-
체중(w, g)-
관 계식(w=aL
b),
체장분포,
평균음향반사강도(Target strength, TS; TS=20·log
10(L)-b
20; σ=4π10
TS/10),
그리고체장함수를이 용한음향변환계수(conversion factor, CF)
를활용하여어종별 평균밀도( ρ)
‾ 를환산한후,
조사면적내어류의음향현존량을 산정하였다.
주요어종인매오징어,
앨퉁이도루묵에대한음 향반사강도는기존연구결과를사용하여계산된어종별에코Korea East Sea
Dokdo
Trawl 1 Trawl 2
1
2 2
(a) 38 kHz Raw data
(b) 38 kHz TVT noise removal
(c) 38 kHz median filter Fig. 6
Fig. 6
(a) (b) (c)
(a) (b)
(a) (b)
SV (dB) NASC (m
2/nmi
2)
Depth (m) Latitude (°N)
Longitude (°N)
S
V120 kHz(dB) S
V120 kHz(dB)
S
V38 kHz(dB)
Depth (m)
Temperature (℃) Salinity Flourescence (mg/m
3)
Fig. 4. Vertical distribution of acoustic backscatter into different frequencies from mean of all transects. Black line show average 38 kHz, and black dot lines are average 120 kHz. Vertical axis is depth in meters, x-axis are acoustic backscatter measured as SV (dB) (a) and nautical area scattering coefficient (NASC) per 1 m depth channel (m2/nmile2) (b), respectively.
Korea East Sea
Dokdo
Trawl 1 Trawl 2
1
2 2
(a) 38 kHz Raw data
(b) 38 kHz TVT noise removal
(c) 38 kHz median filter Fig. 6
Fig. 6
(a) (b) (c)
(a) (b)
(a) (b)
SV (dB) NASC (m
2/nmi
2)
Depth (m) Latitude (°N)
Longitude (°N)
S
V120 kHz(dB) S
V120 kHz(dB)
S
V38 kHz(dB)
Depth (m)
Temperature (℃) Salinity Flourescence (mg/m
3)
Fig. 5. Spatial variation of trawl catch per unit area (kg2/km2) and nautical area scattering coefficient (NASC, m2/nmile2) of demersal fish around Dok-do, East Sea of Korea during winter season, 2016.
이형빈
ㆍ
윤상철ㆍ
임양재ㆍ
김정년ㆍ
김맹진ㆍ
최광호426
적분배분값은매오징어의에코적분배분값은
0.94
로,
앨퉁이 와도루묵은각각0.03
씩으로설정되었다(Table 4; Yoon et al., 1999; Saito, 2004; Kang et al., 2005). 2016
년3
월음향자원조 사로부터독도주변해역의매오징어의밀도는6.13 g/m
2,
앨퉁 이와도루묵은각각0.04
와0.07 g/m
2로산정되었다.
총면적40,742.3 ha
에대한어류의현존량은2542.8
톤이고,
매오징어 는2499.1
톤,
앨퉁이와도루묵은각각26.9
톤과16.9
톤으로산 정되었다(Table 5).
고 찰
조사시기독도인근해역의어획된매오징어
(Watasenia scin- tillans)
의생체량은92.7%
를차지하는최우점종이다(Table 3).
매오징어는일본북동해역에서분포하는종으로
,
주∙
야이동을 하는어종으로주간시기300-500 m,
야간시기20-60 m
에분포 하는것으로알려져있다(Watanabe et al., 2006).
또한분포하 는수심의수온은주간시기3-6°C
이고,
야간시기5-15°C
분포 한다.
조사해역에서야간시기매오징어가분포하는수심은40
m
부근으로기존의연구에서분포하는수온에포함된다(Fig.
2c).
매오징어는발광물질을갖고있는냉수성소형종으로,
심해산란층
(Deep scattering layer, DSL)
을이루며우리나라동 해안에널리분포하고있는종으로알려져있다.
또한,
매오징어 는국내에서직접적인식용으로이용되지는않으나오징어,
갈 치,
고등어등의먹이생물로서중요한어류이다.
이러한먹이생 물자원의분포및현존량의변동은이들을먹이생물로하는수 산자원의어황변동에직접적인영향이있을것으로여겨진다.
따라서본조사해역의지속적인매오징어의시∙
공간적인분포 및현존량의산정은동해수산자원변동의기초자료로활용이 가능할것으로판단된다.
38 kHz
와120 kHz
의 다중주파수를이용하여주요 어획물인 매오징어와 타 생물체와의 분리를 진행하였다
.
매오징어 와 타 생물체와의분리시 두주파수 파이의 범위는-1 dB <
SV
120kHz‒38 kHz< 3 dB
로설정하였다(Goss et al., 1996). EK60
으로획득한음향신호중매오징어가분포할것이라고판단되는상부주요산란층
30-55 m
와타생물체가분포할것으로판단되는 하부산란층
56-95 m
둘로분리하여추출하였다(Fig.
6).
그결과상부산란층의추출신호는-1~3 dB
범위안에전 체의신호중90.94%
가포함되고, 38 kHz
와120 kHz
의평균SV
는각각-62.89 dB (standard deviation, (SD)=5.07)
와-62.61 dB (SD=4.42)
였다(Fig. 6a).
반면하부음향산란층의평균SV
는38 kHz
와120 kHz
각각-73.00 dB (SD=2.70)
와-70.18 dB (SD=2.12)
로상부층에비하여약10.10 dB
와7.57 dB
씩약하게 측정되었고,
매오징어로판단되는범위에내에는약43.44%
가 나타났다(Fig. 6b).
하부산란층신호중-1~3 dB
의범위를벗 어난대부분의신호는120 kHz
가38 kHz
에비하여상대적으로 음향신호가강하였고,
이는매오징어에비하여소형어류또는 Table 5. Standing stock estimation of squid Watasenia scintillansusing acoustic survey around Dok-do, Korea in March, 2016. The ni is the number of 0.1 EDSU (elementary distance sampling unit) and NASC is mean value of the nautical area scattering coefficient (m2/nmile2) along i-th trensects
Transect No.
7-8 Mar 2016
ni1) 20-300 m
NASC2) per 0.1 EDSU
Transect 1 59 538.9
Transect 2 107 793.2
Transect 3 65 126.5
Transect 4 51 42.0
Transect 5 73 186.0
Transect 6 68 10.0
Transect 7 62 72.7
Transect 8 51 3.9
∑ ni 536
Weighted mean
NASC 34.04
Survey Area (ha) 40742.3
Species ‾ρ3) (g/m2) Biomass (ton)
Watasenia scintillans 6.13 2499.1
Maurolicus japonicus 0.04 26.9
Arctoscopus japonicus 0.07 16.9
Total 2542.8
1)ni, Number of 0.1 nmile averaging intervals on i-th transact; 2) NASC, Nautical area scattering coefficient per 0.1 EDSU (0.1 nmile); 3)ρ, Mean biomass density.‾
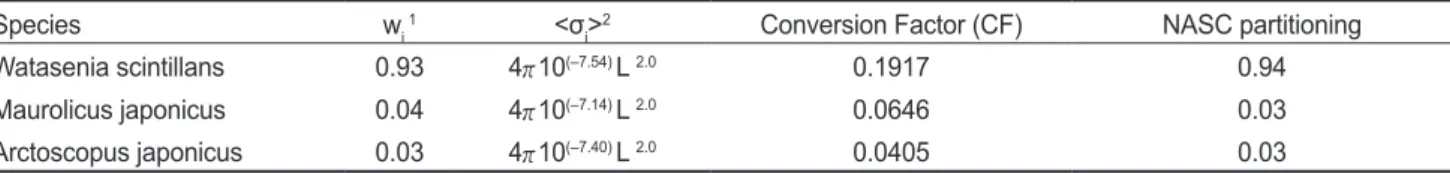
Table 4. Value of conversion factor (CF) and nautical area scattering coefficient (NASC) partitioning by fish species around Dok-do, East Sea of Korea during winter season, 2016
Species wi 1 <σi>2 Conversion Factor (CF) NASC partitioning
Watasenia scintillans 0.93 4π10(‒7.54) L 2.0 0.1917 0.94
Maurolicus japonicus 0.04 4π10(‒7.14) L 2.0 0.0646 0.03
Arctoscopus japonicus 0.03 4π10(‒7.40) L 2.0 0.0405 0.03
1wi, Weighted proportion of species i in fish samples; 2 <σi>, Mean backscattering cross-section of specie i.
동계시기 독도 주변 어류 현존량
427
동물플랑크톤로판단된다
.
다중주파수를이용한신호처리기법중하나인
MVBS
기법을활용하여현존량을계산시수층내존재하는동물플랑크톤및연체동물에의한오류가일부포함될 수있다
.
따라서차후동물플랑크톤의종류및길이분포를파악 하여,
다중주파수를이용한어류와의분리및제거에대한연구 가진행되어야할것이다.
음향기법을통한어류자원량산정을위해서는조사정선내 우점어종을파악하여야한다
.
중층트롤조사는음향자료분석을통한어류의주요분포수심과차이가있는수심인
100 m
와207 m
에서실시하였다.
본어획시주요어종은매오징어로어류에비해낮은회피율로인하여트롤의입망또는양망시음향 산란층에대한사선채집된것으로판단된다
.
따라서차후정확 한음향산란층에대한어획또는층별어획을진행해야좀더 신빙성있는음향자원량결과를얻을수있을것이다.
음향기법 을이용한자원량산정시본연구는야간시기에실시되어매오 징어의어군에동물플랑크톤과앨퉁이등이공존하여,
음향자 료처리를통해서매오징어외신호를제거하는방법으로진행하 였다.
따라서현존량추정시에는음향조사와수행되는트롤조 사는주간시기수행되어야할것으로판단된다.
또한같은해역 을대상으로반복적인조사를진행하여음향신호의검증및분 석기법에대한연구가병행되어야할것이다.
지리적및생태학적으로의미가있는독도인근해역에서동 계시기어류의공간적인분포및자원량을산정하기위해서어 획및음향조사를실시하였다
.
중층트롤을이용한어획조사 결과2
차생산자영양단계에있는매오징어가90%
이상이었 고,
어획된매오징어의전장조성의범위는2.8-5.2 cm
였다.
그외에앨퉁이
,
도루묵등이어획되었다.
과학어탐으로조사한결 과는수직적으로는야간시기30-55 m
수층에분포하였고,
공 간적으로는독도주변해역,
특히독도북서쪽부근에강한음향 신호가나타났고,
독도의동쪽지역으로갈수로음향신호가약 하게탐지되었다.
음향자료와환경자료비교시,
독도의서쪽 해역이동쪽지역에비하여식물플랑크톤수층이깊게분포하 여영향상태가좋은것으로판단되었다.
조사지역의음향자원 량은매오징어가2499.1
톤,
앨퉁이와도루묵은각각26.9
톤과16.9
톤으로산정되었다.
사 사
이논문은
2017
년국립수산과학원수산시험연구사업과제명(R2017031)
의지원으로수행된연구입니다.
References
Choi CG, Lee HW and Hong BK. 2009. Marine algal flora and community structure in Dokdo, East sea, Korea. Korea J Fish Aquat Sci 42, 329-334.
Choi KH, Han MH, Kang CK,Park JM, Choi JH, Park JH, Sohn MH, Baeck GW, Choi EJ and Lee CI. 2012. Seasonal variations in species composition of fish assemblage col- lected by trammel net in coastal waters of the East Sea. J Kor Soc Fish Tech 48, 415-427. http://dx.doi.org/ 10.3796/
KSFT.2012.48.4.415.
Goss C, Rodhouse P, Watkins JL and Brierley AS. 1998. At- tribution of acoustic echoes to squid in the South Atlantic.
Korea East Sea
Dokdo
Trawl 1 Trawl 2
1
2 2
(a) 38 kHz Raw data
(b) 38 kHz TVT noise removal
(c) 38 kHz median filter Fig. 6
Fig. 6
(a) (b) (c)
(a) (b)
(a) (b)
SV (dB) NASC (m
2/nmi
2)
Depth (m) Latitude (°N)
Longitude (°N)
S
V120 kHz(dB) S
V120 kHz(dB)
S
V38 kHz(dB)
Depth (m)
Temperature (℃) Salinity Flourescence (mg/m
3)
Fig. 6. Compare acoustic signals of squid Watasenia scintillans and other scatterer identified on a 38 kHz (Fig. 2c) and 120 kHz (Fig. 2d) echogram in the acoustic transects (T1). Scatter plot of volume backscattering strength (SV) at 120 kHz against 38 kHz from 30 to 50 m (a) and from 51 m to 95 m. The gray and red dots indicate the wholes SV and SV classified with dB difference windows of ‒1~3 dB for squid Watasenia scintillans.
이형빈
ㆍ
윤상철ㆍ
임양재ㆍ
김정년ㆍ
김맹진ㆍ
최광호428
CCAMLR Sci 5, 259-271.
Kang JH, Kim WS and Shim JH. 2002. Species composition and abundance of zooplankton zommunity in spring and au- tumn around Dokdo. Ocean Polar Res 24, 449-455.
Kang D, Mukai T, Iida K, Hwang D and Myoung JG. 2005.
The influence of tilt angle on the acoustic target strength of the Japanese common squid (Todarodes pacificus). ICES J Mar Sci: J du Conseil 62, 779-789. http://dx.org/10.1016/j.
icesjms.2005.02.002.
Kang MH, Furusawa M and Miyashita K. 2002. Effective and accurate use of difference in mean volume backscattering strength to identify fish and plankton. ICES J Mar Sci: Jour- nal du Conseil 59, 794-804.
Kang MH, Seo YI, Oh TY, Lee KH and Jang CS. 2015. Es- timating the biomass of anchovy species off the coast of Tongyeong and Yeosu in South Korea in the spring and win- ter of 2013 and 2014. J Kor Soc Fish Tech 51, 86-93. http://
dx.doi.org/10.3796/KSFT.2015.51.1.086.
Kim IS, Choi Y, Lee CL, Lee YJ, Kim BJ and Kim JH. 2005.
Illustrated book of Korean fishes. Kyo-hak Pub. Ltd., Seoul, Korea, 1-615.
Kim MK, Shin JK and Cha JH. 2004. Veriation of species com- position of benthic algae and whitening in the coast of Dok- do island suring summer. Algae 19, 69-78.
Kim YS, Choi JH, Kim JN, Oh TY, Choi KH, Lee DW and Cha HK. 2010. Seasonal variation of fish assemblage in Sacheon marine ranching, the southern coast of Korea. J Kor Soc Fish Tech 46, 335-345. http://dx.doi.org/10.3796/
KSFT.2010.46.4.335.
Lee HW, Hong BK, Shon MH, Chun YY, Lee DW, Choi YM and Hwamg GS. 2010. Seasonal Variation in Species Com- position of fish.
MOF. 1999. Basic study for systainment of marine environment and fihsery resources of the Dokdo area. Ministry of Oceans and Fishreies, Sejong, Korea, 1-544.
Myoung JG. 2002. The Fish Fauna around Dokdo in the East Sea, Korea. Ocean Polar Res, 24, 449-455.
Park HS, Kang RS and Myoung JG. 2002. Vertical distribution of mega-invertebrate and calculation ot the stock assessment of commercial species inhibiting shallow hard-boottom in Dokdo, Korea. Ocean Polar Res 24, 457-464.
Saito I. 2004. Development of fishery resources assessment technology using a scientific echosounder, 2002 Annual re- port of Fisheries Promotion Center, Akita Prefecture Public Relations Division, 4-1-1 sanno, Akita City, Japan, 95-101.
Seo YI, Lee JH, Oh TY, Lee JB, Choi YM and Lee DW. 2013.
Distribution and seasonal variations of fisheries resources captured by the beam trawl in Namhae island, Korea. J Kor Soc Fish Tech 49, 419-431. http://dx.doi.org/10.3796/
KSFT.2013.49.4.419.
Simmonds J and MacLennan D. 2005. Fisheries acoustics: The- ory and practice, second edition. Blackwell, Oxford, UK,
217-261.
Watanabe H and Kubodera T, Moku M and Kawaguchi K.
2006. Diel vertical migration of squid in the warm core ring and cold water masses in the transition region of the western North Pacific. Marine Ecology Progress Series 315, 187- Yoon G, Shin H and Hwang K. 1999. Target strength of fishes 197.
for estimating biomass - Distribution characteristics and tar- get strength measurement of micronektonic fish, Maurolicus
muelleri in the East Sea. J Kor Soc Fish Tech 35, 404-409.
Von Szalay PG, Somerton DA and Kotwicki S. 2007. Corre- lating trawl and acoustic data in the eastern Bering Sea: A first step toward improving biomass estimates of walleye pollock (Theragra chalcogramma) and Pacific cod (Ga-
dus macrocephalus). Fish Res 86, 77-83. http://10.1016/j.
fishres.2007.05.005.
Zwolinski JP, Demer DA, Byers KA, Cutter GR, Renfree JS, Sessions TS and Macewicz BJ. 2012. Distributions and abundances of Pacific sardine (Sardinops sagax) and other pelagic fishes in the California Current Ecosystem during spring 2006, 2008, and 2010, estimated from acoustic–trawl surveys. Fish Bull 110, 110-122.