Brain regions associated with periodic leg movements during sleep in restless legs syndrome
tae-Joon Kim
1,2,13, Kwang Su cha
1,13, Sanghun Lee
1, Tae-Won Yang
3, Keun Tae Kim
4, Byeong-Su park
5, Jin-Sun Jun
6, Jung-Ah Lim
11, Jung-Ick Byun
7, Jun-Sang Sunwoo
8, Jung- Won Shin
9, Kyung Hwan Kim
10, Sang Kun Lee
1,12,13*& Ki-Young Jung
1,12,13*The neural substrates related to periodic leg movements during sleep (PLMS) remain uncertain, and the specific brain regions involved in PLMS have not been evaluated. We investigated the brain regions associated with pLMS and their severity using the electroencephalographic (eeG) source localization method. Polysomnographic data, including electromyographic, electrocardiographic, and 19-channel EEG signals, of 15 patients with restless legs syndrome were analyzed. We first identified the source locations of delta-band (2–4 Hz) spectral power prior to the onset of PLMS using a standardized low- resolution brain electromagnetic tomography method. Next, correlation analysis was conducted between current densities and PLMS index. Delta power initially and most prominently increased before leg movement (LM) onset in the PLMS series. Sources of delta power at −4~−3 seconds were located in the right pericentral, bilateral dorsolateral prefrontal, and cingulate regions. PLMS index was correlated with current densities at the right inferior parietal, temporoparietal junction, and middle frontal regions. In conclusion, our results suggest that the brain regions activated before periodic LM onset or associated with their severity are the large-scale motor network and provide insight into the cortical contribution of PLMS pathomechanism.
Periodic leg movements during sleep (PLMS) are repetitive, involuntary, and jerky movements that typi- cally involve dorsiflexion of the ankle, extension of great toe, and occasional flexion of the knee and hip1. The uniqueness of PLMS is that they occur periodically at intervals of approximately 20 to 40 seconds and usually in non-rapid eye movement (non-REM) sleep stages and are mostly presented in the legs. Previous studies inves- tigating the PLMS pathophysiology revealed that changes in electroencephalography (EEG) accompanied by an increase in heart rate precede the occurrence of leg movements (LMs) during PLMS and that cortical and autonomic activations are regarded to lead these changes2–8, supporting the association between PLMS and car- diovascular risks9. However, which brain areas or neural substrates are involved in triggering PLMS have not been investigated.
Neural substrates involved in voluntary motor movements have been extensively studied using electrophysi- ological, neuroimaging, or hemodynamic studies10–12. Readiness potential, an initial slow potential shift in EEG, begins approximately two seconds before voluntary motor movement onset in the contralateral supplementary motor area. This feature also precedes the self-intention to move12. Areas associated with voluntary motor control
1Department of Neurology, Seoul National University Hospital, Seoul, Republic of Korea. 2Department of Neurology, Ajou University School of Medicine, Suwon, Republic of Korea. 3Department of Neurology, Gyeongsang National University Changwon Hospital, Gyeongsang National University School of Medicine, Changwon, Republic of Korea.
4Department of Neurology, Keimyung University Dongsan Medical Center, Daegu, Republic of Korea. 5Department of Neurology, Ulsan University Hospital, Ulsan, Republic of Korea. 6Department of Neurology, Kangnam Sacred Heart Hospital, Hallym University College of Medicine, Seoul, Republic of Korea. 7Department of Neurology, Kyung Hee University Hospital at Gangdong, Seoul, Republic of Korea. 8Department of Neurosurgery, Seoul National University Hospital, Seoul, Republic of Korea. 9Department of Neurology, CHA Bundang Medical Center, CHA University, Seongnam, Republic of Korea. 10Department of Biomedical Engineering, College of Health Science, Yonsei University, Wonju, Republic of Korea. 11Department of Neurology, Chamjoeun Hospital, Gwangju, Republic of Korea. 12Department of Neurology, Seoul National University College of Medicine, Seoul, Republic of Korea. 13These authors contributed equally: Tae-Joon Kim, Kwang Su Cha, Sang Kun Lee and Ki-Young Jung. *email: sangkun@snu.
ac.kr; jungky@snu.ac.kr
open
Methods
Participants.
We retrospectively reviewed and collected demographic information, sleep questionnaires, and polysomnographic (PSG) data from 19 drug-naïve RLS patients who participated in a previous study22. Participants were between the ages of 22 and 69 years old (median, 50 years old) and were recruited into the study between Mar 2012 and Feb 2013. RLS was diagnosed according to the diagnostic criteria proposed by the International RLS Study Group utilizing the validated Korean-language version of the Johns Hopkins Telephone Diagnostic Questionnaire23,24. The inclusion and exclusion criteria were described previously22. The question- naires included the Epworth Sleepiness Scale, the Insomnia Severity Index, the Pittsburgh Sleep Quality Index, and the Korean version of Beck Depression Inventory II. The International RLS Study Group rating scale (IRLS) was applied to determine RLS severity. Two participants were excluded from the study because they had no PLMS. Another two participants were excluded from the subsequent data analysis due to poor quality of the PSG data. As a result, the final analysis included 15 subjects. This work was approved by the Institutional Review Board of Seoul National University Hospital (IRB no. 1705-118-855) and informed consent was obtained from all participants. The experimental protocol was carried out in accordance with the guidelines and regulations of the local ethics committee.Polysomnographic recordings.
All participants underwent one night of PSG (Embla RemLogic; Embla Systems LLC, Broomfield, CO, USA) according to standard protocols as previously described25. Overnight PSG data were recorded using 19 EEG electrodes placed on the scalp in accordance with the international 10–20 sys- tem, two electrooculography channels, an electromyogram (EMG) of submental and anterior tibialis muscles, and an electrocardiogram (ECG) with surface electrodes. EEG signals were sampled at 200 Hz. Sleep stages were scored in 30-second epochs according to the standard criteria listed in the American Academy of Sleep Medicine sleep scoring manual26. We obtained total sleep time, sleep efficiency, sleep stages (including N1, N2, N3, and REM sleep), sleep latency, wake-up after sleep onset, apnea-hypopnea index, and arousal index via PSG. Each sleep stage was defined as a percentage of total sleep time.LM and PLMS measures.
LM and PLMS were manually scored according to the World Association of Sleep Medicine/International RLS Study Group criteria27. LM was defined as any anterior tibialis EMG event with the criteria that the onset has EEG activity ≥8 μV in amplitude above resting baseline, the offset is under 2 µV, and the duration is ≤0.5 second. PLMS were defined as a series of four or more consecutive candidate LMs lasting 0.5–10 seconds and separated by intervals of 10–90 seconds during sleep.PLMSI was defined as the average number of LMs included in PLMS per hour. Inter-movement interval (IMI) indicated the duration between the onset of one LM and the onset of the following LM19. The number of IMIs that were 10–90 seconds long and in sequences of ≥3 was divided by the total number of intervals to yield the perio- dicity index (PI); this index can vary between 0 (absence of periodicity, with none of the intervals between 10 and 90 seconds long) and 1 (complete periodicity, with all intervals between 10 and 90 seconds long).
In the present study, pLM indicated an LM that belonged to a PLMS series, and iLM indicated an LM that did not belong to a PLMS series.
LM selection and EEG preprocessing.
LMs only during non-REM sleep stages were included in the anal- ysis. EEG data were processed using a band-pass filter (1–80 Hz) and a notch filter (60 Hz) to reduce background noise. EEG, EMG, and ECG data were segmented for −20~20 seconds around LM onset. LMs that had another LM in the preceding interval (−20~0 seconds) were rejected to exclude fluctuations in the baseline due to the preceding LM. LMs having signal fluctuations in the preceding period were also excluded by visual inspection.EEG segments exceeding an absolute amplitude of 150 μV were excluded from the analysis. EEG segments with any significant artifacts were also rejected by visual inspection. Independent component analysis was performed to remove EEG signal fluctuations, such as eye movement and skin potential, from the original data.
Time-frequency analysis of EEG in relation to LM.
To identify event-related changes in specific EEG spectral characteristics across LM conditions, the time-varying spectral power was estimated using short-time Fourier transform (STFT) with the following parameters: Hanning window and a 1-second time interval with a non-overlap. We did not overlap the time window for clarifying the instantaneous power changes. The magni- tudes of the STFT coefficient were corrected with that of the baseline interval according to the following formula:Baseline-normalized power = (power − average power of baseline interval)/(standard deviation of power of base- line interval).
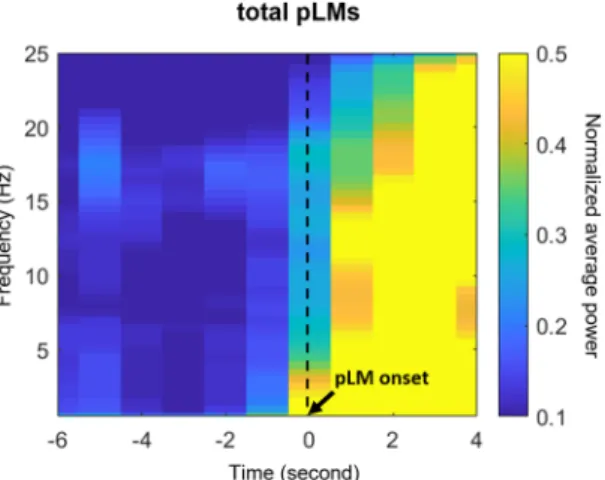
The baseline interval was defined in this study as −18 to −12 seconds prior to the onset of LM. The baseline-normalized power was averaged across trials, that is, a total of pLMs or iLMs from all subjects. EEG spectra were divided into delta (2–4 Hz), theta (4–8 Hz), alpha (8–13 Hz), and beta (16–30 Hz) bands. Delta-band power preceded the other spectral powers and showed the most significant and remarkable transitions before PLMS (Fig. 1), in accordance with previous studies28–30. Therefore, we focused on delta bands in further analyses.
Topographic maps are presented for each time point according to each frequency band to depict the overall tem- poral and spatial power distributions. The average values of spectral power across all EEG channels were used to compare signals obtained from different kinds of LM.
To differentiate EEG changes associated with PLMS from those associated with spontaneous EEG arousal not accompanied by any other event, spectral analysis of spontaneous EEG arousal was performed using the same method used for LMs.
Heart rate changes.
The time interval between two successive enhanced R-peaks was used to calculate heart rate. To obtain more highlighted R-peaks, band-pass filtering was conducted. The signal was filtered by fourth-order Butterworth filters with cut-off frequencies between 15 and 20 Hz. The heart rate was computed from the R-R interval, and the baseline-normalized heart rate was obtained using the same formula as that used for baseline-normalized power.EEG source localization.
From the scalp-recorded EEG potentials, a three-dimensional reconstructed source distribution for the delta-band activity beginning prior to PLMS onset was obtained using the sLORETA method implemented in Brainstorm version 3.2, an open source toolbox31. The solution space was restricted to the cortical gray matter in 15,002 voxels with a spatial resolution of 1 mm in the Talairach coordinates32. To group the voxels into functionally similar cortical regions, we employed a total of 148 regions of interest (ROIs) adopted from a standard magnetic resonance imaging (MRI) template obtained from Destrieux et al. This ROI method was implemented for comparing normalized power between pLM and iLM or for correlating current densities with PLMSI. The principal component analysis was performed to determine the dominant activity among all voxels at each ROI. At each ROI, current density was standardized compared to that in the baseline to test for statistical significance.Statistical analysis.
Clinical data are presented as the medians and 25th–75th interquartile ranges. EEG spectral power or heart rate data at every time point near LM onset were compared with the average of those obtained during the baseline interval using paired samples t-tests. An uncorrected p value of less than 0.01 was considered statistically significant to study data from scalp-recorded EEG channels or ECG heart rate. For source localization, a t-distribution was adopted to show brain regions that were significantly activated compared with the activity observed at baseline. To compensate for multiple comparisons when investigating the EEG sources, the false discovery rate (FDR) was applied to the statistically significant regions of t-distribution versus baseline (FDR-adjusted p value < 0.005)33. A correlation analysis between clinical scores, including IRLS, ferritin levels, or PLMSI, and current density for EEG delta power, was performed using Pearson’s correlation, and p values of less than 0.05 were considered statistically significant. The data analyses and statistical analyses were performed using MATLAB software version R2014b (Mathworks, Inc., Natick, MA, USA).Figure 1. Time-frequency maps of power near the pLMs. Power was averaged over all electroencephalographic channels. Abbreviations: pLM, LM belonging to PLMS; LM, leg movement; PLMS, periodic leg movements during sleep.
Results
Clinical characteristics of RLS patients.
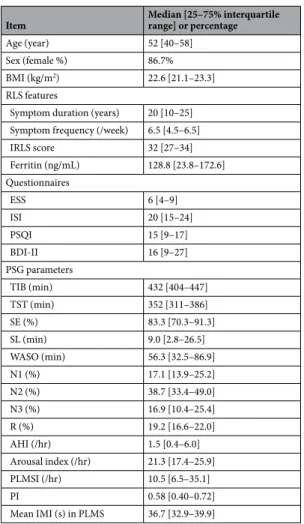
The median age of the 15 subjects was 52 [25–75% interquartile range; 40–58] years old, and 13 of them were female. Their epidemiological characteristics, sleep questionnaire scores, and PSG parameters are summarized in Table 1. The median PLMSI was 10.5 [6.5–35.1], and the median value of the mean IMI in PLMS was 36.7 [32.9–39.9]. The total number of pLMs identified in the PSG of 14 sub- jects was 1,871. Of these, 274 pLMs (14.6%) were excluded according to the condition having preceding another pLM within 20 seconds, and 47 ones were excluded due to artifacts. Therefore, a total of 1,550 pLMs obtained from 14 subjects and 251 iLMs obtained from another 14 subjects were subjected to subsequent analyses.Changes in heart rate and EEG spectral power preceding LM onset.
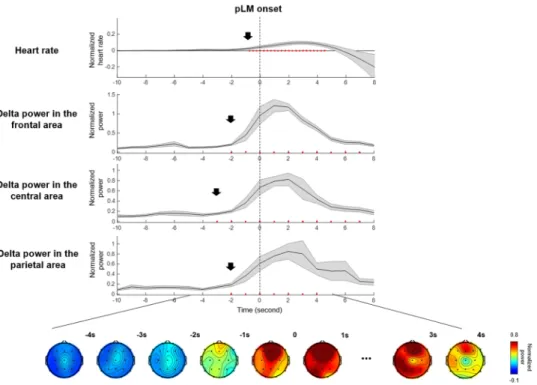
EEG and ECG signals changed before pLM onset, in line with previous studies. The heart rate began to increase significantly at −1 second before pLM onset. Averaged spectral power over 19 EEG channels increased significantly at around −2 seconds before pLM onset (p < 0.01 compared with the baseline interval) in all frequency bands, especially beta and delta bands (Fig. 1). In particular, the delta-band power was the most initial and prominent signal to increase (Fig. 2). The delta-band power in the central area was the first signal to increase at −3~−2 seconds prior to pLM in PLMS and was followed by signals in the frontal and parietal areas. Beta-band power was the second prominent signal following delta band and began to increase in the frontal area at −2~−1 seconds (Fig. S1). iLM showed slightly different patterns of changes in EEG spectral power from those of the pLM. Delta power prior to iLM onset increased in the frontal area at −3~−2 seconds followed by in the central and parietal areas (Fig. S2).EEG sources associated with PLMS.
Because the delta band was the most initial and prominent signal before pLM onset at approximately −3 seconds, further analysis employed the delta band to assess the brain regions associated with PLMS. We identified the EEG current sources for the delta bands preceding PLMS using the sLORETA method.Several brain regions, including the bilateral pericentral, dorsomedial prefrontal, and posterior cingulate regions, had higher EEG current densities before pLM onset (Fig. S3A,B). In contrast, cortical activity before
PSG parameters
TIB (min) 432 [404–447]
TST (min) 352 [311–386]
SE (%) 83.3 [70.3–91.3]
SL (min) 9.0 [2.8–26.5]
WASO (min) 56.3 [32.5–86.9]
N1 (%) 17.1 [13.9–25.2]
N2 (%) 38.7 [33.4–49.0]
N3 (%) 16.9 [10.4–25.4]
R (%) 19.2 [16.6–22.0]
AHI (/hr) 1.5 [0.4–6.0]
Arousal index (/hr) 21.3 [17.4–25.9]
PLMSI (/hr) 10.5 [6.5–35.1]
PI 0.58 [0.40–0.72]
Mean IMI (s) in PLMS 36.7 [32.9–39.9]
Table 1. Clinical information and polysomnography data of all 15 subjects included in the analysis. - Abbreviations: BMI, body mass index; RLS, restless legs syndrome; IRLS, International RLS Study Group rating scale; ESS, Epworth Sleepiness Scale; ISI, Insomnia Severity Index; PSQI, Pittsburgh Sleep Quality Index;
BDI-II, Beck Depression Inventory II; PSG, polysomnography; TIB, time in bed; TST, total sleep time; SE, sleep efficiency; SL, sleep latency; WASO, wake-up after sleep onset; AHI, apnea-hypopnea index; PLMSI, periodic leg movement during sleep index; PI, periodicity index; IMI, inter-movement interval.
Figure 2. Delta-band (2–4 Hz) power at three areas, topography, and heart rate changes near pLM onset. Delta- band power in the central area increased significantly at −3~−2 seconds before pLM onset. Heart rate increased at −1 second, and delta power in the frontal and parietal areas increased at −2~−1 seconds before pLM onset.
Red dots indicate significant changes compared to the value of baseline interval using paired t-test (uncorrected p < 0.01). An EEG power value at −10 seconds indicates normalized power at −10~−9 seconds, and so on.
Abbreviations: pLM, LM belonging to PLMS; LM, leg movement; PLMS, periodic leg movements during sleep.
Figure 3. Statistically significant regions of t-distribution of delta-band current sources before pLM or iLM onset versus baseline (FDR correction, FDR-adjusted p value < 0.005) were demonstrated. (A) The significant regions at −4~−3 seconds before pLM onset were right pericentral, bilateral dorsolateral, and cingulate regions compared to the baseline interval, and (B) spreads diffusely over fronto-temporal lobes at −3~−2 seconds. (C) In contrast, the significant regions were sparsely observed at −4~−3 seconds before iLM onset. (D) At −3~−2 seconds before iLM onset, the significant regions were mainly in the right pericentral and left parieto-occipital areas. Abbreviations: pLM, LM belonging to PLMS; iLM, LM not belonging to PLMS; LM, leg movement;
PLMS, periodic leg movements during sleep; FDR, false discovery rate.
iLM onset began to activate in the bilateral dorsal, ventrolateral, medial frontal, and anterior cingulate regions (Fig. S3C,D). Statistically significant current sources of delta power emerged first at -4 ~ -3 seconds before pLM onset and were mainly located in the right pericentral, bilateral dorsolateral prefrontal, and cingulate regions (Fig. 3A). The current sources then spread out into the bilateral frontal and temporal areas with time (Fig. 3B).
Current sources of delta power before iLM onset were sparsely detected until −4~−3 seconds (Fig. 3C) and after −3~−2 seconds appeared at the areas encompassing the right pericentral and left parieto-occipital regions (Fig. 3D).
Correlation between PLMSI and cortical activity.
Considering that the significant EEG sources before pLM emerged initially at between −4~−3 or −3~−2 seconds, the cortical activity represented by the current density of delta bands during these time intervals was correlated with PLMSI. Brain regions that had significant correlations with PLMSI were the right inferior parietal, right middle frontal region, and superior temporal sulci at −3~−2 seconds (Fig. 4). No brain regions were correlated with IRLS or ferritin levels.Discussion
The results of our study reveal that the brain regions associated with PLMS were the large-scale motor network, including pericentral, dorsolateral prefrontal, and cingulate regions, at −4~−3 seconds before each repetitive LM.
We also showed that part of default mode network and motor control area, comprising the right inferior parietal, temporoparietal junction, and middle frontal regions, had significant correlations with PLMSI. These results provide new insights into the neural substrates in relation to PLMS in RLS.
We first confirmed that EEG activity preceded LM by a few seconds, in line with the literature. This finding was observed in wide spectral bands from the delta to the beta band, but the delta band was the initial signal that showed the most pronounced increase. Delta activity has been known to be the main spectrum preceding motor movement and is understood to be the signal most related to motor initiation and preparation28–30. For these reasons, we analyzed the delta bands for EEG source localization in the present study.
EEG topographic data of the delta band showed that the pericentral area was the first to change before pLM onset and that the frontal and parietal areas followed afterwards. In the next step, the EEG current source of the Figure 4. Correlation between PLMSI and cortical activity. At the right inferior parietal, right middle frontal region, and superior temporal sulci, delta current densities between −3~−2 seconds before pLM versus baseline interval had significant positive correlation with PLMSI. Abbreviations: pLM, LM belonging to PLMS; LM, leg movement; PLMS, periodic leg movements during sleep; PLMSI, PLMS index.
delta band was determined using the sLORETA method, which identified the specific brain regions that were acti- vated before PLMS. As a result, we confirmed that the neural substrates preceding pLM were localized at the peri- central, dorsolateral prefrontal, and cingulate regions. The dorsolateral prefrontal cortex has various functions, including motor control13. The posterior cingulate cortex, as a central node in the default mode network, plays a role in executive motor control in connection with the frontoparietal control network34. A positron emission tomography study demonstrated that the bilateral pericentral and right posterior cingulate regions corresponded to the sites activated during motor imagery in locomotor-related tasks13. Increasing evidence in neuroimaging and neuroanatomical studies supports the idea that some subset of anterior cingulate motor area neurons are involved in motor control preparation and execution35–37. The white matter volume of the anterior cingulate cortex is smaller in patients with RLS38–40. A functional MRI (fMRI) study revealed that the left primary motor and somatosensory cortices with ventral anterior cingulum were activated during periodic leg movements in RLS patients41. Therefore, the activated brain regions associated with PLMS in RLS patients constitute the large-scale motor network, including the sensorimotor cortex with motor control regions, and mostly in agreement with the areas associated with voluntary movement.
It is important to consider the possibility that brain regions associated with PLMS are specific to PLMS or rep- resent only an EEG arousal response. LMs in PLMS are sometimes accompanied by arousal, and in some previous reports in the literature, PLMS has been considered a kind of arousal response2,8,42. In this regard, it is necessary to confirm that the EEG source of this study is not simply caused by arousal; therefore, we evaluated spectral power associated with spontaneous arousal during sleep. The delta power associated with spontaneous arousal, which was not associated with any other events, was initially observed at the medial frontal area at −2 ~ 0 seconds and spanned over the left temporal area at 0~2 seconds (Fig. S4). The topographic data obtained for PLMS were initially different but overlapped with the sites activated during spontaneous arousal: the spectral power of the delta band in the central area initially increased at −3 ~ -2 seconds before PLMS, and subsequently, the medial frontal area was activated at −2 ~ -1 seconds (Fig. 2). This medial frontal activation in PLMS may indicate the late arousal response after motor network activation. Hence, the sources of PLMS found in this study were more associated with motor initiation rather than a related arousal response in agreement with studies by Ferri et al.43.
Neural substrates related to the severity of PLMS are proposed in the present study including inferior parietal, temporoparietal junction, and middle frontal regions. For example, subjects with more delta activity in the right inferior parietal region tended to have higher PLMSI (Fig. 4). Thus, these cortical regions are likely to be the neural substrates underlying the severity of PLMS. Increasing evidence in neuroimaging and neuroanatomical studies supports the idea that inferior parietal lobule as the default mode network is involved in motor control preparation and execution13,44,45. Interestingly, aforementioned fMRI study found that multiple areas, including the right inferior parietal lobule, were activated in periodic leg movements during wakefulness in RLS patients41. The results of the present study suggest that the default mode network with prefrontal motor control pathway may play a role in PLMS. In addition, the regions related to the severity were mainly observed in the right hemisphere, possibly due to hemispheric functional lateralization. Previous studies have shown that the right hemisphere has a specific role in motor control and that there is a right hemisphere preference for the control of slow repetitive movement46,47. From our results, it can be suggested that the severity in PLMS might be more associated with the right hemisphere.
Structural MRI data in RLS patients need to be reassessed because cortical structural changes have been mostly investigated in RLS patients. Previous studies using diffusion images or voxel-based morphometry in RLS patients in part support our results of brain regions associated with PLMS. Diffusion tensor imaging of RLS patients revealed that reduced fractional anisotropy was observed in the subcortical areas close to the motor and the somatosensory cortices as well as parts of the limbic system40. Connor et at. found decreases in white mat- ter volume in RLS patients in the corpus callosum, anterior cingulum, and precentral gyrus using postmortem imaging analysis39. In another study with 28 RLS patients, the same group of researchers found decreases of cor- tical thickness in bilateral postcentral gyrus and corpus callosum posterior midbody indicating somatosensory pathway48. Interestingly, contrary to previous studies, recent multimodal MRI study by Stefani et al. with 87 RLS patients identified increases of gray matter volume of primary sensory cortex bilaterally, the left premotor cor- tex, and the right parietal inferior lobe which would fit to the concept of adaptive cortical plasticity as a result of increased neuronal activation during PLMS49. Further studies are needed to investigate the implication and causal relationship of a cortical role in PLMS with RLS.
Our results have clinical implications in terms of therapeutic targets for neuromodulatory treatment. Various neuromodulatory therapies, including transcranial direct current stimulation and repetitive transcranial mag- netic stimulation, have been applied in patients with RLS50–53. One of the most important points to be considered is the therapeutic target to which stimulation should be given. Most studies have given stimulation on the primary motor cortex or supplementary motor area. EEG sources found in the present study may provide insight for new therapeutic targets for neuromodulation in the treatment of RLS with PLMS.
The present study needs to be interpreted in light of several limitations, as follows. First, the number of RLS patients analyzed in this study was small because PSG equipped with 19-channel EEG cannot be routinely per- formed. Further research with a larger number of patients using extended EEG channels is needed to support our results and the precise role and association of cortical contribution of PLMS. Second, the EEG source localization was relatively sparse because of the limitations inherent to our study methods. The number of EEG electrodes was not high (19 channels), and the standard electrode location coordinates and standard MRI template were applied without using individual data. Third, the role of subcortical regions during PLMS could not be evaluated in the present study, which was based on the electrophysiological analysis of cortical signals. Stereo-EEG studies, if researchers have opportunities such as presurgical evaluations using intracranial electrodes in patients with epilepsy, would therefore be helpful. Fourth, in the present study, PLMS was evaluated only in RLS patients, and various conditions associated with PLMS may have different characteristics54. Thus, whether the brain regions
References
1. Coleman, R. M., Pollak, C. P. & Weitzman, E. D. Periodic movements in sleep (nocturnal myoclonus): relation to sleep disorders.
Ann. Neurol. 8, 416–421, https://doi.org/10.1002/ana.410080413 (1980).
2. Karadeniz, D., Ondze, B., Besset, A. & Billiard, M. EEG arousals and awakenings in relation with periodic leg movements during sleep. J. Sleep. Res. 9, 273–277 (2000).
3. Sasai, T., Matsuura, M. & Inoue, Y. Change in heart rate variability precedes the occurrence of periodic leg movements during sleep:
an observational study. BMC Neurol. 13, 139, https://doi.org/10.1186/1471-2377-13-139 (2013).
4. Allena, M. et al. Periodic limb movements both in non-REM and REM sleep: relationships between cerebral and autonomic activities. Clin. Neurophysiol. 120, 1282–1290, https://doi.org/10.1016/j.clinph.2009.04.021 (2009).
5. Guggisberg, A. G., Hess, C. W. & Mathis, J. The significance of the sympathetic nervous system in the pathophysiology of periodic leg movements in sleep. Sleep. 30, 755–766 (2007).
6. Ferri, R. et al. Heart rate and spectral EEG changes accompanying periodic and non-periodic leg movements during sleep. Clin.
Neurophysiol. 118, 438–448, https://doi.org/10.1016/j.clinph.2006.10.007 (2007).
7. Lavoie, S., de Bilbao, F., Haba-Rubio, J., Ibanez, V. & Sforza, E. Influence of sleep stage and wakefulness on spectral EEG activity and heart rate variations around periodic leg movements. Clin. Neurophysiol. 115, 2236–2246, https://doi.org/10.1016/j.
clinph.2004.04.024 (2004).
8. Ferrillo, F. et al. Changes in cerebral and autonomic activity heralding periodic limb movements in sleep. Sleep. Med. 5, 407–412, https://doi.org/10.1016/j.sleep.2004.01.008 (2004).
9. Koo, B. B. et al. Association of incident cardiovascular disease with periodic limb movements during sleep in older men: outcomes of sleep disorders in older men (MrOS) study. Circulation 124, 1223–1231, https://doi.org/10.1161/CIRCULATIONAHA.111.038968 (2011).
10. Suzuki, M., Miyai, I., Ono, T. & Kubota, K. Activities in the frontal cortex and gait performance are modulated by preparation. An fNIRS study. Neuroimage 39, 600–607, https://doi.org/10.1016/j.neuroimage.2007.08.044 (2008).
11. Cunnington, R., Windischberger, C., Deecke, L. & Moser, E. The preparation and execution of self-initiated and externally-triggered movement: a study of event-related fMRI. Neuroimage 15, 373–385, https://doi.org/10.1006/nimg.2001.0976 (2002).
12. Libet, B., Gleason, C. A., Wright, E. W. & Pearl, D. K. Time of conscious intention to act in relation to onset of cerebral activity (readiness-potential). The unconscious initiation of a freely voluntary act. Brain 106(Pt 3), 623–642 (1983).
13. Malouin, F., Richards, C. L., Jackson, P. L., Dumas, F. & Doyon, J. Brain activations during motor imagery of locomotor-related tasks:
a PET study. Hum. Brain Mapp. 19, 47–62, https://doi.org/10.1002/hbm.10103 (2003).
14. Guillot, A., Di Rienzo, F. & Collet, C. The neurofunctional architecture of motor imagery. In Advanced Brain Neuroimaging Topics in Health and Disease - Methods and Applications (ed. Papageorgiou, T. D., Christopoulos, G. I. & Smirnakis, S. M.) 433–456 (IntechOpen, 2014).
15. Shibasaki, H. Cortical activities associated with voluntary movements and involuntary movements. Clin. Neurophysiol. 123, 229–243, https://doi.org/10.1016/j.clinph.2011.07.042 (2012).
16. Ghosh, A., Rothwell, J. & Haggard, P. Using voluntary motor commands to inhibit involuntary arm movements. Proc. Biol. Sci. 281, 20141139, https://doi.org/10.1098/rspb.2014.1139 (2014).
17. Gallea, C. et al. Intrinsic signature of essential tremor in the cerebello-frontal network. Brain 138, 2920–2933, https://doi.
org/10.1093/brain/awv171 (2015).
18. Ferri, R., Koo, B. B., Picchietti, D. L. & Fulda, S. Periodic leg movements during sleep: phenotype, neurophysiology, and clinical significance. Sleep. Med. 31, 29–38, https://doi.org/10.1016/j.sleep.2016.05.014 (2017).
19. Ferri, R. et al. New approaches to the study of periodic leg movements during sleep in restless legs syndrome. Sleep. 29, 759–769 (2006).
20. Ferri, R. et al. Night-to-night variability of periodic leg movements during sleep in restless legs syndrome and periodic limb movement disorder: comparison between the periodicity index and the PLMS index. Sleep. Med. 14, 293–296, https://doi.
org/10.1016/j.sleep.2012.08.014 (2013).
21. Pascual-Marqui, R. D. Standardized low-resolution brain electromagnetic tomography (sLORETA): technical details. Methods Find.
Exp. Clin. Pharmacol. 24 Suppl D, 5–12 (2002).
22. Jung, K. Y. et al. Sternberg working memory performance following treatment with pramipexole in patients with moderate-to-severe restless legs syndrome. Sleep. Med. 16, 703–708, https://doi.org/10.1016/j.sleep.2014.10.025 (2015).
23. Allen, R. P. et al. Restless legs syndrome: diagnostic criteria, special considerations, and epidemiology. A report from the restless legs syndrome diagnosis and epidemiology workshop at the National Institutes of Health. Sleep. Med. 4, 101–119 (2003).
24. Cho, Y. W. et al. The reliability and validity of the Korean version of paradigm of questions for epidemiology studies of restless legs syndrome and the Johns hopkins telephone diagnostic interview form for the restless legs syndrome. J. Korean Neurol. Assoc. 25, 494–499 (2007).
25. Kim, S. M. et al. Working memory deficit in patients with restless legs syndrome: an event-related potential study. Sleep. Med. 15, 808–815, https://doi.org/10.1016/j.sleep.2014.03.010 (2014).
26. Iber, C., Ancoli-Israel, S., Chesson, A. L. & Quan, S. The AASM Manual for the Scoring of Sleep and Associated Events: Rules, Terminology, and Technical Specification. (American Academy of Sleep Medicine, 2007).
27. Zucconi, M. et al. The official World Association of Sleep Medicine (WASM) standards for recording and scoring periodic leg movements in sleep (PLMS) and wakefulness (PLMW) developed in collaboration with a task force from the International Restless Legs Syndrome Study Group (IRLSSG). Sleep. Med. 7, 175–183, https://doi.org/10.1016/j.sleep.2006.01.001 (2006).
28. Harmony, T. The functional significance of delta oscillations in cognitive processing. Front. Integr. Neurosci. 7, 83, https://doi.
org/10.3389/fnint.2013.00083 (2013).
29. Parrino, L., Halasz, P., Tassinari, C. A. & Terzano, M. G. CAP, epilepsy and motor events during sleep: the unifying role of arousal.
Sleep. Med. Rev. 10, 267–285, https://doi.org/10.1016/j.smrv.2005.12.004 (2006).
30. Popovych, S. et al. Movement-related phase locking in the delta-theta frequency band. Neuroimage 139, 439–449, https://doi.
org/10.1016/j.neuroimage.2016.06.052 (2016).
31. Tadel, F., Baillet, S., Mosher, J. C., Pantazis, D. & Leahy, R. M. Brainstorm: a user-friendly application for MEG/EEG analysis.
Comput. Intell. Neurosci. 2011, 879716, https://doi.org/10.1155/2011/879716 (2011).
32. Talairach, J. & Tournoux, P. Co-planar stereotaxic atlas of the human brain: 3-dimensional proportional system: an approach to cerebral imaging. (Thieme, 1988).
33. Benjamini, Y. & Hochberg, Y. Controlling the false discovery rate: a practical and powerful approach to multiple testing. Journal of the royal statistical society. Series B (Methodological), 289–300 (1995).
34. Leech, R. & Sharp, D. J. The role of the posterior cingulate cortex in cognition and disease. Brain 137, 12–32, https://doi.org/10.1093/
brain/awt162 (2014).
35. Ball, T. et al. The role of higher-order motor areas in voluntary movement as revealed by high-resolution EEG and fMRI. Neuroimage 10, 682–694, https://doi.org/10.1006/nimg.1999.0507 (1999).
36. Isomura, Y., Ito, Y., Akazawa, T., Nambu, A. & Takada, M. Neural coding of “attention for action” and “response selection” in primate anterior cingulate cortex. J. Neurosci. 23, 8002–8012 (2003).
37. Paus, T. Primate anterior cingulate cortex: where motor control, drive and cognition interface. Nat. Rev. Neurosci. 2, 417–424, https://doi.org/10.1038/35077500 (2001).
38. Cervenka, S. et al. Support for dopaminergic hypoactivity in restless legs syndrome: a PET study on D2-receptor binding. Brain 129, 2017–2028, https://doi.org/10.1093/brain/awl163 (2006).
39. Connor, J. R. et al. Postmortem and imaging based analyses reveal CNS decreased myelination in restless legs syndrome. Sleep. Med.
12, 614–619, https://doi.org/10.1016/j.sleep.2010.10.009 (2011).
40. Unrath, A., Muller, H. P., Ludolph, A. C., Riecker, A. & Kassubek, J. Cerebral white matter alterations in idiopathic restless legs syndrome, as measured by diffusion tensor imaging. Mov. Disord. 23, 1250–1255, https://doi.org/10.1002/mds.22074 (2008).
41. Margariti, P. N. et al. Investigation of unmedicated early onset restless legs syndrome by voxel-based morphometry, T2 relaxometry, and functional MR imaging during the night-time hours. AJNR Am. J. Neuroradiol. 33, 667–672, https://doi.org/10.3174/ajnr.A2829 (2012).
42. Sforza, E., Juony, C. & Ibanez, V. Time-dependent variation in cerebral and autonomic activity during periodic leg movements in sleep: implications for arousal mechanisms. Clin. Neurophysiol. 113, 883–891 (2002).
43. Ferri, R. et al. An Evidence-based Analysis of the Association between Periodic Leg Movements during Sleep and Arousals in Restless Legs Syndrome. Sleep. 38, 919–924, https://doi.org/10.5665/sleep.4740 (2015).
44. Desmurget, M. & Sirigu, A. A parietal-premotor network for movement intention and motor awareness. Trends Cogn. Sci. 13, 411–419, https://doi.org/10.1016/j.tics.2009.08.001 (2009).
45. Lebon, F., Horn, U., Domin, M. & Lotze, M. Motor imagery training: Kinesthetic imagery strategy and inferior parietal fMRI activation. Hum. Brain Mapp. 39, 1805–1813, https://doi.org/10.1002/hbm.23956 (2018).
46. Mani, S. et al. Contralesional motor deficits after unilateral stroke reflect hemisphere-specific control mechanisms. Brain 136, 1288–1303, https://doi.org/10.1093/brain/aws283 (2013).
47. Pflug, A., Gompf, F. & Kell, C. A. Bimanual tapping of a syncopated rhythm reveals hemispheric preferences for relative movement frequencies. Hum. Mov. Sci. 54, 287–296, https://doi.org/10.1016/j.humov.2017.06.001 (2017).
48. Lee, B. Y. et al. Involvement of the central somatosensory system in restless legs syndrome: A neuroimaging study. Neurol. 90, e1834–e1841, https://doi.org/10.1212/WNL.0000000000005562 (2018).
49. Stefani, A. et al. Multimodal Magnetic Resonance Imaging reveals alterations of sensorimotor circuits in restless legs syndrome.
Sleep. 42, zsz171, https://doi.org/10.1093/sleep/zsz171 (2019).
50. Heide, A. C. et al. Effects of transcutaneous spinal direct current stimulation in idiopathic restless legs patients. Brain Stimul. 7, 636–642, https://doi.org/10.1016/j.brs.2014.06.008 (2014).
51. Altunrende, B., Yildiz, S., Cevik, A. & Yildiz, N. Repetitive transcranial magnetic stimulation in restless legs syndrome: preliminary results. Neurol. Sci. 35, 1083–1088, https://doi.org/10.1007/s10072-014-1653-4 (2014).
52. Koo, Y. S. et al. Transcranial direct current stimulation on primary sensorimotor area has no effect in patients with drug-naive restless legs syndrome: a proof-of-concept clinical trial. Sleep. Med. 16, 280–287, https://doi.org/10.1016/j.sleep.2014.07.032 (2015).
53. Liu, C. et al. Mapping intrinsic functional brain changes and repetitive transcranial magnetic stimulation neuromodulation in idiopathic restless legs syndrome: a resting-state functional magnetic resonance imaging study. Sleep. Med. 16, 785–791, https://doi.
org/10.1016/j.sleep.2014.12.029 (2015).
54. Ferri, R. The time structure of leg movement activity during sleep: the theory behind the practice. Sleep. Med. 13, 433–441, https://
doi.org/10.1016/j.sleep.2011.10.027 (2012).
Acknowledgements
This work was supported by the National Research Foundation of Korea (NRF) grants funded by the Korea government (MSIT; Ministry of Science and ICT) (NRF-2017R1A2B2012280, NRF-2017M3C7A1029485, and NRF-2019R1I1A1A01064291). The funding body had no role in the conception, design, conduct, interpretation, or analysis of the study nor in the approval of the publication. The authors thank all of the participants enrolled in this study. We appreciate Byeong Uk Lee, RPSGT, for his contribution to polysomnographic recording and scoring.
Author contributions
K.Y.J. and S.K.L. conceptualized and designed the study, supervised all of the aspects of the research project, and critically reviewed the manuscript. T.J.K. and K.S.C. managed the data, conceptualized and conducted the data analyses, drafted the initial manuscript, and reviewed and revised the manuscript. S.L managed the data and conducted the data analyses. T.W.Y., K.T.K., B.S.P. and J.S.J. conducted the data analyses and critically reviewed the manuscript. J.A.L., J.I.B., J.S.S., J.W.S. and K.H.K. conceptualized the study and critically reviewed the manuscript. All authors approved the final manuscript as submitted and agree to be accountable for all aspects of the work.
competing interests
The authors declare no competing interests.
© The Author(s) 2020