DNA Polymorphism and Assessments of Genetic Relationships in genus Zoysia Based on Simple Sequence Repeat Markers
Man Kyu Huh*
Department of Molecular Biology, Dong-eui University, Busan 614-714, Korea Received October 8, 2014 /Revised March 9, 2015 /Accepted March 9, 2015
The genetic variability of four species of the genus Zoysia collected from South Korea was analyzed using an inter-simple sequence repeat (ISSR) marker system. Polymerase chain reactions (PCR) with eight ISSR primers generated 86 amplicons, 76 (87.1%) of which were polymorphisms. The poly- morphism information content (PIC) value of the ISSR marker system was 0.848. The percentage of polymorphic loci (Pp) ranged from 41.2% to 44.7%. Nei’s gene diversity (H) ranged from 0.149 to 0.186, with an average overall value of 0.170. The mean of Shannon’s information index (I) value was 0.250. Total genetic diversity values (HT) varied between 0.356 (ISSR-1) and 0.418 (ISSR-16), for an average overall polymorphic loci of 0.345. Interlocus variation in within-species genetic diversity (HS) was low (0.170). On a per-locus basis, the proportion of total genetic variation due to differences among species (GST) was 0.601. This indicated that about 60.1% of the total variation was among species. Thus, about 39.9 of genetic variation was within species. The estimate of gene flow, based on GST, was very low among species of the genus Zoysia (Nm = 0.332). The phylogenic tree showed three distinct groups: Z. macrostachya and Z. tenuifolia clades and other species were formed the separated clusters. In conclusion, the ISSR assay was useful for detecting genetic variation in the genus Zoysia, and its discriminatory power was comparable to that of other genotyping tools.
Key words : Genetic variability, genus Zoysia, polymorphism information content (PIC), phylogenic tree, simple sequence repeat markers (ISSR)
*Corresponding author
*Tel : +82-51-890-1521, Fax : +82-51-890-1529
*E-mail : [email protected]
This is an Open-Access article distributed under the terms of the Creative Commons Attribution Non-Commercial License (http://creativecommons.org/licenses/by-nc/3.0) which permits unrestricted non-commercial use, distribution, and reproduction in any medium, provided the original work is properly cited.
Journal of Life Science 2015 Vol. 25. No. 3. 257~262 DOI : http://dx.doi.org/10.5352/JLS.2015.25.3.257
Introduction
The genus Zoysia Willd. (Family Poaceae, subfamily Chlor- idoideae, tribe Zoysiece) includes about ten species [7] and is commonly known as zoysiagrass (Zoysia sp.) or lawn.
Zoysiagrass is found throughout East Asia (China, Korea and Japan) and Australasia, grown especially in warm re- gions [17, 27].
Wild species belonging genus Zoysia have been survived though long-term natural selection [13], and thereby can tol- erate wide variations in temperature, sunlight, and water.
Zoysiagrass is widely used for turfgass and forage grass in as Korea and other countries in East Asia. Zoysia grasses can diminish soil erosion on slopes, and are excellent at re- pelling weeds throughout the year. Some types of Zoysia are available commercially as making lawn ground, park grass,
and garden grass. In addition, they are used on golf courses to create fairways and teeing areas after several hybrid- ization processes.
DNA markers have numerous applications in plant mo- lecular genetic research [6]. The two most common uses of DNA markers have been the assessment of genetic diversity within plant germplasm and evolutionary relationship with- in or among species [12, 19]. One major use of DNA techni- ques is to reveal genetic diversity within and between pop- ulations or species.
Inter simple sequence repeat (ISSR) technique is a poly- merase chain reaction (PCR) based technique, reported by Zietkiewicz et al. [34]. ISSR technique involves PCR amplifi- cation of DNA using a single primer composed of a micro- satellite sequence. ISSR technique involves amplification of DNA segments between two identical microsatellite repeat regions oriented in opposite direction using primers de- signed from microsatellite core regions [29]. The ISSR has mild technical difficulty, good reproducibility and reason- able cost, permitting its use for genetic studies of population.
PCR products were resolved by performing agarose gel electrophoresis. Compared to arbitrary markers such as ran- dom amplified polymorphic DNA (RAPD), ISSR markers are
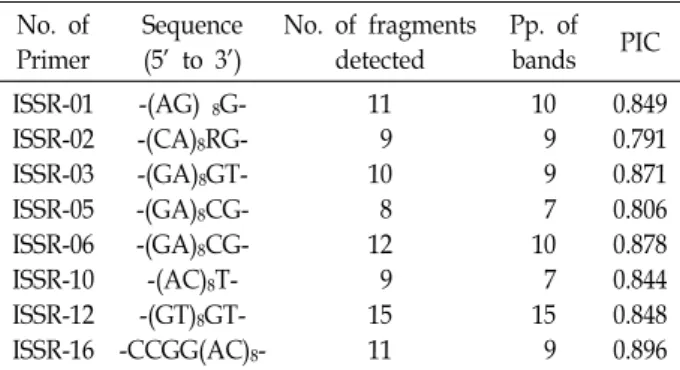
Table 1. Lists of decamer oligonucleotide utilized as primers, their sequences, and associated bands for Korean genus Zoysia
No. of Primer
Sequence (5’ to 3’)
No. of fragments detected
Pp. of
bands PIC
ISSR-01 ISSR-02 ISSR-03 ISSR-05 ISSR-06 ISSR-10 ISSR-12 ISSR-16
-(AG) 8G- -(CA)8RG- -(GA)8GT- -(GA)8CG- -(GA)8CG- -(AC)8T- -(GT)8GT- -CCGG(AC)8-
11 9 10 8 12 9 15 11
10 9 9 7 10 7 15 9
0.849 0.791 0.871 0.806 0.878 0.844 0.848 0.896 highly reproducible due to the use of longer primers.
Considering the potentials of the ISSR marker based ge- netic diversity analysis, the present study aimed to evaluate the extent of genetic diversity and phylogenetic relationships among four species of genus Zoysia collected from Korea.
Materials and Methods
Sample materials
Four species within genus Zoysia Willd. occur in Korea.
Zoysia japonica Steud., Z. macrostachya Franch. et Savat., Z.
sinica Hance, and Z. tenuifolia Willd. were selected. Plant ma- terials collected from four large natural populations per species. To avoid including individuals from the same line- age by clonal reproduction, the distance between the selected individuals was about 5.0 m. Arundinella hirta (Thunb.) Koidz. was used as an outgroup species in this study.
Genomic DNA isolation and ISSR analysis The total genomic DNA was extracted from the leaf tis- sues using the plant DNA Zol Reagent (Life Technologies Inc., Grand Island, New York, USA) according to the manu- facturer’s protocol. DNA quantity was checked using a mini fluorometer (TKO 100 Mini-Fluorometer, Hoefer Scientific Instruments).
ISSR primers (University of British Columbia, Canada) synthesized by Sigma Aldrich Inc., were used for the poly- morphism survey (Table 1).
PCR (polymerase chain reaction) amplification was car- ried out in 25 μl reaction containing 25 ng of genomic DNA, 1 μM of primer, 10 mM of dNTPs (2.5 mM each), 50 mM KCl, 10 mM Tris HCl (pH 8.3), 2.5 mM MgCl2, 0.3 units (U) of Taq DNA polymerase (Promega, USA). PCR con- ditions were programmed for initial denaturation at 94°C
for 5 min, 36 cycles of 1 min denaturation at 94°C, 45 sec annealing at 42-50°C, 2 min extension at 72°C, and final ex- tension for 10 min at 72°C. The annealing temperature for PCR amplification was maintained based on the specificity of the primer pair used. PCR amplified products of ISSR primers were subject to horizontal gel electrophoresis using 2.0% agarose gel and stained with ethidium bromide. The bands on gels were documented using Alpha Imager 1200TM (Alpha Innotech Co., USA). All the reactions were repeated twice and only reproducible bands were scored for analyses.
Data analysis
The unambiguous ISSR bands were scored visually as present (1) or absent (0) and the binary data matrix was constructed. Several standard genetic parameters, the per- centage of polymorphic loci (Pp), mean number of alleles per locus (A), effective number of alleles per locus (AE), Nei’s [21] gene diversity (H), and Shannon’s Information index (I) were estimated using the computer program, POPGENE ver.
1.31 [33]. Polymorphism information content (PIC) value was calculated using the formula PIC, 1 - ∑ pi2, where pi is the frequency of the ith allele [25].
The estimation of genetic similarity (GS) between geno- types was based on the probability that an amplified frag- ment from one individual will also be present in another [23]. GS was converted to genetic distance (1-GS) [15].
Species differentiation analyses have been assessed within and among according to Nei's gene diversity formulae (HT, HS, and GST) [22]. The GST coefficient corresponds to the rela- tive amount of differentiation among populations or species.
Furthermore, gene flow (Nm) between the pairs of species was calculated from GST values by Nm = 0.5(1/GST-1) [20].
Shannon’s index of genotypic diversity (HO) for ISSR was estimated to quantity the degree of within species diversity following the formula [3]: HO = –∑pi log pi, where pi is the frequency of a particular phenotype i.
HO can be calculated and compared for different pop- ulations [24]. Let
HPOP = 1/n HO
be the average diversity over the n different populations and let
HSP =–∑p log p
be the diversity of species calculated from the phenotypic frequencies p in all the species considered together [24].
Then the proportion of diversity within species, HPOP/HSP,
Table 2. Codes of countries and measurements of genetic variation for genus Zoysia
Code Np Pp A AE H I
Zoysia sinica Z. macrostachya Z. japonica Z. tenuifolia Mean
38 35 40 36 37.3
44.7 41.2 47.1 42.4 43.9
1.447 1.412 1.471 1.424 1.439
1.334 1.253 1.325 1.280 1.298
0.186 0.149 0.184 0.162 0.170
0.269 0.222 0.270 0.240 0.250
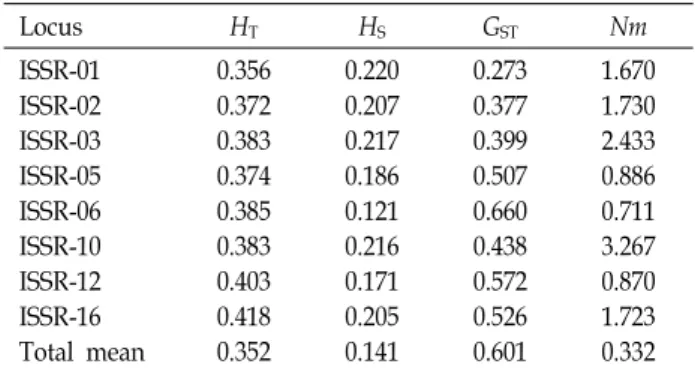
Table 3. Estimates of genetic diversity of genus Zoysia in Korea
Locus HT HS GST Nm
ISSR-01 ISSR-02 ISSR-03 ISSR-05 ISSR-06 ISSR-10 ISSR-12 ISSR-16 Total mean
0.356 0.372 0.383 0.374 0.385 0.383 0.403 0.418 0.352
0.220 0.207 0.217 0.186 0.121 0.216 0.171 0.205 0.141
0.273 0.377 0.399 0.507 0.660 0.438 0.572 0.526 0.601
1.670 1.730 2.433 0.886 0.711 3.267 0.870 1.723 0.332 Total genetic diversity (HT), genetic diversity within populations (HS), the proportion of total genetic diversity partitioned among populations (GST), and gene flow (Nm).
Table 4. Genetic identity (above diagonal) and genetic distances (below diagonal) of genus Zoysia based on ISSR Code sinica macrostachya japonica tenuifolia Z. sinica
Z. macrostachya Z. japonica Z. tenuifolia
- 0.4697 0.3381 0.4015
0.6252 - 0.2550 0.3239
0.7132 0.7749
- 0.2067
0.6693 0.7233 0.8132
-
Table 5. Partitioning of the genetic diversity into within and among genus Zoysia in Korea
Primer HVAR HSP HVAR/ HSP (HSP- HVAR) / HSP
ISSR-01 ISSR-02 ISSR-03 ISSR-05 ISSR-06 ISSR-10 ISSR-12 ISSR-16 Total mean
1.552 1.663 1.693 1.769 1.125 1.732 1.588 2.128 1.706
2.373 2.245 2.213 2.131 2.423 2.123 3.194 2.338 2.380
0.654 0.741 0.765 0.830 0.464 0.816 0.497 0.910 0.710
0.346 0.259 0.235 0.170 0.536 0.184 0.503 0.090 0.290 can compared with that between species (HSP-HPOP)/HSP.
Cluster analyses
A phenetic relationship was constructed by the neighbor joining (NJ) method using the NEIGHBOR program in MEGA5 [28].
Results
For analysis of variability of genus Zoysia, eight primers were used for studying the ISSR banding patterns across the entire samples. The eight primers generated a total of 85 consistently scorable bands, 76 of which were polymorphic (89.4% polymorphism) (Table 1). The average number of am- plification products was 10.6 per primer; the maximum was 15 with (GT)8YT (ISSR-12), whereas the minimum was 8 with (GA)8CG (ISSR-5).
Polymorphism information content (PIC) for ISSR primers ranged from 0.791 to 0.896 with an average of 0.848 per pri- mer (Table 1).
In a simple measure of inter-populations variability i.e.
the percentage of polymorphic bands (Pp), Z. japonica ex- hibited the highest variation (47.1%) and Z. tenuifolia the lowest (41.2%) (Table 2). The average number of alleles per locus (A) was 1.439 across species, varying from 1.412 to 1.471. The effective numbers of alleles per locus (AE) at the lowest species and the highest species level were 1.253 and 1.334, respectively. The mean genetic diversity within spe- cies was 0.170. Overall, Z. sinica and Z. japonica exhibited high variation among species. Z. macrostachya and Z. ten- uifolia was shown the low genetic variation.
Total genetic diversity values (HT) varied between 0.356 (ISSR-1) and 0.418 (ISSR-16), for an average over all poly- morphic loci of 0.345 (Table 3). Interlocus variation in the within-species genetic diversity (HS) was low (0.170). On a per-locus basis, the proportion of total genetic variation due to differences among species (GST) ranged from 0.273 for ISSR-1 to 0.660 for ISSR-6, with a mean of 0.506. This in-
dicated that about 50.6% of the total variation was among species. Thus, about genetic variation (40.4%) resided within species. The estimate of gene flow, based on GST, was very low among species of genus Zoysia (Nm = 0.488). Values of genetic distance (D) were <0.470 (Table 4). Genetic identity values among pairs of populations ranged from 0.625 to 0.813. Genetic distances between species were high. There was not shown significant difference among four species.
An assessment of the proportion of diversity present within species, HPOP/HSP, indicated that about 71.0% the to- tal genetic diversity was among species. Thus, the other por- tion of genetic variation (29.0%) resided within species (Table 5).
Z. japonica Z. sinica Z. macrostachya Z. tenuifolia A. hirta DNA changes
30 25 20 15 10 5 0
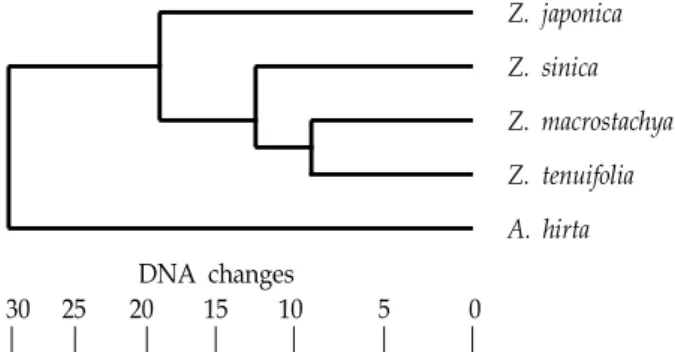
Fig. 1. The tree for Korean genus Zoysia based on ISSR analysis using MEGA5.
Clustering of four species of genus Zoysia, using the NJ algorithm, was performed based on the matrix of calculated distances (Fig. 1). Four species of genus Zoysia were well separated each other. The phylogenic tree showed three dis- tinct groups; Z. macrostachya and Z. tenuifolia clade and the other species.
Discussion
Genetic diversity of Korean Zoysia species is comparable with other species, although the use of different methods (e.g., isozyme [co-dominant marker] and RAPD [dominant marker], ISSR [sequence based marker system) may preclude meaningful direct comparisons.
In ISSR analysis, nine species belonging to genus Zoysia maintain moderate or higher than mean level of genetic di- versity compared with other plant species [10]. For example, the percentage of polymorphic loci at the species level for Zoysia is 43.9%, which is similar to species with temper- ature-zone distributions (48.5%), species with a sexual and asexual reproduction mode (43.8%), and those with a short-lived perennial herbaceous (41.3%) (Hamrick and Godt 1989). Its genetic diversity of 0.170 is higher than that for temperate-zone species (0.146), species with a sexual and asexual reproduction mode (0.138), and those with a short-lived perennial herbaceous (0.116) [10].
The results of other research for Zoysia were similar to the results of this study. Choi et al. [5] analyzed 93 native zoysiagrass lines collected from the southern and western coastal regions of South Korea. They also estimated genetic diversity of zoysiagrass using RAPD [4]. Weng et al. [30]
also analyzed genetic diversity of 131 clones of Taiwan Zoysia species by using isozyme and RAPD. Li and Tong [16] reported genetic diversity of 105 plants from seven Z.
sinica populations in different regions of China using ten RAPD primers. About 4.8, 30, and 70% of the genetic varia- tion was detected among groups, populations, and within populations, respectively. In ISSR literature, polymorphism and genetic diversity (H) within species in Chinese zoysia- grass were 96.7% and 0.250, respectively [31].
The relatively high level of genetic variation found in ge- nus Zoysia is consistent with several aspects of its biology.
First, the particular breeding system that a plant possesses is an important determinant of variability at both the species and population levels. Flowering plants exhibit a spectacular diversity in reproductive systems, and this can have im- portant effects on the amount and structuring of genetic var- iation within and among populations [9]. Species of the ge- nus Zoysia are rarely reproduced sexually and pertetuates theyselves clonally by rhizomes [1]. Whereas sexual re- production might initially act to enhance genetic variation, asexual reproduction can maintain this enhanced variability [2]. Second, a perennial and/or long-lived species generally maintains relatively higher levels of variation than do annu- als [18]. Because individuals of genus Zoysia are so long- lived, opportunities for the accumulation of mutations should be high [14].
Genetic differentiation among populations is principally a function of natural selection, genetic drift, and gene flow among populations via pollen and seed dispersal [26]. Of the total variation observed in Zoysia species about 20.0- 27.7% was due to differences among species (GST = 0.601, HVAR)/HSP = 0.710). Predominantly wind-pollinated out- crossing species have on an average less than 10 % of the genetic variation between populations [11]. This high level of genetic differentiation also suggests that gene flow among species is low (Nm = 0.332), though no chromosomal barrier of interspecific crossing [8, 32].
References
1. Anderson, S. J. 2000. Taxonomy of Zoysia (Poaceae): Mor- phological and molecular variation. Ph.D. dissertation, Texas A&M Univ., Texas, USA.
2. Bayer, R. J. 1990. Patterns of clonal diversity in the Antennaria rosea (Asteraceae) polyploid agamic complex. Am. J. Bot. 77, 1313-1319.
3. Bowman, K. D., Hutcheson, K., Odum, E. P. and Shenton, L. R. 1971. Comments on the distribution of indices of diversity. Stat. Ecol. 3, 315-359.
4. Choi, J. S., Ahn, B. J. and Yang, G. M. 1997a. Classification of zoysiagrasses (Zoysia spp.) native to the southwest coastal
regions of Korea using RAPDs. J. Kor. Soc. Hort. Sci. 38, 789-795.
5. Choi, J. S., Ahn, B. J. and Yang, G. M. 1997b. Distribution of native zoysiagrasses (Zoysia spp.) in the south and west coastal regions of Korea and classification using morpho- logical characteristics. J. Kor. Soc. Hort. Sci. 38, 399-407.
6. Collard, B. C. Y. and Mackill, D. J. 2009. Start codon targeted (SCoT) polymorphism: a simple, novel DNA marker techni- que for generating gene-targeted markers in plants. Plant Mol. Biol. Rep. 27, 86-93.
7. Engelke, M. and Anderson, S. 2003. Zoysiagrasses (Zoysia spp.), pp. 271-286. In: M. D. Casler and Cuncan, R. R. (eds.), Turfgrass Biology, Genetics, and Breeding. John Wiley & Sons, Hoboken, NJ.
8. Forbes, I. Jr. 1952. Chromosome numbers and hybrids in Zoysia. Agron. J. 44, 194-199.
9. Glemin, S., Bazin, E. and Charlesworth, D. 2006. Impact of mating systems on patterns of sequence polymorphism in flowering plants. Proc. Biol. Sci. 273, 3011-3019.
10. Hamrick, J. L. and Godt, M. J. W. 1989. Allozyme diversity in plant species, pp. 304-319. In: Brown, A. H. D., Clegg, M. T., Kahler, A. L. and Weir, B. S. (eds.), Plant Population Genetics, Breeding and Genetic Resources. Sinauer Sunderland, MA.
11. Hamrick, J. L., Godt, M. J. W. and Sherman-Broyles, S. L.
1992. Factors influencing levels of genetic diversity in woody plant species. New For. 6, 95-124.
12. Hu, J. and Vick, B. A. 2003. Target region amplification poly- morphism: a novel marker technique for plant genotyping.
Plant Mol. Biol. Rep. 21, 289-294.
13. Jin, H. and Han, L. B. 2004. Progress on genetic diversity of Zoysia japonica Steud. J. Bejing. For. Uni. 26, 91-95.
14. Ledig, F. T. 1986. Heterozygosity, heterosis, and fitness in outbreeding plants, pp. 77-104. In: Soule, M. E. (ed.), Conservation Biology. Sinauer Sunderland, MA.
15. Le Thierry d’Enneequin, M., Poupance, B. and Starr, A.
2000. Assessment of genetic relationships between Setaria italica and its wild relative S. viridis using AFLP markers.
Theor. Appl. Genet. 100, 1061-1066.
16. Li, Y. and Tong, H. Y. 2004. Genetic differentiation in Zoysia sinica populations revealed by RAPD markers. Guihaia 24, 345-349.
17. Loch, D. S., Simon, B. K. and Poulter, R. E. 2005. Taxonomy, distribution, and ecology of Zoysia macrantha Desv., an Australian native species with turf breeding potential. Int.
Turfgrass Soc. Res. J. 10, 593-599.
18. Loveless, M. D. and Hamrick, J. L. 1984. Ecological determi- nants of genetic structure in plant populations. Ann. Rev.
Ecol. Syst. 15, 65-95.
19. Lubberstedt, T., Melchinger, A. E., Duble, C., Vuylsteke, M.
and Kuiper, M. 2000. Relationships among early Europe maize inbreds: IV. Genetic diversity revealed with AFLP
markers and comparison with RFLP, RAPD, and pedigree data. Crop Sci. 40, 783-791.
20. McDermott, J. M. and McDonald, B. A. 1993. Gene flow in plant pathosystems. Ann. Rev. Phytopathy 31, 353-373.
21. Nei, M. 1973. Analysis of gene diversity in subdivided populations. Proc. Natl. Acad. Sci. USA 73, 3321-3323.
22. Nei, M. 1977. F-statistics and analysis of gene diversity in subdivided populations. Ann. Human Genet. 41, 225-233.
23. Nei, M. and Li, W. H. 1979. Mathematical model for study- ing genetical variation in terms of restriction endonucleases.
Proc. Natl. Acad. Sci. USA 74, 5267-5273.
24. Paul, S. P., Wachira, F. N., Powell, W. and Waugh, R. 1997.
Diversity and genetic differentiation among populations of Indian and Kenyan tea (Camellia sinensis (L.) O. Kuntze) re- vealed by AFLP markers. Theor. Appl. Genet. 94, 255-263.
25. Shete, S., Tiwari, H. and Elston, R. C. 2000. On estimating the heterozygosity and polymorphism information content value. Theor. Pop. Biol. 57, 265-271.
26. Slatkin, M. 1985. Rare alleles as indicators of gene flow.
Evolution 39, 53-65.
27. Stewart, A. 2005. The potential for domestication and seed propagation of native New Zealand grasses for turf, pp.
277-284. In: Royal New Zealand Institute of Horticulture Conference 2003: Greening the City-Bringing Biodiversity Back into the Urban Environment. October 21-24., Christchurch, New Zealand.
28. Tamura, K., Peterson, D., Peterson, N., Stecher, G., Nei, M.
and Kumar, S. 2011. MEGA5: Molecular evolutionary genet- ics analysis using maximum likelihood, evolutionary dis- tance, and maximum parsimony methods. Mol. Biol. Evol.
28, 2731-2739.
29. Vijayan, K. 2005. Inter simple sequence repeat (ISSR) Ppolymorphism and its application in mulberry genome analysis. Int. J. Indust. Entomol. 10, 79-86.
30. Weng, J. H., Fan, M. J., Lin, C. Y., Liu, Y. H. and Huang, S. Y. 2007. Genetic variation of Zoysia as revealed by ran- dom amplified polymorphic DNA (RAPD) and isozyme pattern. Plant. Prod. Sci. 10, 80-85.
31. Xie, Y., Liu, L., Fu, J. and Li, H. 2012. Genetic diversity in Chinese natural zoysiagrass based on inter-simple sequence repeat (ISSR) analysis. Afr. J. Biotechol. 11, 7659-7669.
32. Yaneshita, M., Kaneko, S. and Sasakuma, T. 1999. Allotetra- ploidy of Zoysia species with 2n=40 based on a RFLP genetic map. Theor. Appl. Genet. 98, 751-756.
33. Yeh, F. C., Yang, R. C. and Boyle, T. 1999. POPGENE Version 1.31, Microsoft Windows-based Freeware for Popu- lation Genetic Analysis. University of Alberta, Alberta.
34. Zietkiewicz, E., Rafalski, A. and Labuda, D. 1994. Genome fingerprinting by simple sequence repeat (SSR)-anchored polymerase chain reaction amplification. Genomics 20, 176- 183.
초록:ISSR에 의한 잔디속 식물의 DNA 다형성과 유전적 관계 평가
허만규*
(동의대학교 자연생활과학대학 분자생물학과)
한국에서 채집한 잔디속(genus Zoysia) 식물 종의 유전적 변이를 단순 서열 반복(Inter-Simple Sequence Repeat Markers, ISSR) 마커 시스템으로 조사하였다. 8개의 ISSR 시발체를 이용한 중합효소 사슬 증폭반응에서 86개의 분절의 증폭물을 얻었으며 이 중 76(87.1%)개 분절이 다형성을 나타내었다. ISSR 마커 시스템에서 다형성 정보 지수(PIC)는 0.848이었다. 다형성 대립유전자좌위의 퍼센트(Pp)는 41.2%에서 44.7%까지 나타내었다. 네이(Nei)의 유전자 다양성(H)은 0.149에서 0.186까지 이며 평균은 0.170이었다. 샤논(Shannon)의 정보 지수(I)의 평균값은
0.250이었다. 대립유전자좌위에 근거하여 전체 변이에서 종 간 차이를 나타내는 변이의 몫(GST)은 0.601였다. 이는
전체변이의 약 60.1%는 종 간에 있음을 의미한다. 따라서 변이의 약 39.9%는 종 내에 있었다. GST에 근거한 유전자
흐름(이동)은 잔디속 간에는 대단히 낮았다(Nm = 0.332). 계통도는 3개의 뚜렷한 분지군으로 분리되었다. 왕잔디
(Zoysia macrostachya)와 금잔디(Z. tenuifolia) 분지군, 갯잔디(Z. sinica) 단독 분지군, 잔디(Z .japonica) 단독 분지 군이었다. 결론적으로 잔디속 식물에 대한 ISSR 분석은 유전적 변이를 탐지하는데 유용하며, 종을 구분하는 유전 자형의 대한 식별력을 주었다.