J Nucl Med Technol Vol. 16, No. 1, April 2012
34
∙ Received: March 6, 2012. Accepted: April 6, 2012.
∙ Corresponding author: Il Sang Moon
Department of Nuclear Medicine, Seoul National University Hospital, 28 Yongon_Dong, Jongno-Gu, Seoul 110-744, Korea
Tel: +82-2-2072-2532, Fax: +82-2-766-9083 E-mail: [email protected]
Original Article
TOF 기법을 이용한 PET/CT 검사에서 적정 스캔 시간에 대한 정량적 평가서울대학교병원 핵의학과
문일상·이홍재·김진의·김현주
Quantitative Evaluation on Optimal Scan Time of PET/CT Studies Using TOF PET
Il Sang Moon, Hong Jae Lee, Jin Eui Kim and Hyun Joo Kim
Department of Nuclear Medicine, Seoul National University Hospital, Seoul, Korea
Purpose: To verify the optimal scan time per bed for clinical application, we evaluated the quality of
18F-FDG images with varying scan times in a phantom and 20 patients with 38 lesions using a Philips (TOF) PET/CT scanner. Materials and Methods: The PET/CT images of a NEMA IEC body phantom and 20 patients (16 males, 4 females) were acquired for 5 different scan times of 20-100 sec per bed with intervals of 20 sec. The activity ratio of hot spheres (diameter of 17 [H1], 22 [H2] and 28 [H3] mm) to the background region in the IEC body phantom was 8-to-1. The contrast recovery coefficient (CRC) and standard uptake value (SUV) based on ROIs of hot spheres and background region were calculated. The noise in each background region was estimated as the ratio of SD of counts to the mean counts in the background region. On the patient image, the injected dose of
18
F-FDG was 444±74 MBq and the SUVs in the 38 hot lesions were measured. Results: The two scan time groups (LT-60 [<60 sec] and GT-60 [≥60 sec]) were compared. In the phantom study, the coefficient of deviations (CVs, %) of CRC and SUV in LT-60 (H1: 14.2 and 7.3, H2: 11.4 and 7.8, H3: 4.9 and 3.2) were higher than GT-60 (H1: 8.9 and 2.8, H1: 8.2 and 5.0, H3: 2.0 and 1.6). In the patient study, the mean CV of CRC and SUV in LT-60 (4.0) was higher than GT-60 (1.2). Conclusion: This study showed that noise increased as the scan time decreased. High noise for the scan time <60 sec per bed yielded high variation of SUV and CRC. Therefore, considering PET/CT image quality, the scan time per bed in the TOF PET/CT scanner should be at least ≥60 sec. (Korean J Nucl Med Technol 2012;16(1):34-37)
Key Words : SUV, CRC, scan time, LT-60, GT-60
서 론
지난 30년간 PET 시스템의 상당한 발전이 있어왔다. 중요 한 발전은 영상과 정량적 분석의 정확성을 결정하는데 중요 한 검출기, 하드웨어, 영상 처리부분에서 이루어져 왔다. 특 히 새로운 형광체의 개발, 높은 공간 분해능과 민감도를 가 지는 검출기, septa를 가지는 2D 시스템으로부터 3D 시스템
으로의 진화, 그리고 역투과 재구성알고리즘(filtered back- projection algorithms) 으로부터 영상과 정량적 분석의 향상 을 가져온 fully 3D 중첩(Iterative) 기법으로의 전환이 있어 왔다. 이 논문에서 거론되는 time-of-flight (TOF) 역시 더욱 더 향상된 PET 영상에 크게 기여하였다. TOF 기술은 스캐 너가 측정하는 감마선 검출 시간을 이용해 소멸 원점의 위치 를 보다 정확히 파악할 수 있고 동시에 발생하는 두 감마선 의 검출기 도달 시간의 실제 차이를 정확히 측정할 수 있다.
궁극적으로 영상 데이터 잡음이 줄어들고, 노이즈 대비하여 높은 대조도 회복 계수를 보인다고 알려져 있다. 또한 PET/CT 제조사에서는 18F-FDG 전신 스캔 검사 시 bed 당 1분의 스캔 시간을 권고하고 있으므로 phantom 실험과 환자
문일상 외 3인. TOF 기법을 이용한 PET/CT 검사에서 적정 스캔 시간에 대한 정량적 평가
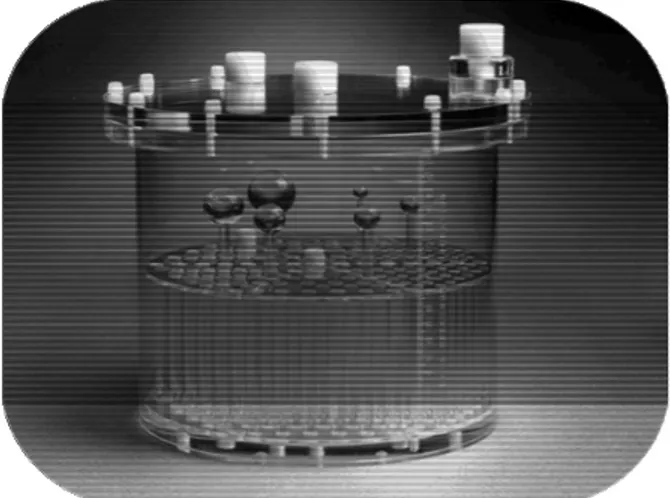
35 Fig. 1. NEMA IEC Body Phantom.
Fig. 2. Draw the ROIs of phantom images.
를 대상으로 다양한 스캔 시간을 적용하며 평가를 하여 최적 의 스캔 시간을 알고자 하였다.
실험 재료 및 방법
1. 실험재료 및 장비
PET/CT 장비는 GEMINI TF 64 (Philips Healthcare, Cleveland, USA)를 이용하였으며 LYSO (Lutetium Yttrium Orthosilicate) 섬광체를 사용하였으며 3D 영상 획득 방법을 이용하였다.
1) Phantom 실험
NEMA IEC body phantom을 사용하였으며 17, 22, 28 mm sphere를 이용하여 열소를 구하였다. 20초 간격으로 20, 40, 60, 80, 100초 총 5회의 서로 다른 bed 당 스캔 시간을 phantom에 적용하여 18F-FDG 영상을 획득하였다. 영상 획 득 시 phantom의 위치 변화에 의한 오차를 제거하기 위하여 plan scan method를 사용하여 연속하여 영상을 얻었다.
Phantom 실험의 경우 관심영역과 background의 방사능비를 8:1로 했다. 관심영역과 background 영역의 표준섭취계수 (SUV)와 대조회복계수(CRC)가 계산되었다(Fig. 2).
2) 환자 실험 방법
2010년 8월부터 12월까지 본원을 방문한 암환자 20명을 대상으로 하였다. 대상 환자의 성별은 남자 12명, 여자 8명이 며 평균 연령은 58세였다. 환자를 대상으로 한 연구에서는 평균 444±74 MBq의 18F-FDG가 환자에게 주사되었고 20명 의 환자, 38개의 병소부위에서 표준섭취계수가 측정되었다.
Phantom 실험과 마찬가지로 영상 획득 시 phantom의 위치 변화에 의한 오차를 제거하기 위하여 plan scan method를 사 용하여 연속하여 영상을 얻었다. Background noise는 back- ground 부분의 표준편차를 평균으로 나누어 계산되었다.
3) 분석
(1) CRC (Contrast recovery coefficient)
Phantom 실험에서 17, 22, 28 mm 열소에서 평균 계수치를 얻었고 배후 방사능도 함께 구하였다. 따라서 CRC를 구하 는 공식은 다음과 같다.
CRC = [(H-B)/B] / (a-1)
H와 B는 열소와 배후방사능의 평균 계수치를 의미하고 a 는 true activity ratio를 의미하는데 본 실험에서는 8이다.
(2) SUV (Standardized uptake value)
Phantom 실험에서는 Fig. 1과 같이 17, 22, 28 mm 열소 각 각에서 SUV를 구하였고 환자 실험에서는 38개의 병소부위 에서 SUV를 구하였다.
(3) CV (Coefficient of variation)
Phantom 실험에서의 CRC와 SUV의 변동률을 의미하며 CV를 구하는 공식은 다음과 같다.
CV(%)= SD (Standard deviation)/MEAN ×100
핵의학기술 제16권 제1호 2012
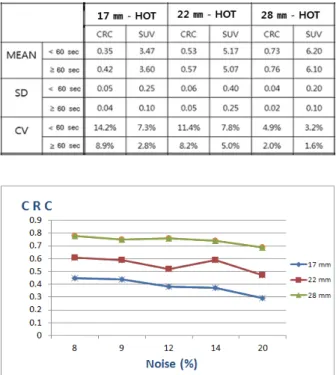
36 Table 1. Comparison between LT-60 and GT-60 with phantom studies
Fig. 3. Relationship between CRC and background noise.
Fig. 4. Relationship between SUV and background noise.
Table 2. Comparison between LT-60 and GT-60 with patient studies
결 과
1. Phantom 실험 결과
Phantom 실험에서 두 그룹 (LT-60 [<60 sec] 과 GT-60 [≥
60 sec])을 비교한 결과 LT-60 그룹의 표준섭취계수(SUV)와 대조회복계수(CRC)가 (H1: 14.2 and 7.3, H2: 11.4 and 7.8, H3: 4.9 and 3.2), GT-60 그룹(H1: 8.9 and 2.8, H2: 8.2 and 5.0, H3: 2.0 and 1.6)에서 보다 높은 변이율을 보였다. 이는 한 bed 당 스캔시간이 60 sec 이상일 때 안정적인 표준섭취계 수와 대조회복계수를 나타내는 것을 의미한다(Table 1). Fig.
3과 Fig. 4는 각각 phantom 실험에서 CRC와 SUV의 변동 추
이를 그래프로 나타낸 것이다.
2. 환자 실험 결과
환자 실험에서 두 그룹 (LT-60 [<60 sec]과 GT-60 [≥60 sec])을 비교한 결과 LT-60 그룹의 표준섭취계수(SUV)가 GT-60 그룹보다 높은 변이율을 보였다. 이는 한 bed 당 스캔 시간이 60 sec 이상일 때 안정적인 표준섭취계수를 나타내는 것을 의미한다. 이 결과는 종양의 크기와는 무관하다는 것을 나타낸다(Table 2.).
고 찰
PET/CT 시스템의 발전에 따라 환자 불편 감소와 같은 시 간에 더 많은 환자를 검사하기 위하여 bed 당 스캔시간이 점 점 줄어드는 경향을 보이고 있다. 최근에는 동시에 발생하는 두 감마선의 검출기 도달시간의 실제 차이를 측정, PET 스 캐너가 측정하는 감마선 검출 시간차를 이용해 소멸 원점의 위치를 보다 정확하게 파악할 수 있는, 즉 스캔시간은 줄이 면서 영상의 질은 향상시킬 수 있는 TOF 기법이 개발되어 PET/CT 시스템이 업그레이드되었다. TOF 기법은 백그라 운드 대비 CRC (Contrast recovery coefficient)를 향상시키 고 민감도를 증가시킨다고 한다. 더욱이 비만환자에 대해서 도 이 같은 이점은 동일하게 적용된다고 한다. 그 이유는 기 존의 방식보다 백그라운드 노이즈와 artifact는 현저히 줄이 고 signal을 향상시켰기 때문이라 한다. 기존의 PET/CT 장비 에서 bed 당 2분의 영상을 획득하였으나 TOF 기술이 적용 된 PET/CT 장비에서는 bed 당 1분의 영상을 획득하여도 영 상의 질이 오히려 향상되는 것을 알 수 있다.
결 론
본 연구에 사용된 GEMINI TF 64 (Philips Healthcare,
문일상 외 3인. TOF 기법을 이용한 PET/CT 검사에서 적정 스캔 시간에 대한 정량적 평가
37
Cleveland, USA)의 경우 최신 기법인 TOF가 이용된 최초의 PET/CT 장비로서 Philips사에서는 bed 당 스캔시간을 1분으 로 권장하고 있다. 본 연구는 bed 당 스캔시간 1분에 대한 영 상의 질(표준섭취계수와 대조회복계수)을 평가하여 스캔시 간의 적정성 여부를 알아보기 위한 연구이며 연구 결과는 bed 당 스캔시간이 60초 미만인 경우 background noise가 심 하고 표준섭취계수와 대조회복계수의 변이율이 높아 임상에 적용하기 부적절하나 60초 이상인 경우, 낮은 background noise와 안정된 표준섭취계수, 대조회복계수를 얻을 수 있으 므로 환자 편의성과 검사 시간 단축을 위한 최소한의 bed 당 스캔시간은 60초가 적절하다는 점을 실험을 통하여 증명하 였다.요 약
18F-FDG 검사 시 한 bed 당 적정 스캔 시간을 정량 평가하 기 위하여 Philips사 TF 64 PET/CT를 사용하였다. Phantom 실험과 환자를 대상으로 다양한 스캔 시간을 적용하며 평가 를 하여 최적의 스캔 시간을 알고자 하였다.
20초 간격으로 총 5회의 서로 다른 bed 당 스캔 시간을 NEMA IEC body phantom과 환자들에게 적용하여 18F-FDG 영상을 획득하였다. Phantom 실험의 경우 관심영역과 back- ground의 방사능비를 8:1로 했다. 관심영역과 background 영 역의 표준섭취계수(SUV)와 대조회복계수(CRC)가 계산되었 다. 환자를 대상으로 한 연구에서는 평균 444±74 MBq의
18F-FDG가 환자에게 주사되었고 20명의 환자, 38개의 병소 부위에서 표준섭취계수가 측정되었다. Background noise는 background 부분의 표준편차를 평균으로 나누어 계산되었 다. Phantom 실험에서 두 그룹 (LT-60 [<60 sec]과 GT-60 [≥
60 sec])을 비교한 결과 LT-60 그룹의 표준섭취계수(SUV)와 대조회복계수(CRC)가 (H1: 14.2 and 7.3, H2: 11.4 and 7.8, H3: 4.9 and 3.2), GT-60 그룹(H1: 8.9 and 2.8, H2: 8.2 and 5.0, H3: 2.0 and 1.6)에서 보다 높은 변이율을 보였다. 이는 한 bed 당 스캔시간이 60 sec 이상일 때 안정적인 표준섭취계 수와 대조회복계수를 나타내는 것을 의미한다. 환자를 대상 으로 한 연구에서 역시 표준섭취계수(SUV)와 대조회복계수 (CRC)가 LT-60 그룹에서 높은 변이율을 보였다. PET/CT 영상에서 background noise는 bed 당 스캔시간이 증가함에 따라 감소하는 것으로 나타났다. 그리고 60 sec 이하 그룹에 서는 높은 background noise로 인하여 높은 SUV와 CRC 변 이율을 보였다. 따라서 PET/CT 영상의 질을 고려할 때 1 bed 당 스캔시간은 최소 60 sec 이상이어야 한다.
REFERENCES
1. Joel S. Karp, Suleman Surti. Benefit of Time-of-Flight in PET:
Experimental and Clinical Results J Nucl Med 2008;49:462-470.
2. Cristina Lois, Bjoern W. Jakoby. An Assessment of the Impact of Incorporating Time-of-Flight (TOF) Information into Clinical PET/CT Imaging J Nucl Med 2010;51(2):237.
3. Wong WH, Mullani NA, Philippe EA, et al. Performance-char- acteristics of the University-of-Texas TOF PET-I PET camera (abstract). J Nucl Med 1984;25.
4. Mazoyer B, Trebossen R, Schoukroun C, et al. Physical charac- teristics of TTV03, a new high spatial-resolution time-of-flight positron tomograph. IEEE Trans Nucl Sci 1990;37:778-782.
5. Moses WW. Time of flight in PET revisited. IEEE Trans Nucl Sci 2003;50:1325-1330.
6. Surti S, Kuhn A, Werner ME, Perkins AE, Kolthammer J, Karp JS. Performance of Philips Gemini TF PET/CT scanner with special consideration for its time-of-flight imaging capabilities. J Nucl Med 2007;48:471-480.