Abstract
BACKGROUND: Emission of nitrous oxide (N2O) from the soil is expected to depend on the types of nitrogen fertilizer used. Biochar has recently been proposed as a potential mitigation of climate change by reducing the N2O emission.
Although laboratory studies reported that biochar applications could reduce N2O emission, the number of field-based studies is still limited. Therefore, a field experiment was conducted to investigate the effect of biochar on N2O emission when different nitrogen fertilizers were applied in corn cultivated field.
METHODS AND RESULTS: The field experiment consisted of six treatments: urea fertilizer without biochar (U), ammonium sulfate fertilizer without biochar (A), oil cake fertilizer without biochar (O), urea fertilizer with biochar (U+B), ammonium sulfate fertilizer with biochar (A+B), and oil cake fertilizer with biochar (O+B). Biochar was applied at a rate of 10 t/ha. Greenhouse gas fluxes were measured during growing seasons using static vented chambers. The cumulative N2O emissions were 0.99 kg/ha in the U, 1.23 kg/ha in the A, 3.25 kg/ha in the O, 1.19 kg/ha in the U+B, 0.86 kg/ha in the A+B, and 1.55 kg/ha in the O+B.
CONCLUSION: It was found that N2O emission was related to application of both nitrogen fertilizer type and biochar. In particular, the N2O reduction effect was the highest in the corn field incorporated with biochar when oil cake was applied to the soil.
Key words: Biochar, N fertilizer type, Nitrous oxide, Greenhous gas
서 론
대기 중 온실가스 농도는 산업혁명 이후 급격히 증가하였 고, 이에 따라 지구의 평균 대기온도는 지속해서 상승하였다 [1]. 대기 온도 상승은 지구환경 변화를 가속화시킴 물론 기상 이변 발생 빈도와 강도가 증가하고 있다. 특히 농업 생산성은 기후변화에 크게 영향을 받으며, 식량 생산에 차질이라도 생 기면 인류의 생존까지 위협할 수 있다. 따라서 지구온난화의 피해를 최소화하기 위하여 전 세계적으로 온실가스를 관리할 수 있는 정책을 추진하고 있다. 유엔 기후변화협약 제3차 당 사국 총회에서 교토의정서를 체결하여 기후변화의 주범인 주 요 온실가스를 정의하고 선진국 중심으로 온실가스 감축 의 무를 부여하였다[2]. 그 후 제 21차 유엔 기후변화협약 당사 국 총회에서 파리협정을 이끌어 모든 당사국에 온실가스 감 축의무를 부여한 신기후체제가 출범하였다[3]. 이에 따라 우 리나라는 2030년의 온실가스 배출량 전망치(BAU, Business as usual) 대비 37%를 감축하는 것을 발표하였고, 농축산 비 에너지 부문은 BAU 대비 7.9%에 해당하는 약 1.6 백만톤
*Corresponding author: Sun-il Lee
Phone: +82-63-238-2495; Fax: +82-63-238-3823;
E-mail: [email protected]
Korean J Environ Agric. 2020;39(4):297-304. Korean Online ISSN: 2233-4173
Published online 2020 October 26. https://doi.org/10.5338/KJEA.2020.39.4.35 Print ISSN: 1225-3537
옥수수 재배지 아산화질소 배출에 대한 질소비료와 바이오차 시용 효과
이선일*, 김건엽, 최은정, 이종식, 권효숙, 신중두
농촌진흥청 국립농업과학원 농업환경부 기후변화생태과
Effect of Biochar Application on Nitrous Oxide Emission in the Soil with Different Types of Nitrogen Fertilizer During Corn (Zea may) Cultivation
Sun-il Lee*, Gun-yeob Kim, Eun-jung Choi, Jong-sik Lee, Hyo-Suk Gwon and Joung-du Shin (Climate Change and Agroecology Division, Department of Agricultural Environment, National Institute of Agricultural Sciences, Rural Development Administration, Wanju 55365, Korea)
Received: 14 September 2020/ Revised: 14 October 2020/ Accepted: 19 October 2020 Copyright ⓒ 2020 The Korean Society of Environmental Agriculture
This is an Open-Access article distributed under the terms of the Creative Commons Attribution Non-Commercial License (http://creativecommons.org/licenses/by-nc/3.0) which permits unrestricted non-commercial use, distribution, and reproduction in any medium, provided the original work is properly cited.
ORCID Sun-il Lee
https://orcid.org/0000-0002-0519-3150
297
Research Article Open Access
CO2eq. (Carbon dioxide equivalent)의 감축 목표가 설정 되어 농업 분야의 온실가스 저감 기술이 필요하다.
아산화질소(N2O)는 질소가 포함된 비료를 투입하였을 때 토양 내 질소순환 과정을 통해 배출된다[4]. N2O는 대기 오 존층을 파괴하는 주요 물질이며, 100년 기준 지구온난화잠재 력(GWP: Global warming potential)이 CO2의 298에 달 한다. 산업화 이전의 대기 평균 N2O 농도는 270 ppb이었지 만, 2017년 기준 330 ppb에 달하며, 지구온난화 기여율은 6% 이상인 것으로 알려져 있다(WMO, 2018). 따라서, 밭 농 경지에서 배출되는 N2O를 효율적으로 저감할 수 있는 저탄 소 농업기술이 필요하다. 다양한 저탄소 농업기술 중 바이오 차 활용 가능성이 크게 주목받고 있다[5]. 바이오차는 바이오 매스를 산소가 없는 환경에서 열분해하여 제조한 탄소 함량 이 높은 고형물이다. 이러한 바이오차를 활용하여, N2O 저감 하는 효과는 크게 세부분으로 분류가 된다. 첫재, 바이오차의 비표면적은 넓어[4, 6], 양분 보유능에 의해 질소 손실이 감소 하여 질소시비량을 감축시킬 수 있어 N2O 배출 저감도 기대 할 수 있다[7]. 둘째, 습윤 토양의 통기성을 개선하여 탈질 과 정에서 배출되는 N2O를 저감할 수 있다고 평가되었다[8]. 셋 째, 토양 pH 증가로 N2O 환원효소가 활성화되어 N2O 배출 이 감소하고[9], 토양 통기성 개선 및 NH4+ 고정 등에 의해 서도 N2O 발생이 감소한다고 알려졌다[10]. 우리나라에서도 농경지에 바이오차를 투입하여 토양탄소량을 증가시키고, N2O 배출량을 12.6∼48.1% 감소하였다는 연구 결과도 발표 되었다[11]. 이와 같은 바이오차 투입에 따른 N2O 감축 효과 는 다수의 실험연구 결과에서 정립되었으나, 감축 효율성은 기후여건과 작물 재배를 위한 시비 관리 등의 영농방식에 따 라서도 달라진다[12-14]. 그리고 농경지 토양에서 배출되는 N2O는 대부분 투입된 질소비료에 의한 것으로 평가하였으며
[15], 질소 비료 종류별 농경지에서 배출되는 N2O의 배출양 상은 다른 것으로 평가되고 있다[16]. 따라서 농경지에서 배 출되는 N2O를 줄이기 위해 질소비료 종류별 바이오차 투입 에 따른 효과를 평가하는 연구가 필요하기에 본 연구에서는 옥수수 재배지에서 질소 비료를 종류별(요소, 유안 및 유박) 로 구분하고 바이오차를 투입하였을 때 N2O 발생량을 비교 검토하였다.
재료 및 방법 공시 토양 및 바이오차의 특성
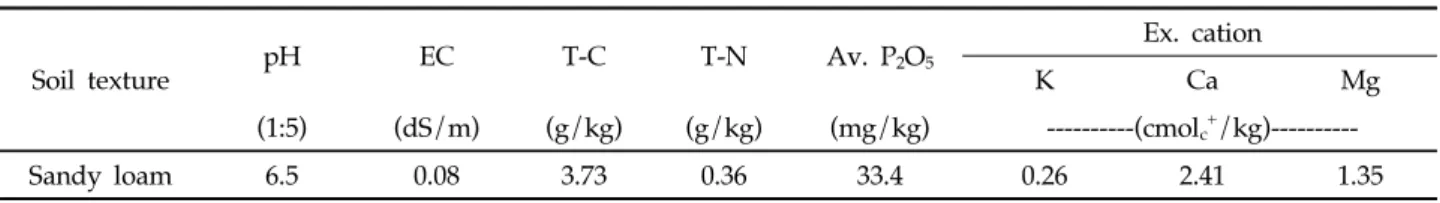
본 연구는 전라북도 완주군 이서면에 위치한 국립농업과학 원 시험포장(위도: 35°82´N, 경도: 127°04´E)에서 포장시험을 수행하였다. 밭 포장의 토성은 사양토이며, 토양의 화학적 특성 은 토양산도(Soil acidity) 6.5, 총 탄소(Total Carbon) 3.73 g/kg, 총 질소(Total Nitrogen) 0.36 g/kg 이였으며, 구체적 인 토양 이화학성은 Table 1과 같다.
본 연구에 사용한 바이오차는 전년도에 발생한 왕겨를 전 처리 과정을 거친 후 전북 고창의 왕겨숯 제조공장 탄화로를 이용하여 TLUD (Top Lit Up Draft) 열분해 방식으로 약 500℃에서 제조하였다. 구체적인 열분해 과정은 탄화로 상단 전기저항체를 통해 점화를 하고, 하단 바이오매스 사이 미세한 공극을 통해 공기가 유입 되도록하여 상층부터 탄화가 될수있 도록 고안된 장치를 통해 생산하여 본 연구에 사용하였다. 바 이오차의 화학적 특성은 Table 2와 같으며, pH는 10.8, T-C 함량은 566.9 g/kg이며, H:C ratio는 0.37이었다. 바이오차 의 안정성을 타나내는 공업분석 결과는 Table 3과 같으며, 고 정탄소 함량 대비 휘발분의 비율이 0.16임으로 안정적인 결합 형태를 나타낼 것으로 예상된다.
Soil texture pH EC T-C T-N Av. P2O5
Ex. cation
K Ca Mg
(1:5) (dS/m) (g/kg) (g/kg) (mg/kg) ---(cmolc+/kg)---
Sandy loam 6.5 0.08 3.73 0.36 33.4 0.26 2.41 1.35
Table 1. Physicochemical properties of the soil used
pH T-C T-N T-H
H:C ratio Surface area
(1:10) (g/kg) (g/kg) (g/kg) (m2/g)
10.8 566.9 5.7 17.6 0.37 159.6
Table 2. Physicochemical properties of biochar
Water content (%) Mobile matter (%) Ash (%) Resident matter (%)
5.2 11.1 13.4 70.3
Table 3. Percentage water content, mobile matter, ash and resident matter contents of the used biochar
시험구처리
시험구는 완전임의배치로 3반복을 배치하였다. 처리는 요소 (U, urea), 유안(A, ammonium sulfate) 그리고 유박(O, oil cake) 처리구로 나누고 ha 당 10t의 바이오차(B, Biochar)를 투입하는 처리구와 투입하지 않은 처리구로 구분하였다. 결과 적으로 바이오차를 투입하지 않은 U, A, O 처리구와 바이오차 를 투입한 U+B, A+B, O+B 처리구를 설정하였다. 모든 처리 구에 옥수수 표준시비량인 N-P2O5-K2O(17.2-13-13 kg/10a) 와 돈분 퇴비(440 kg/10a)을 토양에 투입하였다. 각 질소비 료의 질소함량인 요소(N 46.67%), 유안(N 21.2%), 유박(N 3.63%)을 고려하여 투입량을 선정하였고, 인산은 용성인비, 칼리는 염화가리 형태로 옥수수 정식 전에 투입하였다. 재배 작물로써 옥수수는 5월 중순 재식거리 70 × 35 cm으로 정식 하였으며, 8월 초순 수확하였다. 옥수수의 종실중은 건조, 탈 립 조제 후 수분 15.5%를 기준으로 측정하였다.
토양 및 바이오차 분석
토성은 비중계법으로 분석하였으며, 토성은 미국농무성법 분류기준을 따랐다[17]. 토양분석은 토양 화학분석법에 준하여 pH, EC, TC, TN, Av. P2O5및 Ex. Cations를 분석하였다 [18]. pH는 토양을 증류수와 1:5 (W/V)로 혼합한 후 30분간 교반하여 pH meter (Orion 4 star, Thermo, Singapore)로 측정하였고, EC는 pH 측정 후 토양용액을 #42 여과지로 여과 후 EC meter (Orion 4 star, Thermo, Singapore)를 이용하 여 측정하였다. TC, TN은 CN analyzer (Vario Max CN, Elementar, Germany), Av. P2O5은 Lancaster법으로 720 nm 파장에서 비색계(AU/CARY 300, Varian, Australia) 로 분석하였다. Ex. Cations은 1 M NH4OAc (pH 7.0) 침 출하여 유도결합플라즈마 분광계(ICP-OES, GBC scientific, USA)로 분석하였다. 토양시료의 무기태질소 함량은 습토 10 g을 2M KCl로 침출한 다음 질소자동분석기(Auto analyzer 3, BRAN+LUBBE, Germany)로 측정하였다. 바이오차의 pH는 토양분석 시 사용한 장비를 통하여 바이오차와 증류수를 1:10 (W/V)로 혼합하여 교반 후 측정하였고, T-C, T-N, 총 수소(T-H; Total hydrogen)는 Elemental Analyzer (Vario MACRO cube, Elementar, Germany)로 분석하였고, 비표면 적은 Surface area analyzer (BELSORP-max, BEL, Japan) 로 분석하였다. 바이오차의 공업분석(proximate analysis)은 [19]에 준하여 휘발분(mobile matter), 회분(ash), 고정탄소 함량을 (resident matter)산출하였다.
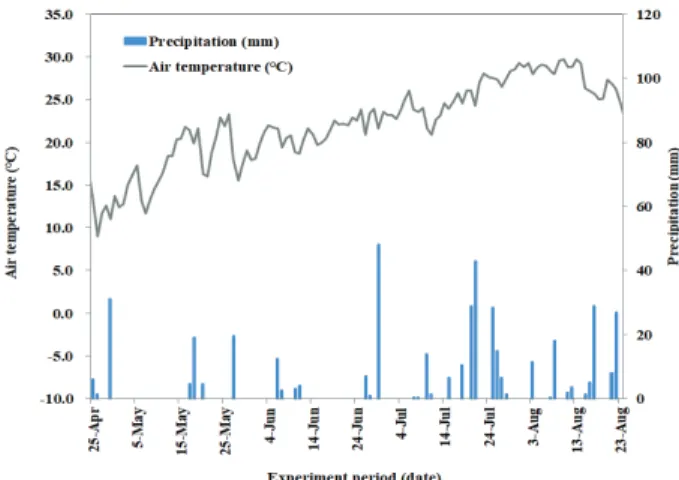
시험기간 중 토양의 수분함량 측정을 위해 센서(SM100, Spectrum, British)를 토양 내 10 cm 깊이에 수평으로 꽂아 실시간으로 측정하였으며, 각각 측정치는 데이터로거에 30분 단위로 기록 되도록 하였다. 강수량 및 대기평균 온도는 시험포 장 인근에 위치한 기상관측망(위도: 35°82´N, 경도: 127°04´E) 에서 측정하여 제공하는 농촌진흥청 농업기상정보서비스 (weather.rda.go.kr)의 일별 기상자료를 활용하였다. 2019년 4월 하순부터 8월 하순까지 대기 평균온도와 총 강우량은 각 각 22.1℃, 427 mm 이였다(Fig. 1).
Fig. 1. Daily precipitation (mm) and daily average air temperature (℃) throughout the experimental period.
가스 flux 측정 및 분석
N2O 배출량을 조사하기 위해 국제적으로 공인된 밀폐형 태 챔버인 Non-steady-state를 사용하였다[20]. 설치된 챔버 는 외부로의 공기 유출이 없도록 하였으며, 지름이 24 cm, 높이가 37 cm인 PVC 소재로 각 시험구의 대표 지점에 토양 에 9 cm 깊이로 녹비 작물의 뿌리 활착의 저해를 최소화 하 도록 설치하였다. 가스시료 채취는 [21]의 방법에 준하여 토 양에서 배출되는 온실가스의 24시간 중 평 균배출 시간대인 10:00∼13:00시 사이에 60 ml 주사기로 주 1회 채취하였다.
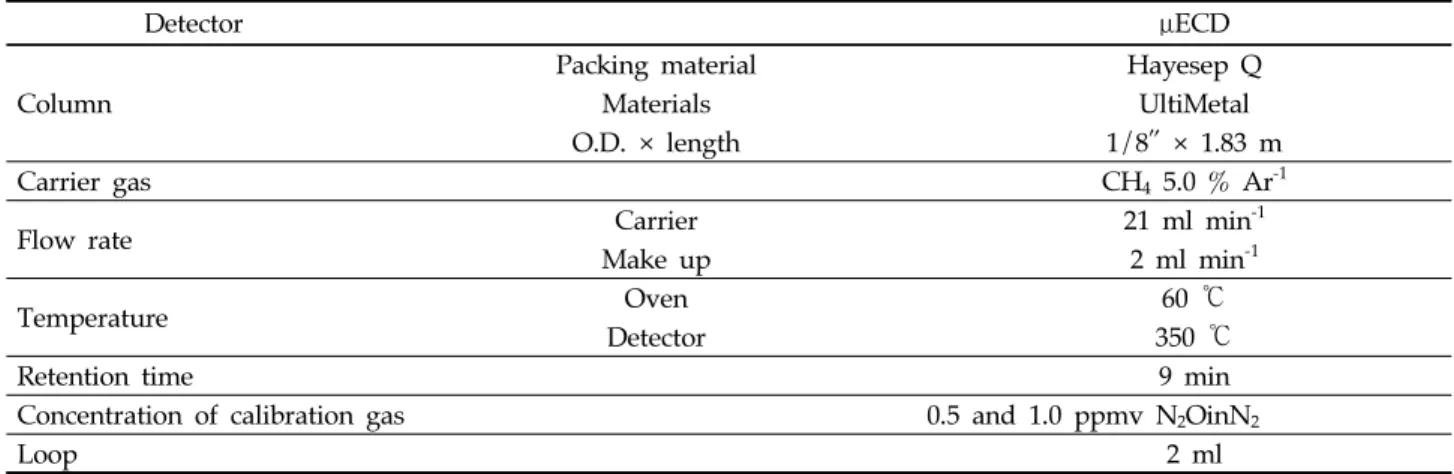
기체시료의 N2O 농도는 전자포획검출기(ECD detector)로 분석하였으며 칼럼은 Hayesep Q (80/100 mesh)를 충전한 1/8″×1.83 m의 ultiMetal tubing column, 그리고 검출기 의 온도는 350℃로 한 가스크로마토그래피(7890A, Agilent, USA)로 측정하였고 세부조건은 Table 4와 같다. N2O efflux 의 계산은 아래의 (식 1)을 이용하였다
N2O efflux (mg/m2/day) = ×
× ∆ × ∆ (1)
여기서, 는 기체밀도(1.967 mg/cm3), V는 챔버 부피 (m3), A는 챔버 표면적(m2), ∆∆는 챔버 내 단위시간당 CO2
증가농도(mg/m3/day), T는 항온온도를 의미한다. 그리고 누적 발생량은 Σ(R× D)을 이용하여 항온기간동안 총 N2O efflux를 계산하였다. 이때 R은 N2O 발생량(mg/m2/day)이 며, D는 시료채취 공백 기간을 나타낸다.
통계분석
질소질 비료 종류와 바이오차 투입에 따른 토양 N2O 배 출량, 토양수분함량, 무기태질소 함량 및 토양화학성 변화와 상호작용에 미치는 영향을 SAS 통계프로그램(버전 9.2)을 이 용하여 통계처리 하였다. 처리간의 차이를 비교하기 위하여 조사된 자료는 일반선형모형을 이용한 ANOVA 검증을 통하 여 분석하였다.
Detector μECD Column
Packing material Hayesep Q
Materials UltiMetal
O.D. × length 1/8″ × 1.83 m
Carrier gas CH4 5.0 % Ar-1
Flow rate Carrier 21 ml min-1
Make up 2 ml min-1
Temperature Oven 60 ℃
Detector 350 ℃
Retention time 9 min
Concentration of calibration gas 0.5 and 1.0 ppmv N2OinN2
Loop 2 ml
Table 4. Analytical conditions of gas chromatographic measurement for N2O
결과 및 고찰 토양의 이화학성 변화
옥수수 재배기간동안 질소비료와 바이오차 투입에 따른 토 양의 수분함량과 무기태질소 함량의 평균값은 Table 5와 같다.
토양 수분함량은 질소질 비료 종류에 따른 차이는 나타나지 않 았고, 바이오차를 투입함으로써 고도로 유의한 차이(p<0.001) 를 나타내며 증가하였다. 즉 바이오차는 넓은 비표면적을 갖기 때문에 [4, 6], 바이오차를 투입함으로써 수분 보유능이 증가한 것으로 판단된다. 무기태 질소함량으로 암모늄태 질소(NH4-N) 는 질소질 비료 종류와 바이오차 투입 유무에 따라 고도로 유 의한 차이(p<0.001)를 나타냈다. O 처리구에서 U, A 처리구 보다 높았고, 바이오차를 투입함으로써 고도로 유의(p<0.001) 하게 전체적으로 감소하였다. 즉 바이오차는 비표면적이 넓고 표면 작용기 함량이 높아서 바이오차가 투입된 토양의 치환 성 양이온교환용량이 높아지는데, 양이온교환용량이 증가되 면 용출되는 양분을 줄일 수 있어 그 결과 NH4-N함량이 감 소하였을 것으로 평가된다[22]. 질산태 질소(NO3-N)는 질소 질 비료 종류에 따라 유의한 차이를 (p<0.01)를 나타냈고, 바 이오차 투입 유무에 따라 고도로 유의한 차이(p<0.001)를 나 타냈다. NO3-N 함량은 NH4-N 함량과 반대로 유기질 질소비 료를 투입한 O 처리구에서 무기질 질소비료를 투입한 U, A 처리구보다 낮게 나타났다. 그리고 바이오차를 투입함에 따라 고도로 유의한 차이(p<0.001)를 나타내며 감소하였다. [23]연 구에서는 실내 항온배양 조건에서 토성인 양토인 토양에 바이 오차를 투입하고 NO3-N 함량을 평가한 결과, 바이오차를 투 입함에 따라 질산화과정이 촉진되어 NO3-N 함량이 증가하는 경향을 나타냈지만, 본 연구는 실외 작물 재배 조건이고 토성 이 상이하여 같은 경향을 나타내지 않았다. 따라서, 토성 등 실 험조건에 따른 바이오차 투입에 의한 질소순환과정을 분류하여 평가하는 연구가 향후 필요할 것으로 예상된다.
토양탄소와 질소에 대한 바이오차의 영향
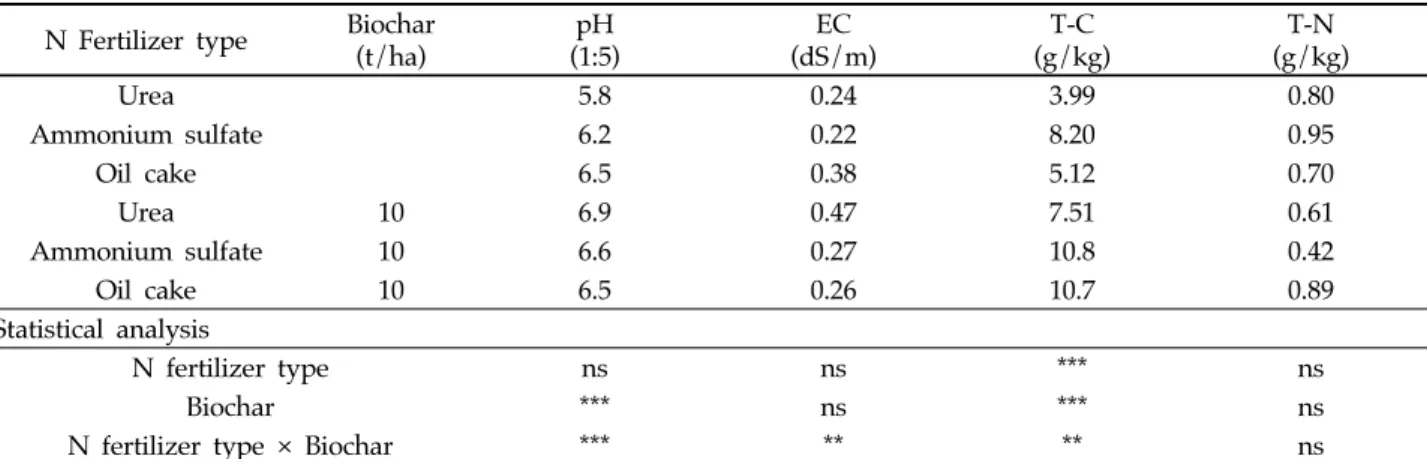
옥수수 수확 직후 토양의 pH, EC, T-C, T-N 함량은
Table 6과 같다. 토양 pH는 질소질 비료 종류에 따른 차이 는 나타나지 않았고, 바이오차를 투입함으로써 고도로 유의한 차이(p<0.001)를 나타내며 증가하였다. 이는 바이오차 제조 과정 중 열분해 온도가 증가하면서 회분이 생성되고, 유기물 에서 알카리염이 분리되어 배출됨으로 pH는 높아지기 때문 이다[24]. 따라서 이러한 바이오차를 토양에 투임함으로써 pH를 높이는 효과를 나타냈다. 토양 EC와 T-N은 질소질 비 료 종류와 바이오차 투입 유무에 따라 유의한 차이는 나타나 지 않았다. 토양 T-C는 U, A 그리고 O 처리구에서 각각 3.99, 8.20, 5.12 g/kg 이였고, T-C는 U+B, A+B 그리고 O+B 처리구에서 각각 7.51, 10.8, 10.7 g/kg 이였다. ha 당 10 t의 바이오차를 투입함에 따라 토양 탄소함량은 2.60 ~ 5.58 g/kg 범위로 증가하였고, 바이오차를 투입함으로써 고 도로 유의한 차이(p<0.001)를 나타내며 증가하였다. 즉 바이 오차는 생물학적 분해의 영향을 받지 않는 난분해성 물질이 기 때문에[25-27], 바이오차를 투입함으로써 탄소함량은 증가 한 결과를 얻었다. 또한, 바이오차의 H:C 비율은 분자의 방 향적 사슬구조를 파악할 수 있는 척도로 사용할 수 있으며, 국제 바이오차협회(IBI; International Biochar Initiative)에 서는 H:C 비율이 0.7 이하일 경우에만 100년 이상 분해되지 않고 저장할 수 있다고 하였다. 따라서, 본 연구에 사용한 바 이오차의 H:C 비율은 0.37 임으로(Table 2) 매우 안정적인 바이오차내의 탄소는 분해되지 않고 저장할 수 있음을 확인 할 수 있었다. 또한 바이오차의 고정탄소는 미생물의 분해에 대해 안정한 부분으로 토양에서 분해되지 않고 장기간 잔류 할 수 있다고 평가된다[19]. 본 연구에 사용한 바이오차의 고 정탄소함량(Resident matter)은 70.3% 임으로 (Table 3) 토양 내 탄소 저장효과가 높아 바이오차를 투입함으로써 탄 소함량을 증가시킬 수 있었다. 이러한 농경지 바이오차 투입 에 의한 토양 탄소저장효과는 기후변화에 관한 정부간 패널 (IPCC; Intergovernmental Panel on Climate Change) 지침에서도 바이오차의 탄소 저장효과가 인정되고 있다. 따라 서 향후 온실가스 감축사업과 연계할 수 있도록 하는 준비가 필요할 것이다.
N Fertilizer type Biochar (t/ha)
Mositure (%, V/V)
NH4-N (mg/kg)
NO3-N (mg/kg)
Urea 24.1 1.11 5.64
Ammonium sulfate 28.8 1.41 5.90
Oil cake 25.8 1.66 4.66
Urea 10 32.4 0.72 3.27
Ammonium sulfate 10 32.9 0.22 2.64
Oil cake 10 35.5 1.32 3.34
Statistical analysis
N fertilizer type ns *** **
Biochar *** *** ***
N fertilizer type × Biochar ns ** ***
Values are mean of triplicate observations.
NS, not significant F-values for p < 0.05, and *, **, and *** indicate significant difference at p < 0.05, p < 0.01, and p
< 0.001, respectively.
Table 5. Soil moisture, ammonium ion (NH4-N) and nitrate ion (NO3-N) affected by different treatment during the experiment period
N Fertilizer type Biochar (t/ha)
pH (1:5)
EC (dS/m)
T-C (g/kg)
T-N (g/kg)
Urea 5.8 0.24 3.99 0.80
Ammonium sulfate 6.2 0.22 8.20 0.95
Oil cake 6.5 0.38 5.12 0.70
Urea 10 6.9 0.47 7.51 0.61
Ammonium sulfate 10 6.6 0.27 10.8 0.42
Oil cake 10 6.5 0.26 10.7 0.89
Statistical analysis
N fertilizer type ns ns *** ns
Biochar *** ns *** ns
N fertilizer type × Biochar *** ** ** ns
Values are mean of triplicate observations.
NS, not significant F-values for p < 0.05, and *, **, and *** indicate significant difference at p < 0.05, p < 0.01, and p
< 0.001, respectively.
Table 6. Soil pH, electric conductivity (EC), total carbon (TC) and total nitogen (TN) affected by different treatment over the entire experimental period
N2O 배출
옥수수 재배기간동안 질소비료와 바이오차 투입에 따른 시기별 N2O 배출량은 Fig. 2와 같다. N2O 배출량은 각 처리 구에 해당되는 비료와 바이오차를 투입하고 옥수수를 정식한 이후 서서히 증가하였고 정식 후 2주째 U, A, O, U+B, A+B, 그리고 O+B 처리구에서 각각 5.3, 6.8, 10.7, 20.6, 5.3, 4.3, 7.1 그리고 6.6 mg/m2·day로 가장 높은 배출량을 나타냈다.
그 후 전체적으로 N2O 배출량은 점차 줄어들었으며, 옥수수 정식 4주 이후부터는 모든 처리구에서 2.0 mg/m2·day 이하 로 기저 배출형태가 나타냈다(Fig. 2). 즉 농경지에 질소질 비 료원을 투입한 이후 최대 N2O 배출량을 나타냈으며, 다양한 질소원을 농경지에 투입 후 N2O 배출량을 측정한 연구에서도 완효성 질소비료를 제외하고 질소비료 공급 2주 이내 최대 배 출량을 나타내며 그 이후 줄어드는 경향을 나타냈다[16].
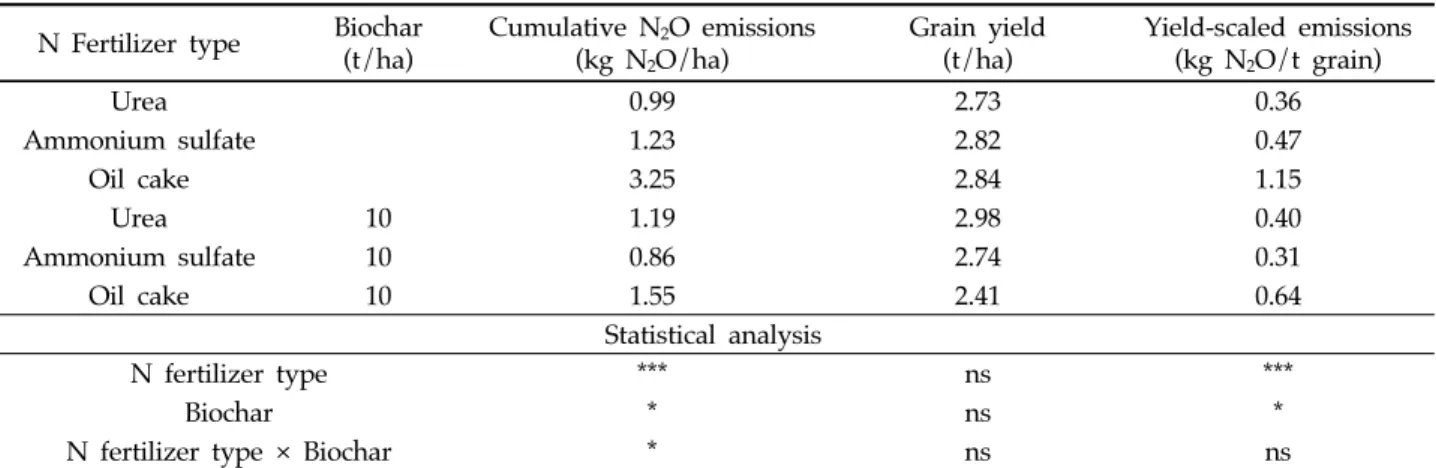
옥수수 재배기간 동안 누적 N2O 배출량은 바이오차를 투
Fig. 2. Daily N2O efflux by different treatment (U: urea, A: ammonium sulfate, O: oil cake, U+B: urea+biochar, A+B: ammonium sulfate+biochar, O+B: oil cake+biochar) during the maize cultivation.
Values are the means of triplicate and vertical bars are standard errors of the means (n=3). Error bars are often too small to be depicted.
N Fertilizer type Biochar (t/ha)
Cumulative N2O emissions (kg N2O/ha)
Grain yield (t/ha)
Yield-scaled emissions (kg N2O/t grain)
Urea 0.99 2.73 0.36
Ammonium sulfate 1.23 2.82 0.47
Oil cake 3.25 2.84 1.15
Urea 10 1.19 2.98 0.40
Ammonium sulfate 10 0.86 2.74 0.31
Oil cake 10 1.55 2.41 0.64
Statistical analysis
N fertilizer type *** ns ***
Biochar * ns *
N fertilizer type × Biochar * ns ns
Values are mean of triplicate observations.
NS, not significant F-values for p < 0.05, and *, **, and *** indicate significant difference at p < 0.05, p < 0.01, and p
< 0.001, respectively.
Table 7. Effects of nitrogen fertilizer type and biochar application on cumulative N2O emission, grain yield and yield-scaled emission during maize cropping
입하지 않은 U, A 그리고 O 처리구에서 각각 0.99, 1.23 그 리고 3.25 kg/ha 이였고, 바이오차 10 t/ha 투입한 U+B, A+B 그리고 O+B 처리구에서 각각 1.19, 0.86 그리고 1.55 kg/ha 이였다(Table 7). 유기질 질소비료원를 투입한 O 처 리구에서 무기질 질소 비료원을 투입한 U, A 처리구에 비해 2배 이상 N2O가 배출되었는데, 이러한 결과는 상이한 무기 질, 유기질 질소 비료원을 투입하고 옥수수 재배기간동안 N2O 배출량을 비교평가 하였던 선행연구 결과에서 요소, 질 산암모늄, UAN (urea-ammonium nitrate) 폴리머코팅 요 소, 완효성 질소 비료 등 무기질 질소비료를 투입하였을 때 1.70 ~ 3.30 kg/ha 배출되었지만, 동일한 질소량을 유기질 인 가축분 퇴비를 투입하였을 때, 8.90 ~ 10.85 kg/ha 배출 되었다[16]. 즉 유기질 질소원 공급에 따라 미생물 활성이 증 진되어 이에따라 N2O 배출량은 무기질 질소원 공급에 비해 크게 증가하였다[28, 29]. 바이오차를 토양에 투입하면 토양 내 무기태 질소 흡착[8], 질소 부동화[30], 완전탈질[31] 등 다양한 기작의 복합적인 작용으로 N2O 배출이 저감된다고 평가되고 있다. 본 연구결과에서는 바이오차 투입에 따른 NH4-N 함량은 0.34 ~ 1.19 mg/kg 줄어들었는데(Table 5), 바이오차에 의한 NH4-N의 흡착에 의해 나타나는 것으로 평 가된다[8]. 따라서 질소순환과정에서 배출되는 N2O도 바이오 차를 투입함에 따라 통계적으로 유의하게(p<0.05) 배출량 저 감되는 경향을 나타냈다. 특히 상대적으로 N2O 배출량이 많 았던 O 처리구에서 52.4% 저감되는 등 효과가 컸으며, 반대 로 U 처리구에서는 바이오차 투입에 따른 N2O 저감효과가 나타나지 않았는데, 이는 A, O 처리구보다 N2O 배출량이 낮 아 저감기술 적용에 따른 효과가 발생하지 않았다. 본 연구는 국내에서 많이 이용하는 질소원을 선택하여 각 질소원별 바 이오차 투입에 따른 N2O 배출량 변화에 대해 중점을 두고 분석하였고, 작물 재배지에서 평가함으로 배출량에 영향을 미 치는 간섭요인을 제한하고 실험하지 않아 비료 종류와 바이 오차 투입 유무에 따른 기작을 분석하고 해석하는데에 한계
가 있었다. 따라서 향후 질소원별 바이오차 투입에 의해 N2O 배출과 그에 영향을 미치는 요소에 대해 질소 동위원소비 분 석 기법 등을 활용하여 질소순환 과정을 추적하여 해석하는 연구가 필요할 것이다.
작물 수확량 대비 N2O 배출량 지표는 농업에서 배출되는 온실가스와 식량안보에 대한 평가를 동시에 할 수 있으며, 저 탄소 농업기술의 효율성을 평가할 수 있는 지표로 활용할 수 있다[32]. 본 연구에서 옥수수 재배기간 동안 작물 수확량 대 비 N2O 배출량은 바이오차를 투입하지 않은 U, A 그리고 O 처리구에서 각각 0.36, 0.47 그리고 1.15 kg/t 이였고, 바이 오차 10 t/ha 투입한 U+B, A+B 그리고 O+B 처리구에서 각각 0.40, 0.31 그리고 0.64 kg/t 이였다(Table 7). A+B 처 리구에서 가장 낮은 0.31 kg/t을 나타내어, 작물 수확량 대 비 N2O 배출량의 효율이 가장 우수한 것으로 평가되었고, O+B 처리구에서 바이오차 투입에 따른 수확량 대비 N2O 배 출 저감량이 0.51 kg/t 으로 가장 높게 나타났다. 따라서 농 경지 토양에서 온실가스 배출 저감을 위한 바이오차 적용은 공급된 질소비료 종류에 따라 구분하여야 할 필요가 있다. 그 리고 이러한 감축기술에 대한 온실가스 저감효과를 평가하는 연구와 향후 온실가스 감축사업과 연계할 수 있도록 검인증 방법을 포함한 방법론 구축 등이 필요하다. 이후 농업분야 온 실가스 감축사업인 배출권거래제 외부사업, 농업농촌 자발적 온실가스 감축사업, 저탄소농축산물 인증제 등과 연계하여 농 업현장에서 활용할 수 있도록 해야 할 것으로 판단되었다
Note
The authors declare no conflict of interest.
Acknowledgement
This work was carried out by the support of
Cooperative Research Program for Agriculture Science
& Technology Development (PJ013814022020), Rural Development Administration, Republic of Korea.
References
1. Zhang Q, Chang J, Wang T, Xu Y (2007) Review of biomass pyrolysis oil properties and upgrading research.
Energy Conversion and Management, 48(1), 87-92.
https://doi.org/10.1016/j.enconman.2006.05.010.
2. Breidenich C, Magraw D, Rowley A, Rubin JW (1998) The Kyoto protocol to the United Nations framework convention on climate change. The American Journal of International Law, 92(2), 315-331.
https://doi.org/10.2307/2998044.
3. Falkner R (2016) The Paris Agreement and the new logic of international climate politics. International Affairs, 92(5), 1107-1125.
https://doi.org/10.1111/1468-2346.12708.
4. Singh BP, Hatton BJ, Singh B, Cowie AL, Kathuria A (2010) Influence of biochars on nitrous oxide emission and nitrogen leaching from two contrasting soils.
Journal of Environmental Quality, 39(4), 1224-1235.
https://doi.org/10.2134/jeq2009.0138.
5. Roberts KG, Gloy BA, Joseph S, Scott NR, Lehmann J.
(2010) Life cycle assessment of biochar systems: Estimating the energetic, economic, and climate change potential.
Environmental Science & Technology, 44, 827-833.
https://doi.org/10.1021/es902266r.
6. Spokas KA (2010) Review of the stability of biochar in soils: predictability of O: C molar ratios. Carbon Management, 1(2), 289-303.
https://doi.org/10.4155/cmt.10.32.
7. Lehmann J, Joseph S (2009) Biochar for environmental management, in: Lehmann J, Joseph S (eds), Science and technology. pp. 1-12, Earthscan, London, UK.
ISBN: 978-1-84407-658-1.
8. van Zwieten L, Kimber S, Downie A, Morris S, Petty S, Rust J, Chan KY (2010) A glasshouse study on the interaction of low mineral ash biochar with nitrogen in a sandy soil. Soil Research, 48(7), 569-576.
https://doi.org/10.1071/SR10003.
9. Shaaban M, Peng QA, Hu R, Wu Y, Lin S, Zhao J (2015) Dolomite application to acidic soils: a promising option for mitigating N2O emissions. Environmental Science and Pollution Research, 22(24), 19961-19970.
https://doi.org/10.1007/s11356-015-5238-4.
10. Oo AZ, Sudo S, Akiyama H, Win KT, Shibata A, Yamamoto A, Hirono Y (2018) Effect of dolomite and
biochar addition on N2O and CO2 emissions from acidic tea field soil. PloS One, 13(2), e0192235.
https://doi.org/10.1371/journal.pone.0192235.
11. Lee SI, Kim GY, Choi EJ, Lee JS, Jung HC (2017) Decreases nitrous oxide emission and increase soil carbon via carbonized biomass application of orchard soil. Korean Journal of Environmental Agriculture, 36(2), 73-79.
https://doi.org/10.5338/KJEA.2017.36.2.13.
12. El-Naggar A, Usman AR, Al-Omran A, Ok YS, Ahmad M, Al-Wabel MI (2015) Carbon mineralization and nutrient availability in calcareous sandy soils amended with woody waste biochar. Chemosphere, 138, 67-73.
https://doi.org/10.1016/j.chemosphere.2015.05.052.
13. El-Naggar A, Awad YM, Tang XY, Liu C, Niazi NK, Jien SH, Lee SS (2018) Biochar influences soil carbon pools and facilitates interactions with soil: A field investigation. Land Degradation & Development, 29, 2162-2171. https://doi.org/10.1002/ldr.2896.
14. Xu Y, Seshadri B, Sarkar B, Rumpel C, Sparks DS, Bolan N (2018) Microbial control of soil carbon turnover, in: Nannipieri P, Hernandez T (eds.), The future of soil carbon. pp. 165-194, Academic Press.
https://doi.org/10.1016/B978-0-12-811687-6.00006-7.
15. Baggs EM (2011) Soil microbial sources of nitrous oxide: recent advances in knowledge, emerging challenges and future direction. Current Opinion in Environmental Sustainability, 3, 321-327.
https://doi.org/10.1016/j.cosust.2011.08.011.
16. Sistani KR, Jn-Baptiste M, Lovanh N, Cook KL (2011) Atmospheric emissions of nitrous oxide, methane, and carbon dioxide from different nitrogen fertilizers. Journal of Environmental Quality, 40, 1797-1805.
https://doi.org/10.2134/jeq2011.0197.
17. Gee GW, Bauder JW (1986) Particle size analysis.
Physical and mineralogical methods. American Society of Agronomy and Soil Science Society of America, 383-412.
18. National Institute of Agricultural Sciences (2000) Me- thods of soil and plant analysis, pp. 103-131, National Institute of Agricultural Sciences, Rural Development Administration, Korea.
19. McLaughlin H, Anderson PS, Shields FE, Reed TB (2009) All biochars are not created equal, and how to tell them apart. In Proceedings, North American Biochar Conference, pp. 1-36, Boulder, Colorado, USA.
20. Hutchinson GL, Livingston GP (1993) Use of chamber systems to measure trace gas fluxes. Agricultural ecosystem effects on trace gases and global climate
change. Agriculturaleco, 55, 63-78.
https://doi.org/10.2134/asaspecpub55.c4.
21. Yagi K (1991) Emission of biogenic gas compounds from soil ecosystem and effect of global environment, in: 2. Methane emission from paddy fields. Soil and Fertilizer Japan, 62(5), 556-562.
22. Major J, Steiner C, Downie A, Lehmann J (2009) Biochar effects on nutrient leaching, in: Lehmann J, Joseph S (eds.), Science and technology, pp. 67-84, Earthscan, London, UK.
23. Lee SI, Kim GY, Choi EJ, Lee JS, Jung HC (2018) Reduction of carbon dioxide and nitrous oxide emissions through various biochars application in the upland. Journal of the Korea Organic Resources Recycling Association, 26(2), 11-18.
https://doi.org/10.17137/korrae.2018.26.2.11.
24. Shinogi Y, Kanri Y (2003) Pyrolysis of plant, animal and human waste: physical and chemical characterization of the pyrolytic products. Bioresource Technology, 90, 241-247.
https://doi.org/10.1016/S0960-8524(03)00147-0.
25. Nichols GJ, Cripps JA, Collinson ME, Scott AD (2000) Experiments in waterlogging and sedimentology of charcoal: Results and implications. Paleogeography, Paleoclimatology, Paleoecology, 164, 43-56.
https://doi.org/10.1016/S0031-0182(00)00174-7.
26. Ascough PL, Sturrock CJ, Bird MI (2010) Investigation of growth responses in saprophytic fungi to charred biomass. Isotopes in Environmental and Health Studies, 46, 64-77.
https://doi.org/10.1080/10256010903388436.
27. Liu X, Zheng J, Zhang D, Cheng K, Zhou H, Zhang
A, Kuzyakov Y (2016) Biochar has no effect on soil respiration across Chinese agricultural soils. Science of the Total Environment, 554, 259-265.
https://doi.org/10.1016/j.scitotenv.2016.02.179.
28. Chantigny MH, Rochette P, Angers DA, Bittman S, Buckley K, Masse D. Gasser MO (2010) Soil nitrous oxide emissions following band-incorporation of fertilizer nitrogen and swine manure. Journal of Environmental Quality, 39, 1545-1553.
https://doi.org/10.2134/jeq2009.0482.
29. Hayakawa A, Akiyama H, Sudo S, Yagi K (2009) N2O and NO emissions from an Andisol field as influenced by pelleted poultry manure. Soil Biology and Biochemistry, 41, 521-529.
https://doi.org/10.1016/j.soilbio.2008.12.011.
30. Lehmann J, Gaunt J, Rondon M (2006) Bio-char sequestration in terrestrial ecosystems: a review. Mitigation and Adaptation Strategies for Global Change, 11, 403-427. https://doi.org/10.1007/s11027-005-9006-5.
31. Uchida Y, Moriizumi M, Shimotsuma M (2019) Effects of rice husk biochar and soil moisture on the accumulation of organic and inorganic nitrogen and nitrous oxide emissions during the decomposition of hairy vetch (Vicia villosa) mulch. Soil Science and Plant Nutrition, 65, 409-418.
https://doi.org/10.1080/00380768.2019.1624139.
32. Cui Z, Yue S, Wang G, Meng Q, Wu L, Yang Z, Chen X (2013) Closing the yield gap could reduce projected greenhouse gas emissions: a case study of maize production in China. Global Change Biology, 19(8), 2467-2477. https://doi.org/10.1111/gcb.12213.